
 ?Mathematical formulae have been encoded as MathML and are displayed in this HTML version using MathJax in order to improve their display. Uncheck the box to turn MathJax off. This feature requires Javascript. Click on a formula to zoom.
ABSTRACT
The relationship between ESG performance and equity returns has become a popular area of research, but the same is not yet the case for bond returns. In this paper, we explore whether incorporating ESG factors, beyond emissions into the bond portfolio investment process leads to under or out performance. We find that ESG investing in bond portfolios does not lead to over or under performance. In other words, you do not have to ‘pay to do good’. Further, in the period since the Paris agreement, Energy sector bond portfolio returns are positively related to ESG factors. This finding aligns with the theoretical prediction of Pedersen, Fitzgibbons, and Pomorski (2020), namely, that the ESG-return relationship should become positive as investors become more aware of ESG risks and opportunities. Overall, we show that Bond investors can ‘do well while doing good’.
I. Introduction
The global climate change emergency has accelerated the transition to more sustainable business practices in recent years. There is a vast literature exploring, empirically and theoretically, the effect of more responsible investment strategies on equity portfolio returns, showing that these strategies increase financial performance. However, far less attention has been paid to bond investments. In this article, we show that investing more responsibly in bond markets does not lead to under or over performance. Further, since the Paris agreement, as investors become more aware of sustainability issues, incorporating Environmental, Social and Governance (ESG) factors in the investment process can lead to outperformance in the Energy industry.
Climate change has drawn investor and owner attention towards ESG risks, opportunities and impacts. Climate change brings with it many new opportunities and risks for companies and investors. Just in the Energy sector, investment of 2.4 trillion USD per year is needed between 2016 and 2035 in order to stay in line with the 1.5 degrees of warming target. Companies that do not address climate change, by transitioning away from carbon intense practices, already face increasing financing costs due to new climate-related capital requirements and the general trend towards sustainable investing (Krueger, Sautner, and Starks Citation2020). In recent year’s investors and portfolio managers overseeing vast investments have been incorporating ESG factors, beyond pure climate change issues, in their investment processes to manage risks and capture opportunities. This growth can be easily seen in , which plots the number of signatories to the United Nations Principles of Responsible Investing (UN PRI). Further, global assets under management with ESG considerations grew from 22.8 Trillion to 30.7 Trillion USD, from 2016 to 2018 (GSIA Citation2019) and are projected to be in excess of 53 Trillion USD by 2025 using conservative growth assumptions (Bloomberg Citation2020). This raises the question of how do the risks and opportunities of sustainability affect investment returns?
Figure 1. United Nations Principles of Responsible Investing (UNPRI) signatories.

There is a developing literature providing equilibrium models of the relationship between ESG investing, investor ESG preferences/awareness and portfolio returns (Friedman and Heinle Citation2016; Pastor, Stambaugh, and Taylor Citation2020; Pedersen, Fitzgibbons, and Pomorski Citation2020). Pastor, Stambaugh, and Taylor (Citation2020) show that, in equilibrium, green assets will have a negative alpha, while brown assets will have a positive alpha. The negative alpha for green assets is driven by investor preference for green assets, as these can hedge climate risks. This exemplifies the ESG risk premium hypothesis, namely, investors are willing to give up some return in order to lower their ESG riskFootnote1 Pastor, Stambaugh, and Taylor (Citation2020) further show that the alpha of green holdings can be positive, reflecting the ESG alpha hypothesis, when investor tastes (and sufficient investments) shift to green assets, but this is counteracted when we have vast dispersion in ESG preferences among investors. Pedersen, Fitzgibbons, and Pomorski (Citation2020) add an ESG unaware mean-variance optimizing investor to their model and show that the larger the unaware investors proportional wealth the lower the returns to high ESG assets. Combining the theoretical findings of Pedersen, Fitzgibbons, and Pomorski (Citation2020) and Pastor, Stambaugh, and Taylor (Citation2020), whether there is outperformance or underperformance related to ESG factors depends on the dispersion of ESG preferences and the relative awareness of ESG risks by investors.
In either the ESG alpha (outperformance related to ESG) or the ESG risk premium (underperformance related to ESG) hypotheses, the performance of the assets is driven by the systematic risks associated with poor ESG performance (Jin Citation2018). Krueger, Sautner, and Starks (Citation2020) show that institutional investors believe that climate risks have material effects on their portfolios, while Amir and Serafeim (Citation2018) show that investors are integrating ESG practices mainly for financial performance reasons. For example, higher emissions indicate higher climate risks such as regulatory intervention, carbon pricing, commodity price risk (fossil fuels are burnt and create emissions) and technology risk (for example, cheaper renewable energy technology).
There are currently mixed empirical results on the relationship between ESG performance and financial performance (Auer and Schuhmacher Citation2016; Awaysheh et al. Citation2020; Revelli and Viviani Citation2015; Van Beurden and Gössling Citation2008). Several studies have found a negative relationship between ESG performance and financial performance. Luo and Balvers (Citation2017) for example, show that the negative screening of the worst ESG performers leads to outperformance in those excluded stocks. However, most of the recent literature documents a positive or non-negative relationship between Corporate Social Responsibility (CSR) or ESG, and financial performance (Busch and Friede Citation2018; Friede, Busch, and Bassen Citation2015; Margolis et al. Citation2007; Margolis, Elfenbein, and Walsh Citation2012; among others). Maiti (Citation2020) shows that a three-factor model with market, size and ESG factors outperforms popular asset pricing models and therefore ESG should be incorporated in the investment decision process. Gao, He, and Li (Citation2022) show that positive media ESG spotlight significantly reduces firms’ cost of debt especially for firms with poor governance. Further, some studies show that incorporating ESG factors into the investment process leads to outperformance (Ashwin Kumar et al. Citation2016; Pollard et al. Citation2017). In a recent study Bolton and Kacperczyk (Citation2021) found that stocks of companies with higher total carbon emissions, but not emission intensity, underperform for the period 2005 to 2017. They further show this is not driven by divestment, as divestment activity is minimal and industry specific, but rather by investors pricing carbon risk. Eccles, Verheyden, and Feiner (Citation2016) show that a 10% best in class ESG screen, that is removing the 10% worst ESG performing companies (more commonly called a negative screen), increases portfolio performance across a large range of investment approaches in developed and undeveloped markets.
Bond returns exhibit two important differences to stock returns, namely they have limited upside and are more exposed to downside risks (Bai, Bali, and Wen Citation2019). Therefore, they will likely be affected more by the predominantly downside risks, such as stranded assets and increased financing costs, that come with poor ESG performance. The increased downside risk of high emitting and/or low ESG firms is also well documented in the literature using realized returns (Jin Citation2018) and option implied measures (Ilhan, Sautner, and Vilkov Citation2018; Shafer and Szado Citation2019). Further, Albuquerque et al. (Citation2020) show that companies with higher Environmental and Social performance are more resilient to crisis by examining the COVID-19 pandemic, which caused a major global downturn. Following a similar theory as in stock markets, only that the downside risks are even more severe, bond returns may be positively (ESG alpha) or negatively (ESG premium) related to ESG performance, depending on the awareness and integration of these risks by bond investors.
Many studies have explored the relationship between ESG, at least the E component, and stock returns, but studies on bond returns and ESG performance are still few in number. Huynh and Xia (Citation2020) show that corporate bond returns, which are more sensitive to climate change news, earn lower returns. This is consistent with the idea of higher demand for bonds, which can be used to hedge climate change. Duan, Li, and Wen (Citation2020) explore the relationship between environmental performance of firms and their bond returns more directly. They find a significant positive relationship between lower carbon intensity and bond returns, in line with the ESG (carbon) alpha hypothesis, rather than the ESG (carbon) premium hypothesis. Cao et al. (Citation2021) follow a similar approach to show that firms with higher emissions experience worse liquidity conditions. Henke (Citation2016) shows that 103 socially responsible bond funds in the US and European Union (EU) have outperformed a matched sample of conventional funds, attributable mostly to mitigation of ESG risks through screening. Bahra and Thukral (Citation2020) show that ESG ratings are additive to traditional credit ratings and can be used to enhance bond portfolio returns. Jang et al. (Citation2020) show that ESG performance leads to outperformance of their bonds, in a Korean bond market sample. Kumar and Khasnis (Citation2020) show that the impact of a credit downgrade on bond returns is lessened if the ESG rating of the firm is high.
Some studies explore the relationship between ESG performance and credit risk/performance in other markets. Henisz and McGlinch (Citation2019) explore media controversies on indigenous land claims and biodiversity as a mechanism for the link between ESG and credit risk. Bae, Chang, and Yi (Citation2018b) and Bae, Chang, and Yi (Citation2018a) show that there is a relationship between CSR strengths and concerns with syndicated and private bank loan spreads, respectively.
In this study, we extend the work of Duan, Li, and Wen (Citation2020) by examining the relationship of firms overall ESG, and specific E, S and G performance, with bond returns, rather than focussing on carbon intensity only. We analyse this relationship using two approaches, firstly we perform portfolio sorts on our corporate bond return sample by E, S, G and ESG ratings and explore the returns of high minus low (H-L) ESG factor portfolios. We then calculate risk-adjusted alphas to explore whether any ESG out or under performance persists when we employ the well-accepted Carhart (Citation1997) four-factor model. Secondly, we explore the predictive power of ESG factors for corporate bond returns, employing a cross-sectional analysis with the well-established bond return model of Bai, Bali, and Wen (Citation2019). We find that incorporating ESG factors does not lead to out or under performance in bond portfolios and ESG factors do not predict bond returns. This shows that investors can create responsible investment strategies in bond markets, without having to pay a premium, but there is also no outperformance associated with ESG factors in bond portfolios over our sample period. This is similar to the early results in equity markets as reported by Hamilton, Jo, and Statman (Citation1993). Therefore, investors can do well while doing good, as doing good does not decrease returns, in their bond investments.
Pastor, Stambaugh, and Taylor (Citation2020) show, in an equilibrium model, that high ESG stocks could outperform if investors ESG preferences strengthen over the period analysed. Therefore, we study the sub-sample since the Paris agreement was signed, arguably the most significant global environmental agreement to date. Again, we find that there is no significant under or outperformance of bond returns associated with ESG factors, even after this important piece of regulation. It seems that bond investors are not yet concerned with wider ESG issues, although carbon emissions do affect bond returns (Duan, Li, and Wen Citation2020). ESG risks seem to not be priced significantly in bond markets, although these could be the most exposed to major downside risks.
Landry, Castillo-Lazaro, and Lee (Citation2017) explore the relationship, with some controls, between ESG ratings and credit default spreads, finding that this relationship is stronger in some sectors. Further, Consolandi, Eccles, and Gabbi (Citation2022), show that ESG factors have more effect on equity returns in sectors where such risks are more material. To investigate if the more exposed Energy industry’s bonds might be pricing ESG risks and opportunities we split the sample into bonds of firms in the Energy industry, as defined by the Industry Classification Benchmark (ICB), and those not in the Energy industry. The Energy industry faces vast political and societal pressure for their emissions. For the Energy sector, we find significant bond portfolio outperformance associated with company Environmental scores, in the post-Paris agreement period. This shows that ESG risks and opportunities are being priced in the Energy bond market, but this is a recent phenomenon and is likely driven by trends in
Our results show that incorporating ESG factors into the bond investment process does not infer an ESG premium for more responsible investing strategies. Our results are robust to using three different ESG rating providers, Refinitiv, Sustainalytics and Bloomberg ESG disclosure scores and the average of the three rating providers. This is important as recent papers have found that ESG ratings diverge significantly across providers (Berg, Koelbel, and Rigobon Citation2022; Berg et al. Citation2022; Chatterji et al. Citation2016). This differs to the more mature ESG investing industry in equity markets, which has driven a shift from the ESG alpha to the ESG premium, likely through increased awareness and demand by investors. Taken together with the results of Duan, Li, and Wen (Citation2020) this suggests that bond investors can still enjoy a first mover advantage, potentially being ‘paid to do good’ and certainly not ‘paying to do good’, if they move to a more responsible investing strategy, particularly in the Energy industry.
The remainder of this paper is organized as follows. We begin by describing our sample in section II. We report our method and empirical findings in section III before concluding the paper in section IV.
II. Data
ESG data
Weekly Refinitv ESG data from January 2004 to March 2020 is collected through DataStream. The Refinitiv ESG database provides the Environmental score (E score), Social score (S score), Governance score (G score), ESG score (ESG score), and ESG plus score (ESG+ score)Footnote2 Not all bond issuers ESG scores are updated simultaneously and as with financial reporting there is a lag effect from the reported data.Footnote3 Therefore, to make sure the ESG information is available to investors at the time we are investigating performance, following Grullon, Kaba, and Núñez-Torres (Citation2020), we use ESG at the end of year t-2 to examine bond returns in year t. After incorporating this lag, our final sample is from January 2006 to March 2020.
Panel A of reports the time-series average of the cross-sectional ESG scores. We find that the average S score and G score are 60.00 and 61.37, respectively, which are higher than the average E score at the value of 56.95. The average ESG score is 58.16, which is higher than ESG+ score, as can be expected as the ESG+ score incorporates a negative adjustment when there are negative ESG news for the company. The correlation between ESG score and ESG+ score given in Panel B, is 0.58, which means that ESG score and ESG+ score are sufficiently different to motivate the investigation of the ESG+ score in this paper. In addition, we find that the E score and S score have a high correlation at the value of 0.63. This reveals that a firm with high E score tends to have high S score. G score has a relatively low correlation with E score and S score (i.e. 0.16 and 0.23).
Table 1. Summary statistics.
Several studies have shown that ESG ratings provided by different companies are not well correlated and seem to diverge (Berg, Koelbel, and Rigobon Citation2022; Chatterji et al. Citation2016), which is driven mostly by scope and measurement divergence rather than the weighting of ESG indicators (Berg, Koelbel, and Rigobon Citation2022). To make sure our results are not dependant on the Refinitiv ESG ratings we re-run all of our analysis using the Bloomberg ESG disclosure scores and the Sustainalytics ESG rankings, accessed through the Bloomberg Professional Services, and the average of all three ESG provider scores. Berg et al. (Citation2022) have developed more sophisticated methodologies for combining ESG ratings, but this is left for future research as these methods are still in development. Employing more ESG ratings data providers and the relationship with bond returns is left for future research, particularly the ratings from TruValue Labs, which employ dynamic materiality (Bala et al. Citation2020; Kuh et al. Citation2020) and can address some of the concerns of the important measurement errors related to materiality described by Yoon and Serafeim (Citation2022).
Bond return data
The monthly bond returns data (RET_EOM) are obtained from the Wharton Research Data Services (WRDS) Bond Database. Although these data are available from July 2002, due to the availability of ESG data, we select the sample period from January 2006 to March 2020. The WRDS database follows the cleaning procedures outlined in Asquith, Covert, and Pathak (Citation2013) and Dick-Nielsen (Citation2009, Citation2013) to clean TRACE Enhanced data. The WRDS Bond Database also provide the offering date (OFFERING_DATE), offering amount (OFFERING_AMT), offering price (OFFERING_PRICE), FISD coupon rate (COUPON), numerical rating (RATING_NUM), time to maturity in years (TMT), bond price at the end of month (PRICE_EOM) and total par-value volume (T_Volume) variables. Following (Bai, Bali, and Wen Citation2019), we further filter out bonds that trade under $5 or above $1,000, have less than one year to maturity or have transaction records that have trading volume of less than $10,000. Overall, our filtering criteria are consistent with Bai, Bali, and Wen (Citation2019).
Now we define the monthly excess bond returns (ExRet) as
where is the monthly risk-free rate (i.e. the one-month Treasury bill rate) obtained from Kenneth R. French Data Library via WRDS.
Panel A of reports the time-series average of the cross-sectional excess bond returns. It shows there are 487,132 bond month-return observations in our sample period. Moreover, we find that the average excess bond return is 0.44% with a large standard deviation of 3.07%. The percentiles from 1st to 99th vary from−7.34% to 8.45%. These summary statistics are very close to those reported by Bai, Bali, and Wen (Citation2019).
Bond characteristics data
For the bond illiquidity (ILLIQ), we get the daily bond price (PRICE) from TRACE Enhanced data file via WRDS. Following Bao, Pan, and Wang (Citation2011) and Bai, Bali, and Wen (Citation2019), we construct ILLIQ as follows:
where is the log price change for the bond on day d of month t.
The bond size in million dollars (SIZE) is defined as the offering amount (OFFERING_AMT) times offering price (OFFERING_PRICE) divided by 1,000,000. We calculate average size-weighted returns for all bonds and for each month t as the market bond return (MKT_BOND). In line with Bai, Bali, and Wen (Citation2019), we run the following regression to estimate bond beta (BETA_BOND) using a three year rolling window, as belowFootnote4
where is the regression residual.
In addition, we calculate the bond age in years (AGE) using offering date (OFFERING_DATE), the numerical rating (RATING_NUM) is to capture the credit risk of bonds, the current bond return (RET_EOM) captures the bond reversal. FISD coupon rate (COUPON) and time to maturity in years (TMT) are provided by the WRDS Bond Database.
Based on the time-series average of the cross-sectional bond characteristics given in Panel A of , we find that the average bond beta is 1.01 which is very close to one. The average bond illiquidity is 1.16. Furthermore, the average coupon rate, time to maturity, issue size, bond age and median rating are 4.50%, 9.41 years, and $52.81 million, 4.90 years and BBB+, respectively.
III. Results
ESG ratings and bond portfolio performance
We now turn to our initial analysis of the ESG factors relationship with bond returns following two approaches. The first approach is the time series analysis exploring the performance of E, S, G, ESG and ESG+ sorted portfolios, in a univariate setting. We then examine the relationship between ESG factors and future return in a cross-sectional regression, in both a univariate and multivariate setting.
For each month, , we form decile portfolios based upon each ESG factors (i.e. E score, S score, G score, ESG score, and ESG+ score) in month
. Portfolio L contains stocks with the lowest ESG scores and Portfolio H contain stocks with the highest ESG scores in the prior month. We calculate the monthly equal- and value-weighted returns for each decile portfolio. After that, we also calculate high-minus-low (H-L) portfolio returns (
) and their risk-adjusted alphas based on Carhart (Citation1997) four-factor model as follows.
where the market return factor (MKT), size factor (SMB), value factor (HML), and momentum factor (UMD) are obtained from Kenneth R. French Data Library via WRDSFootnote5
shows the average excess return of the H-L portfolios and their risk-adjusted alphas, sorted on the ESG factors in a univariate setting. We adjust test statistics using the method of (Newey and West Citation1987). From , we can see that none of the ESG factor high-minus-low (H-L) portfolios have significant out or under performance, as the average excess return is not significantly different from zero. This provides the first evidence that incorporating ESG factors in the portfolio formation process, therefore investing more responsibly, does not have to come at a cost, through lower returns. Turning to the Carhart (Citation1997) four-factor model alphas, we find very similar results. The E factor equally weighted H-L portfolio alpha now becomes significantly positive, at the 10% level, although the significance dissipates for the value weighted H-L portfolio. We can further see this represented graphically in , which presents H-L cumulative returns over the sample. These results hint that there may actually be an opportunity for outperformance when incorporating the E-factor in bond portfolio formation and maybe a more complex strategy can take advantage of this more directly. It is interesting to note that the market return factor (MKT) seems to be the most influential driver of bond returns.
Figure 2. Cumulative returns to ESG bond portfolios.
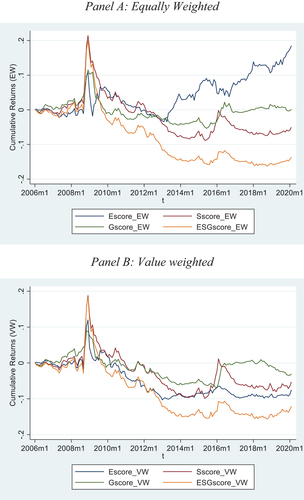
Table 2. Full sample ESG sorted portfolio returns.
Further, in , ESG ratings, and particularly the S score, may provide outperformance during financial downturns as can be seen by the spike in returns during the GFC. This would be consistent with the results found in equity markets, that high ESG (or at least E) performance companies are more resilient during market downturns (Albuquerque et al. Citation2020) and exhibit lower expected downside risk, as measured by option market indicators (Ilhan, Sautner, and Vilkov Citation2018; Shafer and Szado Citation2019).
Next, we run the Fama and Macbeth (Citation1973) cross-sectional regressions as follows:
where is E score, S score, G score, ESG score, or ESG+ score and
are the control variables from Bai, Bali, and Wen (Citation2019).
The results with Newey and West (Citation1987) t-statistics are presented in first without any control variables and then controlling for a comprehensive list of established bond characteristic return factors (Bai, Bali, and Wen Citation2019). We can see that none of the ESG factors significantly affect next month bond returns, on their own and when we control for other factors, confirming the time series results above. The only exception is the G score, which leads to significantly lower next month bond returns, but only when the control variables are included. Here, the Bond beta (BETA_BOND), Illiquidity (ILLIQ) and previous month return (RET_EOM) factors seem to explain bond returns the most.
Table 3. Full sample cross-sectional analysis.
Overall, these results suggest that over our sample period, January 2006 to March 2020, ESG performance does not lead to under or over performance in bond returns. This is an interesting finding, as discussed earlier, as it seems bond returns do not exhibit an ESG premium or ESG alpha effect and this may be due to the lack of ESG preferences in the institutional investor driven corporate bond market. This could be explained by a lag in bond investors’ awareness of ESG risk factors, or intention to invest responsibly relative to equity investors.
Post Paris agreement
In an equilibrium model (Pastor, Stambaugh, and Taylor Citation2020)) show that as the ESG concerns of investors strengthen, green assets could outperform. To test this hypothesis in bond returns, we repeat the above analysis, but only for the period after the Paris agreement (December 2015 – March 2020). The Paris agreement is the most ambitious international agreement to combat climate change in history (Diaz-Rainey et al. Citation2021). Diaz-Rainey et al. (Citation2021) show that the Paris agreement was more significant for the returns of the fossil fuel industry than some other significant climate policy events, such as the election of Donald Trump to the U.S. presidency or his subsequent withdrawal from the agreement.
In , we can see that the there is certainly no significant under or out performance when ESG factors are used to create bond portfolios, even after the Paris agreement was signed. The equally weighted E factor H-L portfolio does display significant outperformance, at the 5% level of significance, in a univariate setting. shows this graphically, as the cumulative returns of the equally weighted H-L E score portfolio starts to trend upward strongly after 2015. However, this outperformance becomes insignificant in the value weighted portfolio and when we incorporate the other bond return factors in the equally weighted portfolio. Again, we see the dominance of the MKT factor. This shows there is some potential for outperformance when incorporating Environmental factors, in line with Duan, Li, and Wen (Citation2020), who show that bond portfolios outperform when incorporating carbon intensity. This shows that bond investors are not incorporating other environmental factors, which are included in the E score, as strongly as scope 1 and 2 Green House Gas (GHG) emissions intensity, as they are for equity portfolios where some studies have found significant outperformance (ESG alpha) and underperformance (ESG risk premium), when incorporating ESG factors (Ashwin Kumar et al. Citation2016; Bolton and Kacperczyk, Citation2021; Busch and Friede Citation2018; Eccles, Verheyden, and Feiner Citation2016; Friede, Busch, and Bassen Citation2015; Luo and Balvers Citation2017; J. Margolis, Elfenbein, and Walsh Citation2012; Pollard et al. Citation2017; Revelli and Viviani Citation2015; Van Beurden and Gössling Citation2008).
Table 4. Post-Paris ESG sorted portfolio returns.
Further, in we display the cross-sectional regression results, defined in EquationEquation (5)(5)
(5) , for the post-Paris agreement sample period (December 2015 – March 2020). The results are very similar to the time-series analysis, the E factor is positively related to next-month bond returns with some significance, at the 10% level, but only in the univariate setting. Once we add the control variables the predictive power of the E factor is consumed by the bond beta (BETA_BOND), illiquidity (ILLIQ) and previous month return (RET_EOM) factors and none of the ESG factors are related to under or outperformance in the cross-section.
Table 5. Post-paris cross-sectional analysis.
These findings are consistent with our full sample results, which showed that incorporating ESG factors in the investment process does not lead to under or over performance. This is still the case since the Paris agreement. However, there is some evidence that incorporating the environmental score (E) is starting to improve bond portfolio performance more recently.When we explore this relationship with the ESG scores from the other two providers, we get consistent results.
Energy sector
To explore the previous results further, we analysed the performance of the Energy and non-Energy industry bond returns, by splitting the sample and applying the same methodology as above. Footnote6 The energy sector is most at risk of the most accepted/prominent ESG issue, climate change, and therefore presents the strongest case for incorporating ESG factors in the portfolio construction process to outperform the market (Diaz-Rainey et al. Citation2021).
Firstly, we explore the relationship between ESG scores and bond portfolio returns for the full sample, as in Section 3.1, but separating firms into Energy and non-Energy industry entities. The results for the equally and value weighted portfolio time series analysis are presented in , respectively. Different to the previous subsections, we sort portfolios into two instead of ten portfolios, as there are only 51 bonds per month on average for the energy sector. Interestingly, using value or equally weighted portfolios, we find that over the full sample the S score can lead to some outperformance for Energy company bond portfolios. In , we can see that this seems to be mainly driven by the outperformance during Global Financial Crisis (GFC) period. Further, incorporating the G score seems to lead to significant underperformance for non-Energy industry bond portfolios. These results hold with (Carhart Citation1997) model adjusted alphas. When we turn to the cross-sectional analysis in , the significance of the S score fades, but the G score still leads to significant underperformance for non-Energy industry bonds, only after incorporating the control variables from (Bai, Bali, and Wen Citation2019). This shows that the result for the G score also found in the full sample analysis is driven by non-Energy companies.
Figure 3. Cumulative returns to ESG bond portfolios energy and non energy.
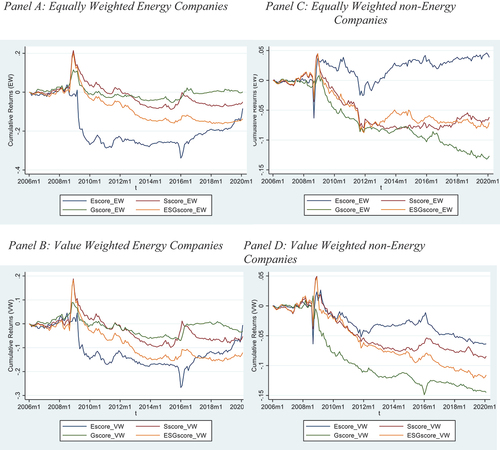
Table 6. Energy and non-energy ESG sorted portfolio returns: equally weighted portfolios.
Table 7. Energy and non-energy ESG sorted portfolio returns: value weighted portfolios.
Table 8. Energy and non-energy cross-sectional analysis.
Next we want to explore the post-Paris relationships as in section 3.2, but for the Energy and non-Energy industry bonds. We first turn to the time series approach, employing the portfolio sorts with the ESG factors, the equally and value weighted portfolio returns are presented in , respectively. We can see in the equally weighted returns () that the ESG and ESG+ sorted Energy industry H-L bond portfolios exhibit statistically significant outperformance, even when employing the four factor model, at the 5% level of significance. Looking at the individual factor portfolios we can see that this is mainly driven by the E factor, which is significant at the 5% and 1% level of significance for the univariate and four-factor model results, respectively. The outperformance is also somewhat attributable to the S factor, as portfolios formed on this have significantly positive returns at the 10% level, for both the univariate and four-factor analysis. For non-Energy industry bonds, we see that none of the ESG factors lead to under or outperformance. Turning to the value-weighted portfolios in , we find confirming results, the ESG, ESG+, E and S factors lead to outperformance for Energy industry bonds, even when controlling for the four-factor model, but only since the Paris agreement was signed in 2015. gives us a graphical representation of this result, for Energy company bonds the cumulative return trends upward for the E factor H-L portfolios.
Table 9. Post-paris energy and non-energy ESG sorted portfolio returns: equally weighted portfolios.
Table 10. Post-Paris energy and non-energy ESG sorted portfolio returns: value weighted portfolios.
Turning to the cross-sectional analysis, in , we see some significance of the E factor in the Energy sector and still positive but less significant predictive power in the non-Energy sectors. When we incorporate established bond characteristics as control variables (Balie et al. Citation2019), the significance disappears, but there is no significant negative relationship either.
Table 11. Post-Paris energy and non-energy cross-sectional analysis.
These results quite clearly indicate that in the Energy sector, currently the most at risk sector to climate change, bond investment strategies may benefit from incorporating Environmental factors and certainly do not face a loss of returns. In the future as more of the risks and opportunities of climate change become more prominently accepted and even realized, other sector bond returns may find similar outperformance when incorporating E factors.
IV. Conclusion
Duan, Li, and Wen (Citation2020) showed that incorporating emission intensity data in the bond portfolio formation process leads to significant outperformance. In this paper, we wanted to explore whether incorporating wider ESG factors, into the bond investing process leads to under or out performance. We find that this does not lead to either. However, in the period following the Paris agreement, Energy sector bond portfolio returns are positively related to ESG factors. This finding aligns with the model of Pedersen, Fitzgibbons, and Pomorski (Citation2020), that shows that the ESG-return relationship strengthens as investors become more aware of ESG risks and opportunities. We argue that investors in Energy sector bonds, especially since the singing of the Paris agreement, would be more aware of these fundamental ESG risks and opportunities and are therefore the first to account for this in their valuations of bonds. Overall, our findings show that bond investors can ‘do well’, if not better, by ‘doing good’.
We wanted to explore whether green bond portfolios, with investors that are likely more aware of ESG issues, would exhibit under or out performance when incorporating ESG factors. Therefore, we repeated all of the analysis for a subset of only green bonds, as certified by the Climate Bonds Initiative. Overall, we again found no under or over performance attributable to ESG ratings.
To ensure our results are robust to the divergence of ESG rating providers (Berg, Koelbel, and Rigobon Citation2022; Chatterji et al. Citation2016) we explore all of our analyses employing the Bloomberg ESG disclosure scores and the Sustainalytics ESG rankings and the average of all three ESG scores. Our key finding remains the same; that is incorporating ESG scores in bond portfolios does not lead to under or over performance.
Acknowledgments
We would like to acknowledge the Climate and Energy Finance Group for strong support on this work and the Otago University Research Grant that enabled this research to be carried out.
Disclosure statement
No potential conflict of interest was reported by the author(s).
Notes
1 show that during the start of the COVID-19 pandemic investors preferred low-ESG risk funds..
2 The ESG plus score is provided by Refinitiv and is the ESG score overlaid with their ESG controversies, which captures controversial ESG news for the target company, so that the ESG score will be decreased if the company exhibits negative ESG news..
3 ESG information is collected by Refinitiv based on publicly available sources such as company websites, annual reports, and corporate social responsibility reports or contributed by firms and then audited and standardized.
4 We require that there are at least two-years of data, i.e. at least 24 data points.
5 We also explore the bond market four factor model of (Bai et al. Citation2021), but for the reduced sample period ending into 2019 due to data availability, and our conclusions are robust..
6 The industry is defined using the Industry Classification Benchmark (ICB) accessed through the Bloomberg Professional Services.
References
- Albuquerque, R., Y. Koskinen, S. Yang, and C. Zhang. 2020. “Resiliency of Environmental and Social Stocks: An Analysis of the Exogenous COVID-19 Market Crash.” The Review of Corporate Finance Studies 9 (3): 593–621. doi:https://doi.org/10.1093/rcfs/cfaa011.
- Amir, A. Z., and G. Serafeim. 2018. “Why and How Investors Use ESG Information: Evidence from a Global Survey.” Financial Analysts Journal 74 (3): 87–103. doi:10.2469/faj.v74.n3.2.
- Ashwin Kumar, N. C., C. Smith, L. Badis, N. Wang, P. Ambrosy, and R. Tavares. 2016. “ESG Factors and Risk-Adjusted Performance: A New Quantitative Model.” Journal of Sustainable Finance and Investment 6 (4): 292–300. doi:10.1080/20430795.2016.1234909.
- Asquith, P., T. Covert, and P. Pathak. 2013. The Effects of Mandatory Transparency in Financial Market Design: Evidence from the Corporate Bond Market. doi:10.3386/w19417.
- Auer, B. R., and F. Schuhmacher. 2016. “Do Socially (Ir)responsible Investments Pay? New Evidence from International ESG Data.” The Quarterly Review of Economics and Finance 59: 51–62. doi:https://doi.org/10.1016/j.qref.2015.07.002.
- Awaysheh, A., R. A. Heron, T. Perry, and J. I. Wilson. 2020. “On the Relation Between Corporate Social Responsibility and Financial Performance.” Strategic Management Journal 41 (6): 965–987. doi:10.1002/smj.3122.
- Bae, S. C., K. Chang, and H. C. Yi. 2018a. “Are More Corporate Social Investments Better? Evidence of Non-Linearity Effect on Costs of US Bank Loans.” Global Finance Journal 38: 82–96. doi:10.1016/j.gfj.2018.03.002.
- Bae, S. C., K. Chang, and H. C. Yi. 2018b. “Corporate Social Responsibility, Credit Rating, and Private Debt Contracting: New Evidence from Syndicated Loan Market.” Review of Quantitative Finance and Accounting 50 (1): 261–299. doi:10.1007/s11156-017-0630-4.
- Bahra, B., and L. Thukral. 2020. “ESG in Global Corporate Bonds: The Analysis Behind the Hype.” The Journal of Portfolio Management 46 (8): 133–147. doi:10.3905/jpm.2020.1.171.
- Bai, J., T. G. Bali, and Q. Wen. 2019. “Common Risk Factors in the Cross-Section of Corporate Bond Returns.” Journal of Financial Economics 131 (3): 619–642. doi:10.1016/j.jfineco.2018.08.002.
- Bai, J., T. G. Bali, and Q. Wen. 2019.“Common risk factors in the cross-section of corporate bond returns.“ Journal of Financial Economics, 131(3): 619–642.
- Bai, J., T. G. Bali, and Q. Wen. 2021.“Is there a risk-return tradeoff in the corporate bond market? Time-series and cross-sectional evidence.“ Journal of Financial Economics, 142(3): 1017–1037.
- Bala, G., S. Birman, J. Cardamone, T. Kuh, A. Salvatori, and N. Stelea. 2020. “ESG Materiality Factors in the Fourth Industrial Revolution-Measuring Stakeholder Externalities via Dynamic Materiality.” Working Paper, Available at SSRN 3751058.
- Bao, J., J. Pan, and J Wang. 2011.“The illiquidity of corporate bonds.“ Journal of Finance, 66(3): 911–946.
- Berg, F., J. F. Koelbel, A. Pavlova, and R. Rigobon. 2022. “ESG Confusion and Stock Returns: Tackling the Problem of Noise (No. W30562).” National Bureau of Economic Research.
- Berg, F., J. F. Koelbel, and R. Rigobon. 2022. “Aggregate Confusion: The Divergence of ESG Ratings.” Review of Finance 26 (6): 1315–1344. doi:10.1093/rof/rfac033.
- Bloomberg. 2020. ESG Assets May Hit $53 Trillion by 2025, a Third of Global AUM | Bloomberg Professional Services. https://www.bloomberg.com/professional/blog/esg-assets-may-hit-53-trillion-by-2025-a-third-of-global-aum/
- Bolton, P., and M. Kacperczyk. 2021. “Do Investors Care About Carbon Risk?” Journal of Financial Economics 142 (2): 517–549. doi:https://doi.org/10.1016/j.jfineco.2021.05.008.
- Busch, T., and G. Friede. 2018. “The Robustness of the Corporate Social and Financial Performance Relation: A Second-Order Meta-Analysis.” Corporate Social Responsibility and Environmental Management 25 (4): 583–608. doi:10.1002/csr.1480.
- Cao, J., Y. Li, X. Zhan, W. Zhang, and L. Zhou. 2021. Carbon Emissions, Institutional Trading, and the Liquidity of Corporate Bonds.
- Carhart, M. M. 1997. “On Persistence in Mutual Fund Performance.” The Journal of Finance 52 (1): 57–82. doi:https://doi.org/10.1111/j.1540-6261.1997.tb03808.x.
- Chatterji, A. K., R. Durand, D. I. Levine, and S. Touboul. 2016. “Do Ratings of Firms Converge? Implications for Managers, Investors and Strategy Researchers.” Strategic Management Journal 37 (8): 1597–1614. doi:10.1002/smj.2407.
- Consolandi, C., R. G. Eccles, and G. Gabbi. 2022. “How Material is a Material Issue? Stock Returns and the Financial Relevance and Financial Intensity of ESG Materiality.” Journal of Sustainable Finance & Investment 12 (4): 1045–1068. doi:10.1080/20430795.2020.1824889.
- Diaz-Rainey, I., S. A. Gehricke, H. Roberts, and R. Zhang. 2021. “Trump Vs. Paris: The Impact of Climate Policy on U.S. Listed Oil and Gas Firm Returns and Volatility.” International Review of Financial Analysis 76: 101746. doi:10.1016/j.irfa.2021.101746.
- Dick-Nielsen, J. 2009. “Liquidity Biases in Trace.” The Journal of Fixed Income 19 (2): 43–55. doi:https://doi.org/10.3905/jfi.2009.19.2.043.
- Dick-Nielsen, J. 2013. “How to Clean Enhanced TRACE Data.” SSRN Electronic Journal. doi:10.2139/ssrn.2337908.
- Duan, T., F. W. Li, and Q. Wen. 2020. “Is Carbon Risk Priced in the Cross Section of Corporate Bond Returns?” SSRN Electronic Journal. doi:10.2139/ssrn.3709572.
- Eccles, R. G., T. Verheyden, and A. Feiner. 2016. “ESG for All? The Impact of ESG Screening on Return, Risk, and Diversification.” In SSRN. Vol. 28, Issue 2. John Wiley & Sons, Ltd. doi:10.1111/jacf.12174.
- Fama, E. F., and J. D. Macbeth. 1973. “Risk, Return, and Equilibrium: Empirical Tests.” Source: The Journal of Political Economy 81 (3): 607–636. doi:10.1086/260061.
- Friede, G., T. Busch, and A. Bassen. 2015. “ESG and Financial Performance: Aggregated Evidence from More Than 2000 Empirical Studies.” Journal of Sustainable Finance and Investment 5 (4): 210–233. doi:10.1080/20430795.2015.1118917.
- Friedman, H. L., and M. S. Heinle. 2016. “Taste, Information, and Asset Prices: Implications for the Valuation of CSR.” Review of Accounting Studies 21 (3): 740–767. doi:10.1007/s11142-016-9359-x.
- Gao, H., J. He, and Y. Li. 2022. “Media Spotlight, Corporate Sustainability and the Cost of Debt.” Applied Economics 54 (34): 3989–4005. doi:10.1080/00036846.2021.2020710/SUPPL_FILE/RAEC_A_2020710_SM8504.PDF.
- Grullon, G., Y. Kaba, and A. Núñez-Torres. 2020. “(19 C.E.). When Low Beats High: Riding the Sales Seasonality Premium.” Journal of Financial Economics 138 (2): 572–591. doi:https://doi.org/10.1016/j.jfineco.2020.06.003.
- GSIA. 2019. 2018 Global Sustainable Investment Review.
- Hamilton, S., H. Jo, and M. Statman. 1993. “Doing Well While Doing Good? The Investment Performance of Socially Responsible Mutual Funds.” Financial Analysts Journal 49 (6): 62–66. doi:10.2469/faj.v49.n6.62.
- Henisz, W. J., and J. McGlinch. 2019. “ESG, Material Credit Events, and Credit Risk.” Journal of Applied Corporate Finance 31 (2): 105–117. doi:10.1111/jacf.12352.
- Henke, H. M. 2016. “The Effect of Social Screening on Bond Mutual Fund Performance.” Journal of Banking & Finance 67: 69–84. doi:10.1016/j.jbankfin.2016.01.010.
- Huynh, T. D., and Y. Xia. 2020. “Climate Change News Risk and Corporate Bond Returns.” The Journal of Financial and Quantitative Analysis 1–49. doi:10.1017/S0022109020000757.
- Ilhan, E., Z. Sautner, and G. Vilkov. 2018. “Carbon Tail Risk.” SSRN Electronic Journal. doi:10.2139/ssrn.3204420.
- Jang, G. Y., H. G. Kang, J. Y. Lee, and K. Bae. 2020. “ESG Scores and the Credit Market.” Sustainability (Switzerland) 12 (8): 3456. doi:10.3390/SU12083456.
- Jin, I. 2018. “Is ESG a Systematic Risk Factor for US Equity Mutual Funds?” Journal of Sustainable Finance and Investment 8 (1): 72–93. doi:10.1080/20430795.2017.1395251.
- Krueger, P., Z. Sautner, and L. T. Starks. 2020. “The Importance of Climate Risks for Institutional Investors.” The Review of Financial Studies 33 (3): 1067–1111. doi:10.1093/rfs/hhz137.
- Kuh, T., A. Shepley, G. Bala, and M. Flowers. 2020. “Dynamic Materiality: Measuring What Matters.” Working Paper, Available at SSRN 3521035.
- Kumar, R., and A. Khasnis. 2020. “Fallen Angels with ESG Wings.” The Journal of Impact and ESG Investing 1 (2): 26–38. doi:https://doi.org/10.3905/JESG.2020.1.007.
- Landry, E., M. Castillo-Lazaro, and A. Lee. 2017. “Connecting ESG and Corporate Bond Performance.” MIT Sloan Working Paper.
- Luo, H. A., and R. J. Balvers. 2017. “Social Screens and Systematic Investor Boycott Risk.” The Journal of Financial and Quantitative Analysis 52 (1): 365–399. doi:10.1017/S0022109016000910.
- Maiti, M. 2020. “Is ESG the Succeeding Risk Factor?” Journal of Sustainable Finance & Investment 1–15. doi:10.1080/20430795.2020.1723380.
- Margolis, J. D., H. A. Elfenbein, and J. P. Walsh. 2012. “Does It Pay to Be Good…and Does It Matter? A Meta-Analysis of the Relationship Between Corporate Social and Financial Performance.” SSRN Electronic Journal. doi:10.2139/ssrn.1866371.
- Margolis, J., J. D. Margolis, H. A. Elfenbein, and J. P. Walsh. 2007. Does It Pay to Be Good…and Does It Matter? A Meta-Analysis of the Relationship Between Corporate Social and Need to Cite This Paper? Want More Papers Like This?
- Newey, W. K., and K. D. West. 1987. “Hypothesis Testing with Efficient Method of Moments Estimation.” International Economic Review 28 (3): 777. doi:10.2307/2526578.
- Pastor, L., R. F. Stambaugh, and L. A. Taylor. 2020. “Sustainable Investing in Equilibrium.” Journal of Financial Economics. doi:10.2139/ssrn.3559432.
- Pedersen, L. H., S. Fitzgibbons, and L. Pomorski. 2020. “Responsible Investing: The ESG-Efficient Frontier.” Journal of Financial Economics, Forthcoming January: 1–49. doi:10.2139/ssrn.3466417.
- Pollard, J., J. L. Pollard, M. W. Sherwood, and R. G. Klobus. 2017. “Establishing ESG as Risk Premia.” The Journal of Investment Management 16 (1): 32–43.
- Revelli, C., and J. L. Viviani. 2015. “Financial Performance of Socially Responsible Investing (SRI): What Have We Learned? A Meta-Analysis.” Business Ethics 24 (2): 158–185. doi:10.1111/beer.12076.
- Shafer, M., and E. Szado. 2019. “Environmental, Social, and Governance Practices and Perceived Tail Risk.” Accounting & Finance 60 (4): 4195–4224. doi:10.1111/acfi.12541.
- Van Beurden, P., and T. Gössling. 2008. “The Worth of Values - a Literature Review on the Relation Between Corporate Social and Financial Performance.” Journal of Business Ethics 82 (2): 407–424. doi:10.1007/s10551-008-9894-x.
- Yoon, A. S., and G. Serafeim. 2022. “Understanding the Business Relevance of ESG Issues.” Journal of Financial Reporting, forthcoming. doi:10.2308/JFR-2022-010.