?Mathematical formulae have been encoded as MathML and are displayed in this HTML version using MathJax in order to improve their display. Uncheck the box to turn MathJax off. This feature requires Javascript. Click on a formula to zoom.
ABSTRACT
The primary objective of this paper is to examine the impact of innovation and economic globalization on economic growth and the transition from the middle-income trap. The study analyses the impact of innovation and economic globalization on economic growth using the Bayesian model averaging (BMA) and the generalized method of moments (GMM). For the first time, this paper employs Cox regressions to estimate the transition speed from the middle-income trap. With the help of the extended Cox regression analysis, the study shows that mean years of education, life-insurance and non-life insurance premiums significantly increased the transition speed to high-income and thus reduced the transition duration. The important innovation variables like labour productivity, internet usage and scientific journal articles count also increased the transition speed and reduced the transition duration. The time-dependent covariates of trade openness, foreign direct investment, high-technology exports, health spending, urbanization, and life insurance premiums also increased the transition speed and thus reduced the transition duration. The research indicates that breaking free from the middle-income trap may not require a surge in patent numbers. The present paper provides some directions to achieve better economic growth and escape the middle-income trap.
I. Introduction
We can observe the introduction of the name middle-income trap in the book ‘An East Asian Renaissance: Ideas for Economic Growth’ by Gill and Kharas (Citation2007). It states, ‘Middle-income countries have grown less rapidly than either rich or poor’. Using three approaches, the literature identifies the existence of a trap of middle-income, namely, 1) the income level in absolute form, 2) the constancy of income level in relative form and 3) the stagnating or decelerating growth rate. Practically, the use of growth rate, relative income and absolute income criteria helps one identify the continuance of a trap of middle-income.
Various factors, including diminishing returns on physical capital, insufficient quality of human capital, incentive distortion and talent misallocation, poor advanced infrastructure, weak contract implementation and intellectual property protection, depletion of low-priced labour, replication of imitation technology gains, and inadequate availability of finance and venture capital cause the middle-income trap. These challenges hinder the transition of middle-income countries to higher income levels (Agénor Citation2017).
The prominent economic growth theories are Solow’s (Citation1956) neoclassical model and endogenous growth theory (Barro Citation1996; Lucas and Robert Citation1988; Romer Citation1990). The neoclassical growth theory argues that the short-term decisive factor of economic growth is an investment in physical assets and technology growth in the long term. Education investment became as vital and crucial as a physical investment with the endogenous growth theory’s emergence in the mid-1980s (Barro Citation1996; Lucas and Robert Citation1988; Romer Citation1990). The endogenous growth model’s critical economic growth variable is an investment in human stock complemented by physical investment (Islam Citation1995; Mankiw, Romer, and Weil Citation1992). Knowledge can be accumulated through conventional and unconventional education, training, through innovations in processes and products (Aghion and Howitt Citation1992). In driving economic growth, productivity elements such as gainful technological knowledge and knowledge from experience have a significant role (Aghion and Howitt Citation1992; Lucas and Robert Citation1988; Romer Citation1986; Stokey Citation1995). Technological or productivity growth, physical investment, and human capital stock are key economic growth variables.
Between 1990 and 2019, 27 middle-income countries transitioned to high-income status according to the World Bank’s GNI Atlas Method. The transitions occurred between 1990 and 2019 (Appendix ). Notably, Argentina shifted from the middle to the high-income group in 2014. However, it is important to note that this was a borderline case, as the country moved back to the middle-income category in 2015 and 2016 before returning to the high-income level in 2017. Nevertheless, it was once again downgraded to middle-income status in 2019.
Factors influencing the duration of a country’s exit from the middle-income trap and the role of innovation and economic globalization in economic growth and transition speed to high income for 27 countries are explored. This study assesses the quantitative significance of these factors in economic growth and the transition speed to high-income status.
This study defines the concept of innovation using five variables: labour productivity, the share of the industrial workforce, the percentage share of the population using the internet, the number of patents, and the number of scientific and technical articles. We use the multidimensional variable of economic globalization (Haelg Citation2019). Alternatively, we also use the important individual variables of economic globalization as defined using four variables: trade openness, foreign direct investment, hi-technology exports, and taxes on international trade.
This article presents a study that examines the impact of innovation and economic globalization on economic growth and transition speed for 27 countries that have recently achieved high-income status. It highlights the crucial role of innovation and economic globalization in promoting economic growth and development. The study emphasizes the significance of these factors in avoiding the challenges of the middle-income trap and recommends implementing reforms to sustain economic growth. Using Cox and extended Cox regression for analysing the likelihood of transition duration represents a recent development in the economic growth literature.
This research contributes significantly to the existing literature by examining the influence of innovation and economic globalization on economic growth and the likelihood of transitioning from middle-income to high-income in 27 countries that made this transition between 1990 and 2019. Bayesian model averaging (BMA) is utilized in this study to address the issue of model uncertainty, while the generalized method of moments (GMM) is applied to tackle the problem of endogeneity in the analysis. Moreover, the impact of innovation and economic globalization on the transition speed is evaluated using Cox and extended Cox regression analysis. Random forest analysis and boosting models are also employed to ensure the robustness of the Cox and extended Cox regression analysis findings.
The rest of this paper is organized into five sections. We shortly survey the literature in the following part. The dataset used for the analysis, the empirical model and the econometric methods used in the study are presented in the third section. The main results of the study are presented in the fourth section. Finally, the last section concludes the paper.
II. Literature review
Mankiw et al. (Citation1992) found that investment in human and tangible assets explains economic growth, excluding centrally planned economies. Barro (Citation1996) identified critical growth variables like investment price, primary enrolment, initial GDP, schooling, life expectancy, and more. Radelet et al. (Citation2001) reported mixed effects of secondary schooling but confirmed other positive growth factors in 14 Asian nations. Finally, Sala-i-Martin et al. (Citation2004) identified 18 significant growth variables in 88 countries.
These studies show a positive relationship between education and economic growth in European Union regions (Cuaresma, Doppelhofer, and Feldkircher Citation2014) and the importance of physical and human capital accumulation, sectorial exports, and institutions in South American countries (Vedia-Jerez and Chasco Citation2016). Sen et al. (Citation2018) found mixed results, with significant positive impacts of health and education expenditures on growth for some countries but an unfavourable impact for Indonesia. Salam et al. (Citation2019) observed a positive effect of human capital development on economic growth in lower-middle-income countries. Phung et al. (Citation2019) identified positive influences on economic growth, including innovation, openness, foreign direct investment, and government education spending in 69 countries from 2006 to 2014. Pegkas et al. (Citation2020) highlighted the beneficial effects of trade openness and human capital and the nullifying impact of public debt on economic growth in 12 Eurozone countries from 1995 to 2016.
The progression of middle-income countries to high-income faces blocks like the marginal returns diminishing to physical capital (Kejak Citation2003). 86% of growth slowdowns resulted from productivity slowdowns, compared to only 15% from capital accumulation (Eichengreen, Park, and Shin Citation2014). Productivity slowdowns cause the middle-income trap in countries in Latin America (Daude Citation2010). Despite Morocco’s high public investment rate and high production capacity and output, it experienced diminishing returns over time (Agénor and Aynaoui Citation2015). The main reason for this is the incremental capital-output ratio which increased to a mean of 8.1 in the previous decade from 3 in the 1990s. On the contrary, the incremental capital-output ratio for China only increased from 3.8 to 4.6 during 1983–2010 (Lee and Hong Citation2012).
A Lewis-type development process relies on cheap labour and imitation of foreign technology in the early stages, leading to initial growth. However, expensive innovation becomes necessary as countries progress to a middle-income level, slowing growth. Imitation technology with low-skilled labour contributes to early productivity but lacks long-term sustainability (Agénor and Alpaslan Citation2014; Agénor and Dinh Citation2013; Glass Citation1999; Perez-Sebastian Citation2007). Instead of relying on imitation technology, innovation is essential for sustaining high productivity and economic growth. Countries can achieve long-term productivity and foster economic growth by generating new ideas, processes, and technologies.
Insufficient human capital quality hampers progress from middle-income to high-income status. Jayadevan, Hoang, and Yarram's study (Citation2022) emphasizes education's crucial role in high-income countries for economic growth, contrasting its underutilization in middle-income nations. It limits innovation adoption and productivity gains from imports (Stone and Shepherd Citation2011). Inadequate advanced infrastructure and financial development also contribute to the middle-income trap (Agénor and Canuto Citation2014, Citation2015).
Jian et al. (Citation2021) linked entrepreneurship to China’s GDP growth. Pradhan et al. (Citation2020) associated Eurozone economic growth with entrepreneurship, innovation, and institutional quality. Pala (Citation2019) studied innovation’s impact on economic growth in developing countries. Liu and Xia (Citation2018) linked R&D, innovation, and China’s growth. Zhong (Citation2017) confirmed innovation’s boost to US growth. Borges et al. (Citation2017) connected high-tech exports, institutional development, and economic growth. Danquah and Amankwah-Amoah (Citation2017) identified human capital’s role in tech adoption in sub-Saharan Africa. Feki and Mnif (Citation2016) established innovation as a key driver of economic growth in developing countries. Vincent (Citation2016) identified factors influencing internet usage. Hu (Citation2015) emphasized indigenous firms’ role in South Korea’s innovation and multinational corporations’ influence on China’s technology adoption. Guloglu and Tekin (Citation2012) demonstrated the reciprocal relationship between R&D, innovation, and economic growth. Giménez and Sanaú (Citation2011) analysed the impact of institutional infrastructure, technological innovation, and growth in multiple countries. Tebaldi and Elmslie (Citation2008) highlighted institutions’ impact on growth rates and income levels. LeBel (Citation2008) found a positive association between creative innovation and economic growth. Wong et al. (Citation2005) identified firm formation and technological innovation as drivers of economic growth.
Various studies (Dollar Citation1992; Sachs and Warner Citation1997; Edwards Citation1998; Rodrik Citation2000; Rodriguez and Rodrik Citation2000; Stiglitz Citation2004; Alesina and Perotti Citation1994; Rodrik Citation1998; Borensztein, De Gregorio, and Lee Citation1998; Calderón and Poggioa Citation2010) explore globalization’s impact on economic growth, discussing evidence strength, potential growth improvement, human capital, and the role of infrastructure, education, regulation, and institutions. Studies by Dreher (Citation2006), Rao and Vadlamannati (Citation2011), Gurgul and Lach (Citation2014), and Samimi and Jenatabadi (Citation2014) all support the positive impact of globalization on growth. Dreher’s study covers 123 countries from 1970–2000, Rao and Vadlamannati focus on 21 African countries from 1970–2005, Gurgul and Lach examine 10 CEE economies, and Samimi and Jenatabadi highlight the importance of financial development and human capital in selected countries.
Majidi (Citation2017) found negative effects of political globalization on growth in upper-middle-income countries (1970–2014). Ahmad (Citation2019) highlighted the positive impact of economic globalization with favourable political settings (1985–2014). Radulović and Kostić (Citation2020) showed positive short-term effects of economic and social globalization on growth in European Monetary Union countries (1970–2016), while political globalization had negative short-term effects. Czernich et al. (Citation2011) found a positive impact of broadband usage on economic growth in a panel of OECD countries. Kabaklarli and Atasoy (Citation2019) observed a positive relationship between broadband infrastructure and GDP per capita across 57 countries from 2001 to 2016.
This study attempts to identify the recently transitioned countries and assess the influence of innovation and economic globalization on economic growth using BMA and GMM. The transition duration from middle- to high-income countries during 1990–2019 is investigated using Cox and extended Cox regression analyses. Additionally, analysis with random forest and boosting were conducted to validate the results for robustness.
III. Research methodology
In this section, we briefly examine the methodology used in this study. This study uses panel data for 27 transitioned countries from 1990 to 2019. This study uses data from the World Development Indicators (World Bank Citation2020b), UNESCO (Citation2020) and Valev (Citation2020). The countries are classified into low, lower-, upper-middle and high-income based on the current US$ per capita gross national income (GNI) based on the Atlas method (World Bank Citation2020a, Citation2021).
This study investigates the relationship between economic growth and its determinants in 27 recently transitioned countries to high-income. Two different methods, BMA and GMM, are employed using GDP per capita as the outcome variable. To estimate the transition duration of these countries to high-income status, Cox and extended Cox regression methods are utilized. In these regression models, the dependent variable is the duration or the number of years taken to reach high-income status, while a dichotomous status variable is used (1 = non-transitioned, 0 = transitioned). Machine learning techniques such as random forests and boosting models are also used for validation checks. In these analyses, the dependent variable is the transition status, indicated by 1 for non-transitioned countries and 0 for transitioned countries.
Economic globalization is a multidimensional variable. Alternatively, we have included individual variables like trade openness, foreign direct investment, high-tech exports and taxes on international trade representing economic globalization. Innovation in this study is represented by multiple variables- labour productivity, research and development expenditure (R&D), the percentage of people using the internet, the number of patent applications by residents (PAT), the share of the workforce in the industry and the number of technical and scientific journal articles. Due to multicollinearity, R&D and the number of patent applications cannot be simultaneously included.
Bayesian Model Averaging (BMA)
Consider g as the GDP per capita with data D and p predictors. Many models, such as M1 … … … Mk can be chosen from the 2p models. To mitigate model uncertainty, BMA uses probability calculus (Magnus, Powell, and Prüfer Citation2010). Mk’s posterior model distribution can be written as
Generalised Method of Moments (GMM)
Regression analysis assumes no correlation between the predictors and the disturbance term. The presence of bias and inconsistency exists in the estimates of OLS when there is a violation of this assumption. When there is a correlation between predictors and the term of disturbance, it causes an endogeneity issue. Using the instrumental variables, we can fix the issue of endogeneity. The GMM is usually used to solve the endogeneity issue in the regression analysis. The Short-run dynamics can be analysed in panel data with GMM (Arellano and Bond Citation1991; Arellano and Bover Citation1995; Blundell and Bond Citation1998). We outline below the panel data equation:
in Appendix lists the variables used in this paper. The unobserved country-specific effect can be observed in . Two-step estimators are optimal.
Cox Regression
The transition duration to high-income is estimated using Cox proportional hazard regression to analyse time-dependent covariates in time-to-event data. This statistical technique is known by many names, like duration analysis, event history analysis, transition chance analysis, survival analysis, or hazard rate analysis. We observe the application of Cox regression in the studies of Carroll (Citation2006) and Metzger and Jones (Citation2022). The event in this analysis is the progression from middle-income to high-income for 27 countries. It predicts the occurrence of an event at a particular time and the model time to a specified event (Cox Citation1972). The central assumption of Cox regression is that the predictor variables or covariates are time constant. The model is expressed in terms of a hazard function or ratio. The critical components of Cox regression are Status, Time or duration in years and Covariates. The Status variable is a dichotomously coded dependent variable. We categorize the status variable as 1=non-transitioned and 0=transitioned. The Time variable measures the duration in years of the transition to high-income. Covariates serve as categorical or quantitative predictors. The hazard rate for the ith country can be expressed as . PH hazard function has two components − 1)baseline hazard function,
, a function of a duration time, and 2) a part that is a function of covariates. As seen in the following, the hazard ratio for any two countries, i and j, depends only on covariates, not the time t.
Once the underlying assumption of proportional hazards (PH) has been validated, it is possible to build a multivariate regression model. This model-building process is essentially the same as multiple linear or logistic regression and can include continuous and categorical variables, with the latter represented by dummy variables (0,1). We can use three principle tests to assess and compare variables within the model. These are the Wald, the likelihood ratio, and the score. Although they are all equivalent if the number of events is significant, the likelihood ratio test is probably slightly better for consistency and stability reasons (Meyer Citation2019). The likelihood ratio method tests if each particular variable explains a significant amount of variation associated with the model after allowing for the other variables.
Machine learning methods
Random forests and boosting are machine-learning algorithms used in this study. Random forests combine multiple models into a single ensemble, leading to improved decision-making compared to individual trees (Williams Citation2011). They are known for their accuracy, utilizing algorithms like MeanDecreaseAccuracy and MeanDecreaseGini to determine variable importance and reduce decision instability. Additionally, random forests enable ranking regression variables, providing insights into their relative significance.
Boosting resample data and calculating a weighted average improves classification accuracy (Williams Citation2011). Machine learning can be implemented using Python or R software. The dependent variable in machine learning represents income level (1 for middle-income/non-transitioned, 0 for high-income/transitioned).
IV. Results
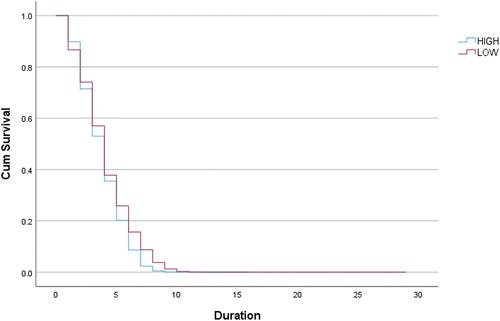
From 1990 to 2019, the average per capita GDP for the 27 countries was USD$29,452.60. The maximum GDP per capita reached USD$97,988.97, with a standard deviation of USD$14,960.96 (Appendix ). presents the graphical representation of the GDP per capita. shows a noticeable variation in economic globalization among the 27 high-income countries.
Figure 1. PPP GDP per capita at 2017 constant prices.
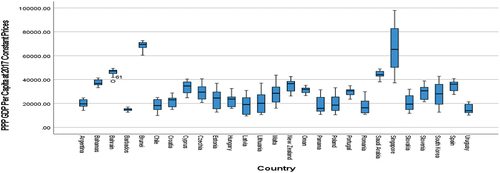
Figure 2. Economic globalisation, 1990–2019.
BMA analysis
The BMA model space comprised 16,384 models. displays the BMA findings for multidimensional economic globalization. The coefficients linked to labour force participation rate, average education years, and life insurance premium volumes exhibit positive and significant associations. Regarding innovation variables, labour productivity, industrial workforce, and internet usage percentage demonstrate significant positive effects. As expected, the coefficient for the multidimensional economic globalization variable is also significantly positive. These predictors account for a substantial portion of the model’s variability.
Table 1. Estimates of BMA for GDP per capita using multidimensional economic globalization.
BMA estimates using individual variables of economic globalization are presented in . Here the BMA model space consisted of 131,072 models. The coefficients associated with the labour force participation rate, mean years of education and life insurance premium volumes are positive and significant. The most important innovation coefficients are associated with labour productivity, industrial workforce and the percentage of people using the Internet. Similarly, the significant economic globalization variables are the openness of the countries, foreign direct investment and high-technology exports, and these have the expected positive signs.
Table 2. Estimates of BMA for GDP per capita using individual variables of economic globalization.
GMM analysis
The results from the GMM system are presented in . A second correlation is not observed in serial correlation tests given by Arellano-Bond. The instruments are valid and robust, as Hansen’s test results show. GMM estimates for 27 countries show that initial GDP per capita, physical capital, the labour force participation rate and government health spending are positive and significant at 5%. The coefficient of average years of education is also positive; however, significant at 10%. The most significant coefficients of innovation are associated with labour productivity, the share of the industrial workforce and the percentage share of people using the internet. Among the economic globalization variables, the coefficient of foreign direct investment has an expected sign and is significant.
Table 3. GMM Estimates for per capita GDP capita using individual variables of economic globalization.
GDP per capita increases by 0.059% for every additional unit increase in physical capital. One unit increase in the labour force participation rate increases the GDP per capita by 0.776%. GDP per capita increases by 0.945% for every unit increase in government health expenditure. Every unit increase in labour productivity leads to a 0.775% increase in GDP per capita. For every unit increase in the industrial workforce, the GDP per capita increases by 0.220%. A unit increase in foreign direct investment increases the GDP per capita by 0.017%. A unit increase in internet usage increases the GDP per capita by 0.014%.
Explaining the transition duration to high-income
The transition speed of 27 countries to high-income during 1990–2019 is examined with Cox regression. The −2 Log Likelihood statistic takes on a value of 3186.04 after excluding covariates in the model. After entering all the covariates into the model, the −2 log-likelihood value has decreased to 2916.53. The Chi-square value is 269.51, which is statistically significant at 5%, indicating that the covariates significantly affect the duration of countries transitioning to high-income.
The hazard ratio originated in Biostatistics. Here, we call it the transition speed to high income. The statistical significance of each covariate is evaluated with the Wald Statistic. An inspection of the P-value of Cox estimates indicates that covariates like mean years of education and non-life insurance premiums significantly contributed to countries’ transition speed. The life insurance premiums coefficient has a positive sign but is significant at 10%. The most important innovation variables are labour productivity, industrial workforce, internet usage and the number of scientific journal articles. Among the economic globalization variables, the coefficient of openness is positive and significant.
Cox regression shows that the mean years of education helped increase the transition speed to high income by 464.00% (5.64–1 × 100). The industrial workforce variable helped to increase the transition speed to high-income from middle-income by 3.00%, ceteris paribus. Internet usage increased the transition speed by 6.00%. Premium non-life and life insurance volumes increased the transition speed by 79.00% and 16.00%, respectively ().
Table 4. Estimates of Cox regression for duration of transition for Recently transitioned countries.
The Cox estimates reported in indicate that the transition speed of countries to high-income increased by 464.00% for every unit increase in mean years of education, 3.00% for every unit increase in the industrial workforce, 6.00% for every unit increase in internet usage, and 16.00% for every unit increase in premium volumes of life insurance and 79.00% for every unit increase in non-life insurance premium volumes ().
The proportional hazards (PH) assumption is not upheld in the Cox regression analysis, as evidenced by varying hazard ratios for certain covariate values. An extended Cox regression with the appropriate PH regression model can address this issue by incorporating time-dependent covariates. The time variable, denoted as T_, can be utilized to examine this model and define time-dependent covariates (Meyer Citation2019).
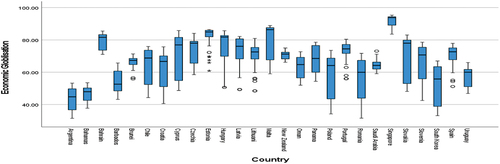
A log minus log plot (LML plot) shows that the Proportional hazards assumption has been violated (). Since the Proportional hazards assumption has been violated, we need to use an extended Cox model for the analysis. Comparing of the Appendix, computed after excluding Argentina, with below, we find evidence that the Proportional Hazards assumption has been violated. Therefore, we need to use an extended Cox model for the analysis.
Figure 3. LML function at mean of covariates.
The results of extended Cox regression are presented in . The −2 Log Likelihood statistic in the null model takes on a value of 3186.04. After entering all the covariates into the model, the −2 log-likelihood value decreased to 2817.09. The Chi-square value is 368.95, which is statistically significant at 5%, indicating that covariates significantly affect countries’ transition duration to high-income status.
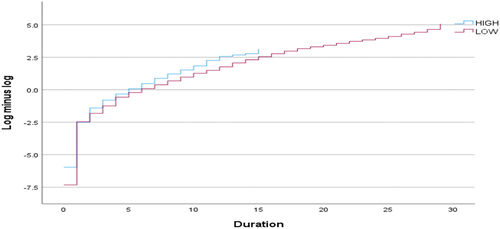
The following graph shows the survival curves against economic globalization (). The economic globalization index cut-off percentage in Cox regression is 66.20, the average of economic globalization for all 27 countries from 1990–2019. The Economic Globalization Index distinguishes between a high percentage of economic globalization (index >66.20) and a low percentage of economic globalization (index ≤66.20). The blue line indicates a high percentage of economic globalization, and the red line indicates a low percentage. The risk of a low level of economic globalization for some countries for the transition to high income was higher on average than in countries with a higher level of economic globalization, as illustrated in , at least in the first 12 years. When comparing of the Appendix, which excludes Argentina, with below, we observe that the risk ratio between high and low economic globalization decreases, at least during the first 10 years without including Argentina.
Figure 4. Survival function at mean of convariates.
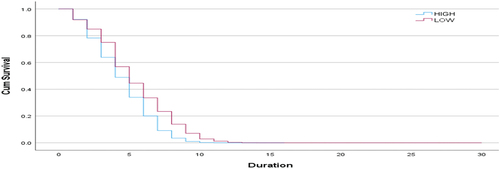
Figure 5. Variable importance from boosting model.
The coefficients of time-dependent covariates are reported in . We can see that the time interaction coefficients are significant. The time coefficients of mean years of education and non-life insurance and life insurance premium volumes are significant, suggesting that treating these covariates as time-dependent in the model is necessary. Among the innovation variables, labour productivity, the share of people using the internet, and the number of scientific journal articles are also time-dependent.
The extended Cox PH-corrected regression coefficient for mean years of education is 2826.00%, implying that the transition speed to high-income increases by 2826%. The regression coefficient for non-life insurance premium volumes is 3.08, indicating that the transition speed to high-income increases by 208.00%, ceteris paribus. The coefficient of internet usage is 1.04, implying that the transition to high-income increased by 4.00% and shortened the average transition duration by approximately 4% ().
It is also notable that urbanization’s time interaction is positively signed and significant. The interaction effect of government spending on health, urbanization, life insurance premiums, internet usage, openness, foreign direct investment and high-technology exports are positive and significant. The interaction effect of government health spending indicates that as time passes, public health spending significantly increases the transition speed to high income by 4.00%. Trade openness’s time interaction is positively signed and significant. The interaction effect of openness and foreign direct investment indicates that the transition speed to high-income increases by 1% over time. The interaction effect of life insurance premiums volumes indicates that the transition speed increase by 3.00% as time passes. The interaction effect of physical capital indicates that the transition speed decreases by 1.00% as time passes.
Explaining the progression to high-income from middle-income
For variable selection purposes, random forests are beneficial. What are the most critical variables for predicting the progression to high-income from middle-income? We can use MeanDecreaseGini and MeanDecreaseAccuracy to see the importance of variables. A higher value indicates more critical predictor variables. According to the MeanDecreaseGini, labour productivity, internet usage, life insurance premiums, spending on health, the efficiency of institutions, mean years of education and labour force participation rate are the most important variables explaining the progression to high-income from middle-income. MeanDecreaseAccuracy shows labour productivity, internet usage, spending on health, life insurance premiums, mean years of education, labour force participation rate and efficiency of institutions are the most important variables. The first five variables for middle-income are the same as the MeanDecreaseAccuracy criteria results. However, the sixth variable is high-technology exports, not labour force participation (Appendix ). The area under the ROC curve is above 90%, and the out-of-bag error rate is 3.70%, so the random forest model is valid.
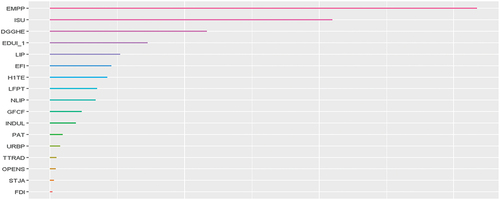
Boosting or stochastic gradient boosting is another method of selecting the best variables. It uses the AdaBoost algorithm, provides the best results from the resampled data several times, and provides a result set, the weighted average of the re-sampled data. According to the boosting model (), labour productivity (), the percentage of people using the internet (), government health spending (), mean years of education () and premium volumes of life insurance () are important variables of the progression to high-income from middle-income. Though the share of the industrial workforce () is the eleventh important variable in boosting, it is a significant variable in BMA and GMM.
Figure 6. Labour productivity.
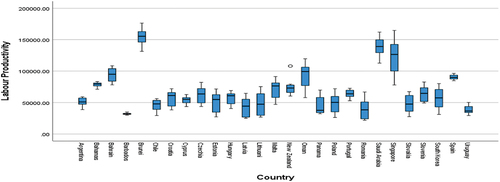
Figure 7. Internet usage (% of population).
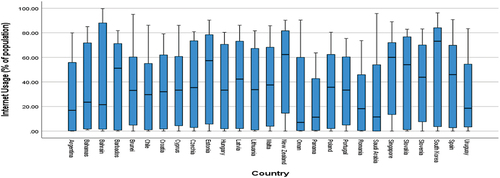
Figure 8. Health spending (% of GDP).
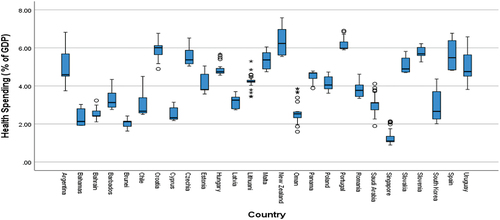
Figure 9. Means years of education.
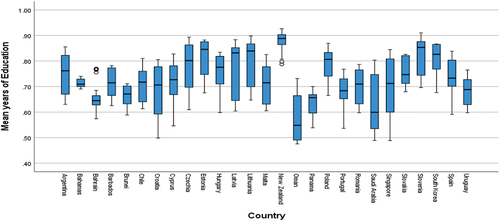
Figure 10. Life insurances (% of GDP).
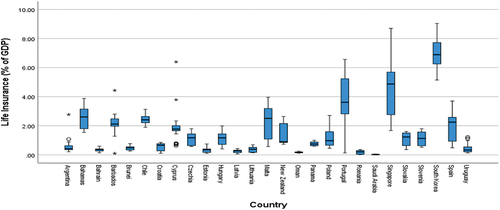
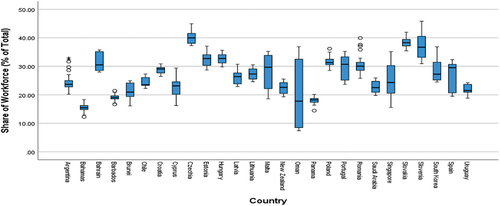
Figure 11. Share of industrial workforce (% of Total).
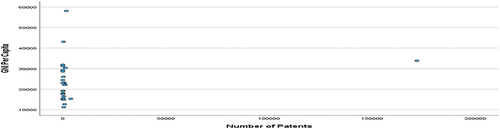
Our analysis reveals that the patents variable was not significant in any of the models examined. Further investigation indicates no correlation between GNI per capita and the number of patents, except for South Korea, which exhibited a high number of patents in 2019, as seen in .
Figure 12. Scatter plot for GNI per capita and patents for 2019.
V. Policy implications and conclusion
This study explores the influence of innovation and economic globalization on economic growth and the speed of transitioning from middle-income to high-income status across 27 countries from 1990 to 2019. Of the 158 countries examined, 27 achieved high-income status during the period. The study employs BMA and GMM to analyse the impact of innovation and economic globalization on economic growth. Cox and extended Cox regressions are also used to assess the transition speed from middle-income to high-income. To validate the findings, machine learning techniques are employed.
BMA and GMM indicate that the labour force participation rate and the average years of education significantly explained economic growth. BMA also shows that life-insurance premiums also contributed to economic growth. Innovation variables such as labour productivity, industrial workforce, and internet usage also positively impact economic growth. BMA highlights the importance of trade openness, foreign direct investment, and high-technology exports in economic globalization, while GMM emphasizes the significance of foreign direct investment. Additionally, BMA confirms the significance of the multidimensional economic globalization index and various factors, including labour productivity, industrial workforce, internet usage, education, the labour force participation rate and life insurance premiums. GMM underscores the importance of gross fixed capital, initial income, and government health spending for economic growth.
The Cox and extended Cox models demonstrate that education, life insurance, and non-life insurance premiums significantly impact transition speed and duration. Key innovation variables include labour productivity, industrial workforce, internet usage, and scientific journal articles count in the Cox regression. In the extended Cox regression, labour productivity, internet usage, and scientific journal articles count remain significant. Trade openness also plays a crucial role in Cox regressions. Additionally, time-dependent covariates of urbanization, foreign direct investment, and high-technology exports are positively significant in the extended Cox regression, supporting the use of the extended Cox model.
Key factors driving the transition from middle-income to high-income in the boosting model include labour productivity, internet usage rates, government spending on health, average years of education, and life insurance premium volumes.
Mean years of education consistently played a prominent role in models such as BMA, GMM, Cox, and Boosting. Government health spending emerged as an important factor in GMM, Cox, and extended Cox models. The labour force participation rate showed significance in BMA and GMM. Innovation variables like labour productivity and internet usage rate made substantial contributions to BMA, GMM, Cox, extended Cox, and machine learning models. The industrial labour force also positively influenced BMA, GMM, and Cox models. Following World War II, Taiwan and South Korea achieved remarkable economic growth, rivalling Japan’s. This growth can be attributed to rapid industrialization, accelerated exports, and sustained high economic performance (Hsiao and Hsiao Citation2017).
Trade openness was significant in BMA and Cox models. Foreign direct investment was important in BMA and GMM. The extended Cox model indicates that the time-interaction effect of foreign direct investment, high-technology exports, trade openness and urbanization also contributed to the transition to high-income from middle-income.
In our study, the mean years of education and government spending on health and non-life insurance premiums significantly contributed to the transition to high-income from middle-income. Labour productivity and the share of people using the internet also contributed to the transition to high-income from middle-income. The time interaction effect of foreign direct investment, high-technology exports, trade openness and urbanization also contributed to the transition to high-income from middle-income. Education and innovation are significant in Taiwan’s and South Korea’s technological development (Wang Citation2007). We found no significant correlation between GNI per capita and patents, except for South Korea.
Life insurance was important in BMA, Random Forest and Boosting models. Non-life insurance contributed significantly to the transition duration reduction in Cox and extended Cox regressions. Evidence suggests a positive relationship between growth in the life insurance industry and productivity/economic growth. Soo’s study (Soo Citation1996) supported the hypothesis that life insurance growth Granger causes economic growth. Both high-income and developing countries drive the positive effect of non-life insurance on economic growth, suggesting that insurance may be a key factor in promoting economic growth across a wide range of countries (Arena Citation2008).
To overcome the middle-income trap, several innovation factors are crucial, including growth in labour productivity, an increase in the share of the industrial workforce, an increase in internet usage, and producing more scientific articles. Economic globalization factors include increasing trade openness, attracting foreign direct investment, and promoting high-technology exports. Additionally, increasing labour force participation, physical capital, mean years of education, and public health spending are important. However, the research indicates that breaking free from the middle-income trap may not require a surge in patent numbers.
It is widely acknowledged that certain factors, such as education, health, labour productivity, internet usage, industrial workforce, urbanization, trade openness, and high-technology exports, play crucial roles in helping emerging countries overcome the middle-income trap and achieve sustainable economic growth. Education and health are particularly significant as they contribute to human development and enhance the labour force’s productivity. Countries can experience higher wages and foster greater economic growth by improving labour productivity. Internet usage can boost productivity and connectivity by facilitating access to information, communication, and e-commerce activities for individuals and businesses. Developing the industrial workforce can enhance a country’s competitiveness in various sectors, including manufacturing, while urbanization can create economies of scale and improve access to essential services. Trade openness can stimulate economic growth by increasing competition and creating export opportunities. Additionally, a focus on high-tech exports can drive innovation and technological advancement.
Acknowledgments
We express our gratitude to the editor and anonymous reviewers for their insightful feedback and constructive criticisms.
Disclosure statement
No potential conflict of interest was reported by the author(s).
References
- Agénor, P.-R. 2017. “Caught in the Middle? The Economics of Middle-Income Traps.” Journal of Economic Surveys 31 (3): 771–791. https://doi.org/10.1111/joes.12175.
- Agénor, P.-R., and B. Alpaslan. 2014. “Infrastructure and Industrial Development with Endogenous Skill Acquisition.” Working Paper No. 195, Centre for Growth and Business Cycle Research. https://doi.org/10.1111/boer.12166.
- Agénor, P.-R., and K. E. Aynaoui. 2015. “Morocco: Growth Strategy for 2025 in an Evolving International Environment.” Books & Reports, Policy Center for the New South, Number 2. May.
- Agénor, P.-R., and O. Canuto. 2014. “Access to Finance, Product Innovation and Middle-Income Traps.” Policy Research Working Paper No. 6767, World Bank. https://doi.org/10.1016/j.rie.2017.03.004.
- Agénor, P.-R., and O. Canuto. 2015. “Middle-Income Growth Traps.” Research in Economics 69 (4): 641–660. https://doi.org/10.1016/j.rie.2015.04.003.
- Agénor, P.-R., and T. H. Dinh. 2013. “Public Policy and Industrial Transformation in the Process of Development.” Policy Research Working Paper No. 6405, World Bank. https://doi.org/10.1596/1813-9450-6405.
- Aghion, P., and P. Howitt. 1992. “A Model of Growth Through Creative Destruction. A Model of Growth Through Creative Destruction.” Econometrica 60 (2): 323–351. https://doi.org/10.2307/2951599.
- Ahmad, M. 2019. “Globalisation, Economic Growth, and Spillovers: A Spatial Analysis.” Margin—The Journal of Applied Economic Research 13 (3): 255–276. https://doi.org/10.1177/2347631119841257.
- Alesina, A., and R. Perotti. 1994. “The Political Economy of Growth: A Critical Survey of the Recent Literature.” The World Bank Economic Review 8 (3): 351–371. https://doi.org/10.1093/wber/8.3.351.
- Arellano, M., and S. Bond. 1991. “Some Tests of Specification for Panel Data: Monte Carlo Evidence and an Application to Employment Equations.” Review of Economic 58: 277–297.
- Arellano, M., and O. Bover. 1995. “Another Look at the Instrumental Variable Estimation of Error-Components Models.” Journal of Econometrics 68: 29–51.
- Arena, M. 2008. “Does Insurance Market Activity Promote Economic Growth? A Cross-Country Study for Industrialized and Developing Countries.” The Journal of Risk and Insurance 75 (4): 921–946. https://doi.org/10.1111/j.1539-6975.2008.00291.x.
- Barro, R. J. 1996. “Determinants of Economic Growth: A Cross-Country Empirical Study.” NBER Working Paper Series. https://doi.org/10.3386/w5698.
- Blundell, R., and S. Bond. 1998. “Initial Conditions and Moment Restrictions in Dynamic Panel Data Models.” Journal of Econometrics 87: 115–143.
- Borensztein, E., J. De Gregorio, and J.-W. Lee. 1998. “How Does Foreign Direct Investment Affect Economic Growth?” Journal of International Economics 45 (1): 115–135. Retrieved from. https://www.olemiss.edu/courses/inst310/BorenszteinDeGLee98.pdf.
- Borges, M. Q., E. J. A. Saucedo, and J. P. Díaz. 2017 Nov. DIEM : Dubrovnik International Economic Meeting; Dubrovnik Vol. 3, Iss. 1. Dubrovnik: University of Dubrovnik 207–218.
- Calderón, C., and V. Poggioa. 2010. “Trade and Economic Growth: Evidence on the Role of Complementarities for CAFTA-DR Countries.” In Getting the Most Out of Free Trade Agreements in Central America, edited by J. H. Lopez and R. Shankar, 83–122. Washington DC: The World Bank.
- Carroll, N. 2006. “Explaining Unemployment Duration in Australia.” Economic Record 82 (258): 298–314. https://doi.org/10.1111/j.1475-4932.2006.00341.x.
- Cox, D. R. 1972. “Regression Models and Life Tables.” Journal of the Royal Statistical Society, Series B: Methodological 34 (2): 187–220. https://doi.org/10.1111/j.2517-6161.1972.tb00899.
- Cuaresma, J. C., G. Doppelhofer, and M. Feldkircher. 2014. “The Determinants of Economic Growth in European Regions.” Regional Studies 48 (1): 44–67. https://doi.org/10.1080/00343404.2012.678824.
- Czernich, N., O. Falck, T. Kretschmer, and L. Woessmann. 2011. “Broadband Infrastructure and Economic Growth.” The Economic Journal 121 (552): 505–532. https://doi.org/10.1111/j.1468-0297.2011.02420.x.
- Danquah, M., and J. Amankwah-Amoah. 2017. “Assessing the Relationships Between Human Capital, Innovation and Technology Adoption: Evidence from Sub-Saharan Africa.” Technological Forecasting and Social Change 122:24–33. https://doi.org/10.1016/j.techfore.2017.04.021.
- Daude, C. 2010. “Innovation, Productivity and Economic Development in Latin America and the Caribbean.” Working Paper No. 288, OECD Development Centre. https://doi.org/10.1787/18151949.
- Dollar, D. 1992. ““Outward-Oriented Developing Economies Really Do Grow More Rapidly: Evidence from 95 LDCs”, 1976-1985.” Economic Development and Cultural Change 40 (3): 523–544. https://doi.org/10.1086/451959.
- Dreher, A. 2006. “Does Globalisation Affect Growth? Evidence from a New Index of Globalisation.” Applied Economics 38 (10): 1091–1110. https://doi.org/10.1080/00036840500392078.
- Edwards, S. 1998. “Openness, Productivity and Growth: What Do We Really?” International Journal of Offshore and Polar Engineering 108 (447): 383–398. https://doi.org/10.1111/1468-0297.00293.
- Eichengreen, B., D. Park, and K. Shin. 2014. “Growth Slowdowns Redux.” Japan and the World Economy 32:65–84. https://doi.org/10.1016/j.japwor.2014.07.003.
- Feki, C., and S. Mnif. 2016. “Entrepreneurship, Technological Innovation, and Economic Growth: Empirical Analysis of Panel Data.” Journal of the Knowledge Economy 7 (4): 984–999. https://doi.org/10.1007/s13132-016-0413-5.
- Gill, I., and H. Kharas. 2007. An East Asian Renaissance - Ideas for Economic Growth. Washington DC: World Bank.
- Giménez, G., and J. Sanaú. 2011. “Interrelationship Among Institutional Infrastructure, Technological Innovation and Growth. An Empirical Evidence.” Applied Economics 39 (10): 1267–1282. https://doi.org/10.1080/00036840500438988.
- Glass, A. J. 1999. “Imitation as a Stepping Stone to Innovation,” Working Papers 99-11, Ohio State University, Department of Economics. RePEc:osu:osuewp:99–11.
- Guloglu, B., and R. B. Tekin. 2012. “A Panel Causality Analysis of the Relationship Among Research and Development, Innovation, and Economic Growth in High-Income OECD Countries.” Eurasian Economic Review 2 (1): 32–47.
- Gurgul, H., and L. Lach. 2014. “Globalisation and Economic Growth: Evidence from Two Decades of Transition in CEE.” Economic Modelling 36:99–107. https://doi.org/10.1016/j.econmod.2013.09.022.
- Haelg, F. 2019. “The KOF Globalisation Index – a Multidimensional Approach to Globalisation.” https://www.degruyter.com/document/doi/10.1515/jbnst-2019-0045/html?lang=enBerlin/Boston.
- Hsiao, F. S. T., and M.-C. W. Hsiao. 2017. “Capital Flows and Exchange Rates During the Asian Financial Crisis: Recent Korean and Taiwanese Experiences and Challenges.” Economic Development of Emerging East Asia: Catching Up of Taiwan and South Korea: 23–58. Anthem Press. https://doi.org/10.2307/j.ctt1v2xshj.6.
- Hu, A. G. 2015. “Innovation and Economic Growth in East Asia: An Overview.” Asian Economic Policy Review 10 (1): 19–37. https://doi.org/10.1111/aepr.12078.
- Islam, N. 1995. “Growth Empirics: A Panel Data Approach.” Quarterly Journal of Economics 110 (4): 1127–1167. https://doi.org/10.2307/2946651.
- Jayadevan, C. M., Nam T. Hoang, and Subba R. Yarram. 2022. “Human Capital and the Middle-Income Trap Revisited.” Applied Economics. https://doi.org/10.1080/00036846.2022.2121379.
- Jian, J., X. Fan, S. Zhao, and D. Zhou. 2021. “Business Creation, Innovation, and Economic Growth: Evidence from China’s Economic Transition, 1978–2017.” Economic Modelling 96:371–378. https://doi.org/10.1016/j.econmod.2020.03.019.
- Kabaklarli, E., and B. S. Atasoy. 2019. “Broadband Infrastructure and Economic Growth: A Panel Data Approach for Selected Countries.” DIEM: Dubrovnik International Economic Meeting 4 (1): 105–114.
- Kejak, M. 2003. “Stages of Growth in Economic Development.” Journal of Economic Dynamics and Control 27: 771–800.
- LeBel, P. 2008. “The Role of Creative Innovation in Economic Growth: Some International Comparisons.” Journal of Asian Economics 19 (4): 334–347. https://doi.org/10.1016/j.asieco.2008.04.005.
- Lee, J.-W., and K. Hong. 2012. “Economic Growth in Asia: Determinants and Prospects.” Japan and the World Economy 24 (2): 101–113. https://doi.org/10.1016/j.japwor.2012.01.005.
- Liu, C., and G. Xia. 2018. “Research on the Dynamic Interrelationship Among R&D Investment, Technological Innovation, and Economic Growth in China.” Sustainability 10 (11). https://doi.org/10.3390/su10114260.
- Lucas, J., and E. Robert. 1988. “On the Mechanics of Economic Development.” Journal of Monetary Economics 22 (1): 3–42. https://doi.org/10.1016/0304-3932(88)90168-7.
- Magnus, J. R., O. Powell, and P. Prüfer. 2010. “A Comparison of Two Model Averaging Techniques with an Application to Growth Empirics.” Journal of Econometrics 154 (2): 139–153. https://doi.org/10.1016/j.jeconom.2009.07.004.
- Majidi, A. F. 2017. “Globalisation and Economic Growth: The Case Study of Developing Countries.” Asian Economic and Financial Review 7 (6): 589–599. https://doi.org/10.18488/journal.aefr.2017.76.589.599.
- Mankiw, N. G., D. Romer, and D. N. Weil. 1992. “A Contribution to the Empirics of Economic Growth.” The Quarterly Journal of Economics 107 (2): 407–437. https://doi.org/10.2307/2118477.
- Metzger, S. K., and B. T. Jones. 2022. “Getting Time Right: Using Cox Models and Probabilities to Interpret Binary Panel Data.” Political Analysis 30 (2): 151–166. https://doi.org/10.1017/pan.2021.14.
- Meyer, D. 2019. “STA80011-Advanced Statistical Modeling. Module 1.” In Faculty of Health Arts and Design, 230–232. Swinburne University of Technology.
- Pala, A. 2019. “Innovation and Economic Growth in Developing Countries: Empirical Implication of Swamy’s Random Coefficient Model.” Science Direct 158: 1122–1130.
- Pegkas, P., C. Staikouras, and C. Tsamadias. 2020. “»on the Determinants of Economic Growth: Empirical Evidence from the Eurozone Countries.” International Area Studies Review 23 (2): 210–229. https://doi.org/10.1177/2233865920912588.
- Perez-Sebastian, F. 2007. “Public Support to Innovation and Imitation in a Non-Scale Growth Model.” Journal of Economic Dynamics and Control 31 (12): 3791–3821. https://doi.org/10.1016/j.jedc.2006.12.011.
- Phung, T. D., V. T. T. Van, T. T. H. Thuong, and N. T. T. Ha. 2019. “Innovation and Economic Growth: The Contribution of Institutional Quality and Foreign Direct Investment.” Asian Economic and Financial Review 9 (11): 1266–1278. https://doi.org/10.18488/journal.aefr.2019.911.1266.1278.
- Pradhan, R. P., M. B. Arvin, M. Nair, and S. E. Bennett. 2020. “The Dynamics Among Entrepreneurship, Innovation, and Economic Growth in the Eurozone countries.” Journal of Policy Modeling 42 (5): 1106–1122. https://doi.org/10.1016/j.jpolmod.2020.01.004.
- Radelet, S., J. Sachs, and J.-W. Lee. 2001. “The Determinants and Prospects of Economic Growth in Asia.” International Economic Journal 15 (3): 1–29. https://doi.org/10.1080/10168730100080017.
- Radulović, M., and M. Kostić. 2020. “Globalisation and Economic Growth of Eurozone Economies.” Zb Rad Ekon fak Rij 38 (1). https://doi.org/10.18045/zbefri.2020.1.183.
- Rao, B. B., and K. C. Vadlamannati. 2011. “« Globalisation and Growth in the Low-Income African Countries with the Extreme Bounds Analysis.” Economic Modelling 28 (3): 795–805. https://doi.org/10.1016/j.econmod.2010.10.009.
- Rodriguez, F., and D. Rodrik. 2000. “Trade Policy and Economic Growth: A Skeptic’s Guide to the Cross-National Evidence.” NBER Macroeconomics Annual 15:261–325. https://doi.org/10.2307/3585400.
- Rodrik, D. 1998. “Symposium on Globalization in Perspective: An Introduction.” Journal of Economic Perspective 12 (4): 3–8.
- Rodrik, D. 2000. “Institutions for High-Quality Growth: What They are and How to Acquire Them.“Studies in Comparative International Development.” Studies in Comparative International Development 35 (3): 3–31. https://doi.org/10.1007/BF02699764.
- Romer, P. M. 1986. “Increasing Returns and Long-Run Growth.” Journal of Political Economy 94 (5): 1002–1037. https://doi.org/10.1086/261420.
- Romer, P. M. 1990. “Endogenous Technological Change.” Journal of Political Economy 98 (5, Part 2): S71–S102. https://doi.org/10.3386/w3210.
- Sachs, J. D., and A. M. Warner. 1997. “Fundamental Sources of Long-Run Growth.” The American Economic Review 87 (2): 184–188. http://www.jstor.org/stable/2950910.
- Sala-I-Martin, X., G. Doppelhofer, and R. I. Miller. 2004. “Determinants of Long-Term Growth: A Bayesian Averaging of Classical Estimates (BACE) Approach.” The American Economic Review 94 (4): 813–835. https://doi.org/10.1257/0002828042002570.
- Salam, S., M. Hafeez, M. T. Mahmood, K. Iqbal, and K. Akbar. 2019. “The Dynamic Relation Between Technology Adoption, Technology Innovation, Human Capital and Economy: Comparison of Lower-Middle-Income Countries.” Interdisciplinary Description of Complex Systems 17 (1): 146–161. https://doi.org/10.7906/indecs.17.1.15.
- Samimi, P., and H. S. Jenatabadi. 2014. “Globalisation and Economic Growth: Empirical Evidence on the Role of Complementarities.” PLoS ONE 9 (4): 1–7. https://doi.org/10.1371/journal.pone.0087824.
- Şen, H., A. KAYA, and B. ALPASLAN. 2018. “Education, Health, and Economic Growth Nexus: A Bootstrap Panel Granger Causality Analysis for Developing Countries.” Sosyoekonomi Journal, Sosyoekonomi Society 26 (36): 125–144. https://doi.org/10.17233/sosyoekonomi.2018.02.07.
- Solow, R. M. 1956. “A Contribution to the Theory of Economic Growth.” The Quarterly Journal of Economics 70 (1): 65–94. https://doi.org/10.2307/1884513.
- Soo, H. H. 1996. “Life Insurance and Economic Growth: Theoretical and Empirical Investigation.” ETD Collection for University of Nebraska - Lincoln. https://digitalcommons.unl.edu/dissertations/AAI9712527.
- Stiglitz, J. E. 2004. “Globalisation and Growth in Emerging Markets.” Journal of Policy Modeling 26 (4): 465–484. https://doi.org/10.1016/j.jpolmod.2004.04.010.
- Stokey, N. L. 1995. “R &d and Economic Growth.” Review of Economic Studies 62 (3): 469–489. https://doi.org/10.2307/2298038.
- Stone, S., and B. Shepherd 2011. “Dynamic Gains from Trade: The Role of Intermediate Inputs and Equipment Imports.”Trade Policy Paper. No. 110, OECD. https://doi.org/10.1787/18166873.
- Tebaldi, E., and B. Elmslie. 2008. “Institutions, Innovation and Economic Growth.” Journal of Economic Development 33 (2): 27–53. https://doi.org/10.35866/caujed.2008.33.2.002.
- UNESCO. 2020, (Accessed September 9, 2020). http://hdr.undp.org/en/indicators/103706#.
- Valev, N. 2020. (Accessed September 9, 2021). http://www.theglobaleconomy.com.
- Vedia-Jerez, D. H., and C. Chasco. 2016. “Long-Run Determinants of Economic Growth in South America.” Journal of Applied Economics XIX (1): 169–192. https://doi.org/10.1016/S1514-0326(16)30007-1.
- Vincent, R. C. 2016. “The Internet and Sustainable Development: Communication Dissemination and the Digital Divide1.” Perspectives on Global Development and Technology 15 (6): 605–637. https://doi.org/10.1163/15691497-12341410.
- Wang, J.-H. August 2, 2007. ““From Technological Catch-Up to Innovation-Based Economic Growth: South Korea and Taiwan Compared.” The Journal of Development Studies 43 (6): 1084–1104. https://doi.org/10.1080/00220380701466609.
- Williams, G. 2011. Data Mining with Rattle and R. New York: Springer.
- Wong, P. K., Y. P. Ho, and E. Autio. 2005. “Entrepreneurship, Innovation and Economic Growth: Evidence from GEM Data.” Small Business Economics 24 (3): 335–350. https://doi.org/10.1007/s11187-005-2000-1.
- World Bank. 2020a. https://blogs.worldbank.org/opendata/new-country-classifications-income-level-2019-2020.
- World Bank. 2020b. (Accessed September 9, 2020). https://databank.worldbank.org/.
- World Bank. 2021, https://blogs.worldbank.org/opendata/new-world-bank-country-classifications-income-level-2020-2021.
- Zhong, L. 2017. “Innovation as Determinants of Economic Growth in U.S. Counties.” The Journal of Applied Business and Economics 19 (4): 107–115.
Appendix
Table A1. List of transitioned countries based on Current GNI US$ based on Atlas method.
Table A2. List of key variables.
Table A3. Descriptive statistics during 1990–2019.
Table A4. Random forest -variable importance using income level (category) as target variable.
Figure A1. LML function at mean of covariates (Argentina excluded).
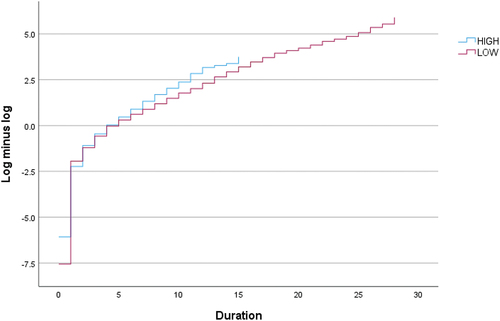
Figure A2. Survival function at mean of covariates (Argentina excluded).