
 ?Mathematical formulae have been encoded as MathML and are displayed in this HTML version using MathJax in order to improve their display. Uncheck the box to turn MathJax off. This feature requires Javascript. Click on a formula to zoom.
ABSTRACT
Changes in economic conditions can occur suddenly with drastic effects. However, economic statistics are published with significant lags, e.g. GDP, and more timely information about the economy is required. Nowcasting methods have become widely popular for providing up-to-date information about the current economic stance. This study adds a novel idea to the previous literature by nowcasting the nowcasting, i.e. the purchasing manager’s index (PMI) and the non-manufacturing survey index (NSI) of the ISM Business survey indicators with the weekly Google Trends data. We used two-dimension reduction methods: the principal component analysis (PCA) and partial least squares (PLS) to eliminate ‘the curse of dimensionality’. Pseudo-out-of-sample exercises performed with different Google Trends search categories indicated that Google Search data is able to generate useful information to nowcast the nowcasting. In particular, we contribute the existing literature that weekly Google Search data can nowcast the monthly PMI and NSI.
I. Introduction
Economic statistics are published with a significant lag or delay. For example, statistical production and data availability limit the United States gross domestic product (GDP) publication speed, which is published quarterly at the latest. At a minimum, these limits in statistical production cause a two-month lag between the current and newest publications. However, changes in the underlying economic situation can occur suddenly, and more current information is desperately called-for, as policymakers and other institutions are required to make fast decisions in uncertain times. We provide a new method to speed up the evaluation of forthcoming and concurrent economic stance: Google searches.
Nowcasting attempts to produce forecasts about the current economic conditions (Choi and Varian Citation2012). It can provide short-term forecasts about different macroeconomic variables, sometimes months before their official publishing, e.g. Javed, Kiss and Österholm (Citation2022) nowcasted several countries GDP growth including Australia, Canada, France, Japan, the United Kingdom, and the United States.
Nowcasting models demand high-frequency data. One highly potential timely data source is Internet search data. Google LLC’s search engine is one of the most-used search engines in the world (Statista Citation2022). Google LLC has made its search data openly available on its Google Trends website,Footnote1 which is one of the largest public databases available. Google Trends data has already been used to forecast consumption and unemployment (Choi and Varian Citation2012; Nagao, Takeda, and Tanaka Citation2019; Tuhkuri Citation2014; Vosen and Schmidt Citation2011), consumption and sales (Carrière‐Swallow and Labbé Citation2013), housing and financial markets (McLaren and Shanbhogue Citation2011; Perlin et al. Citation2017), exchange rates (Bulut Citation2018; Ito et al. Citation2021) and GDP growth (Götz & Knetsch, Citation2019; Woloszko Citation2020). Previous research has also employed Google Trends data to proxy recession, interest, and sentiment. Iselin and Siliverstovs (Citation2016) utilized Google Trends in their recession indicator, while Ma and Fang (Citation2021) applied it to proxy regional interest and its effect on international trade. Apergis, Chatziantoniou and Gabauer (Citation2022) proxied Google Trends as their COVID-19 news sentiment to examine its relation to S&P 100, crude oil, and gold volatility indices.
To the authors’ knowledge, studies using Google Trends to nowcast ISM Business surveys are scarce. ISM, which is also known a PMI, provides nowcasting information for economic outcomes while it comprises data of 400 purchasing executives survey information in manufacturing sector in 20 industries. We also examine the Google Trends nowcasting performance over non-manufacturing survey index (NSI). Cournède et al. (Citation2020) used Google Trends data to study the purchasing manager’s index (PMI) in the construction sector. This is quite an oversight as PMI indexes are typically used in economic models: see, e.g. Lahiri and Monokroussos (Citation2013) for augmenting GDP forecasts with ISM Business survey indexes, stressing the relevance of non-manufacturing indexes.
Our research question asks: can Internet searches foreshadow a firm manager’s behaviour and thus reveal their intentions? We used four different data sources to answer this question. The first two were Business Survey indexes: the Purchasing manager’s index (PMI) and the non-manufacturing survey index (NSI) from the Refinitiv Marketpsych database. The third data were Google Trends, and the fourth was the US GDP. Our paper’s methods greatly complement and add to the previous literature. The studies trying to nowcast ISM business Surveys are still rare. Compared to earlier studies with Google Trends, we used more timely weekly Google Trends data and simple linear nowcasting models to allow greater model transparency, i.e. to eliminate black-boxes methods. Using two transparent dimension reduction methods, we could also use a wide range of different search categories.
Our results indicate that Google Trends is able to nowcast traditional business cycles forecasting variables (i.e. nowcasting the nowcast) like PMI and NSI. The Google Trends model was even able to forecast the decrease in the PMI just before the actual decline during the spring of 2020 due to Covid-19. Accordingly, Google Trends capture firm managers’ behaviour being related to the Business and Industrial category searches even before the publication of PMI information which stresses its usefulness for nowcasting purposes.
II. Research setup
Data
We used similar subcategories as Götz & Knetsch (Citation2019). However, the subcategories of finance and food were slightly different, and we did not use Sensitive subjects’ subcategories (see search categories in Appendix A Tables A1-A4). Nevertheless, selected subcategories could help us dissect the background effects in the searches. Unfortunately, the data becomes highly dimensional (i.e. we had 181 different subcategories in the dataset). We applied two dimension reduction methods to mitigate this issue: principal component analysis (PCA) and partial least squares (PLS). Moreover, we compressed these subcategories to appropriate broad categories via the first component in the PCA and PLS. These broad categories are in .
Table 1. Broad search categories.
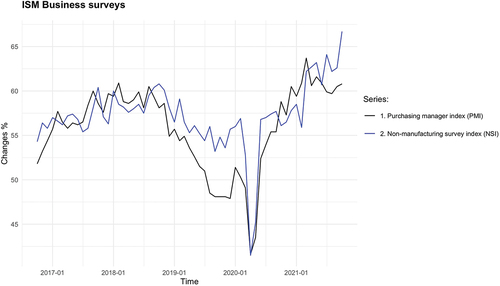
The ISM data ranged from M10:2016 – M10:2021, and the weekly Google Trends data ranged from 20 September 2016 – 20 November 2021. To alleviate any possible sampling variance (noted by Medeiros and Pires (Citation2021)), we collected 15 samples of Google Trends data on different days, after which the data were averaged. To aggregate the weekly data, we used a single complete week of data from each month, and then the monthly Google data ranged from M10:2016 – M10:2021. For example, we used Google Trends weekly data from 16.10.2016 – 23.10.2016 to represent monthly value for October 2016. More details about selected weeks are in Appendix A Table A5. The quarterly US GDP data (in changes compared to the previous quarter) was Q4:2016 – Q3:2021. We needed to decide aggregation scheme to forecast quarterly GDP with monthly data. We found the results on aggregation methods quite sensitive and chose to aggregate the monthly data by three months averaging.
Figure 1. ISM Business surveys in the US.
Estimation method
The collected Google Trends was highly dimensional as it had p larger than n (i.e. 181 > 61). This can lead to noisy and over-fitted models with poor predictions (James et al. Citation2013, 266). Hence, we applied two different dimension reduction techniques. First, we used the principal component analysis (PCA).
In PCA we reduced the dimensional space by using only the first or second principal components. Moreover, PCA is trying to compute the best linear approximations of the underlying data. If we assume that the data is centered, we can present the PCA as a singular value decomposition (SVD). (Hastie et al. Citation2009; James et al. Citation2013; Jolliffe Citation2002)
Equation (1) presents the standard decomposition, where U is an n x p orthogonal matrix (U’U = Ip) with orthonormal columns, i.e. left singular vectors of X. V is a p x p orthogonal matrix (V’V = Ip) with columns v, i.e. the right singular vectors. The D is the diagonal matrix with diagonal elements d, i.e. singular values. Using the SVD definition and multiplying the original data X with orthogonal matrix V, we can present principal components as in the Equation (2). (Jolliffe Citation2002.)
Equation (2) decomposes the principal components to the original data matrix X and as loadings V. By the definition of orthogonal matrix V, this can be further decomposed as principal component scores z (Jolliffe Citation2002.). Now, the th number of scores can be used to reduce the data’s dimension. Second, we applied the partial least squares (PLS). The PLS is a supervised statistical learning method as it uses the response variable (i.e. business survey index) to select optimal components. After centering and standardizing the data, the PLS uses a specific algorithm to formulate the components. (Hastie et al. Citation2009; James et al. Citation2013)
Table
Algorithm (1) indicates that PLS weights directions by the covariance between the predictors
and response
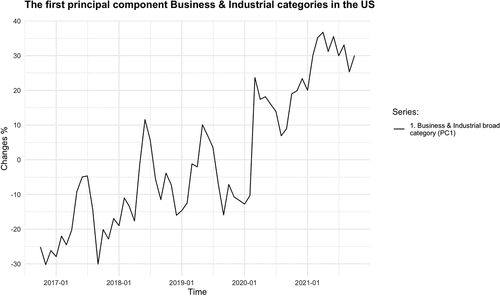
. Highest weight is placed on the variables with the strongest relation to the response. The output is a similar type of score matrix as in PCA, which can be used in an OLS estimation (Hastie et al. Citation2009; James et al. Citation2013). We used dimension reduction methods to extract a single component, e.g. we fed subcategories related to ‘Business & Industrial’ the PCA (or PLS). So, we inputted the subcategories shown in Appendix A Tables A1-A4. We then used the first component in a simple linear regression estimated using OLS. plots the first principal component scores (Changes %) from ‘Business & Industrial’ broad category formed from ex-post subcategories: ‘Advertising & Marketing’, ‘Aerospace & Defense’, ‘Agriculture & Forestry’, ‘Automotive Industry’, ‘Business Education’, ‘Business Finance’, ‘Business Operations’, ‘Business Services’, ‘Chemicals Industry’, ‘Construction & Maintenance’, ‘Energy & Utilities’, ‘Hospitality Industry’, ‘Industrial Materials & Equipment’, ‘Manufacturing’, ‘Metals & Mining’, ‘Pharmaceuticals & Biotech’, ‘Printing & Publishing’, ‘Professional & Trade Associations’, ‘Retail Trade’, ‘Small Business’, ‘Textiles & Nonwovens’ and ‘Transportation & Logistics’. Our findings, based on ex-post Google data, indicate that on average, across broad category models, the first principal component explained approximately 49.38% of the variation. With the full dataset, the most contributing search terms in terms of PCA loadings were ‘Vehicle Codes & Driving Laws’, ‘Jobs’, ‘Men’s Health’, ‘Custom & Performance Vehicles’ and ‘Printing & Publishing’. Thus, part of the searches were related to the durable goods (vehicle) and jobs (jobs).
Figure 2. Business & Industrial broad category the first principal component (PC1) scores.
We performed pseudo-out-of-sample nowcasting exercises in order to produce realistic forecasting conditions (i.e. restricting the moment when the data is inserted in the models). The initial training sample was 12 months (or four quarters with quarterly data), which increased every step (i.e. expanding window). The test set was always the not-yet-published business survey (or the GDP) statistic, e.g. in the first estimation step, it was the 13 months (or 5 quarters with quarterly data).
Equation (3) represents the Google Trends model with only the first component of each broad category, estimated in each forecasting step. In the first forecasting step, for example, for ‘Autos & Vehicles’ subcategories (i.e. 19 columns), we used data from M10:2016 – M10:2017, for which we applied dimension reduction methods to generate the single component, which we used in Equation (3). We estimated Equation (3) using OLS, from which we got the parameters and
. We then used these parameter estimates with the longer test sample to generate the forecast of the Business survey (i.e. PMI or NSI). In the second forecasting step, the training sample is 13 months, and the test sample is 14 months. The data included in the training and test sets continue to increase until the end of the dataset. Equation (4) serves as a benchmark AR-1 model. Equation (5) integrates both the AR-1 and Google variables, Equation (6) depicts the GDP nowcast from the Business survey indexes (i.e. PMI and NSI). In this specification, we used an initial sample of 4 quarters of the Business survey data in the training set. We estimated the parameters in Equation (6) using OLS and used them together with the more extended initial test sample of 5 quarters to generate GDP forecasts. Equation (7) denotes the GDP nowcasts from the Google category models, which we produced by a similar procedure as in Equation (3). The main difference is that data is quarterly; thus, the initial training sample was four quarters, and the initial test sample 5 quarters.
To evaluate the accuracy of the nowcasting models, we used root-mean-squared errors (RMSE) as presented in Equations (8). Lower RMSE scores indicate greater accuracy of the nowcasting model. In addition, we visually assessed the overall performance of the forecasting models using figures to complement our analysis.
III. Empirical results
Figure 3. The most accurate Google models to nowcast PMI and AR-1 model.
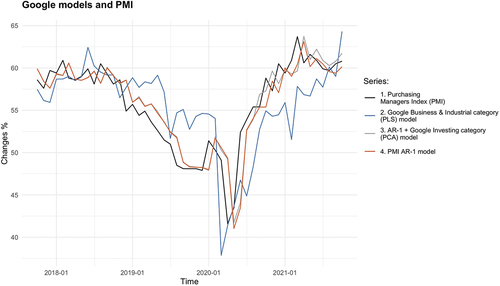
The most accurate model to nowcast PMI was the Google Investing category model, generated via principal component analysis (PCA), which included the AR-1 variable (Equation (5)) and achieved an RMSE score of 2.348. It was able to outperform the AR-1 model (Equation (4)), which had an RMSE score of 2.403. This suggests that Google data provides additional forecasting information. The complete set of RMSE results for the Google models is provided in Appendix B, Tables B1, B2 and B3. According to , although the Business & Industrial (PLS) category model had a higher RMSE score of 4.398 compared to the AR-1 model, it seems to indicate a decrease in the PMI just before the actual decline during the spring of 2020. This could be attributed to firm managers’ behaviour being related to the Business & Industrial category searches.
Figure 4. The most accurate Google models to nowcast NSI and AR-1 model.
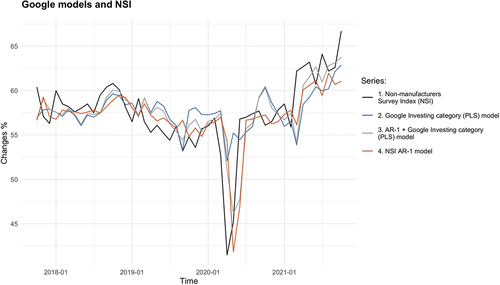
Our findings indicate that the Google model incorporating the AR-1 variable in the investing category model demonstrated superior performance, with an RMSE value of 2.874 when compared to other models nowcasting NSI. In contrast, the RMSE score of the benchmark AR-1 model was 3.172. We observed a significant decrease in Google searches related to investing, in alignment with the non-manufacturing survey index (NSI), as depicted in . This decline in searches related to Investing category correlated with the observed drop in both PMI and NSI response variables during the spring of 2020.
Our results suggest that Google search data, particularly within the investing-related categories, can yield valuable insights for nowcasting both PMI and NSI. This underscores the potential utility of Google search data in applied economic research. This contributes novel evidence to the existing literature regarding the efficacy of Google search data as a predictive tool for forecasting the purchasing manager’s index and non-manufacturing index.
Next, we evaluated the effectiveness of purchasing managers index (PMI) and non-manufacturing index (NSI) in nowcasting the GDP. illustrates the PMI model’s (Equation (6)) nowcasts for the US GDP (RMSE = 2.995).
Figure 5. The PMI nowcasts of GDP.
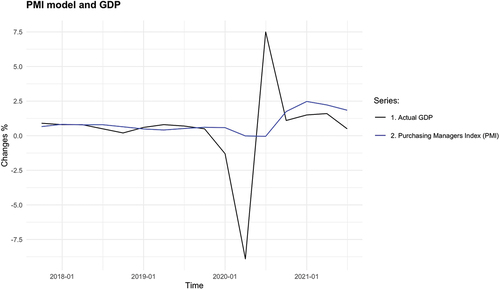
However, we observed that the significant decrease in the spring of 2020, which was previously displayed in , appeared to be dampened when PMI was aggregated to quarterly levels, as shown in . Additionally, the PMI model was unable to accurately predict the drastic GDP collapse that occurred during the spring of 2020.
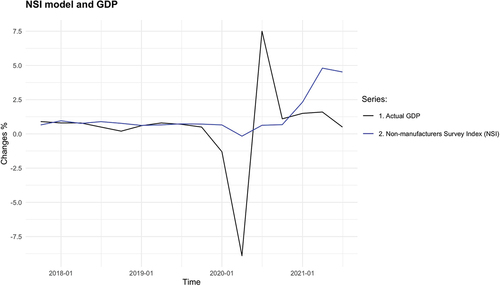
A similar narrative is in – the NSI model nowcasts only a minor decrease in the US GDP after the spring of 2020. The NSI model’s RMSE score was 3.116. Interestingly, the NSI model seems to nowcast an increase in the US GDP after the actual GDP growth.
Figure 6. NSI nowcasts of GDP.
These results indicate that while PMI and NSI data may be useful in predicting GDP under normal economic conditions, it may not be effective in predicting the impact of economic crises. Therefore, other alternative data sources should be considered for nowcasting GDP during times of significant economic downturn.
demonstrates the effectiveness of Google models in nowcasting the US GDP, and it reveals that investing-related searches exhibited a slight upward trend following the rise in the US GDP. Based on the findings presented in , the most accurate Google model yielded results comparable to those of the PMI and NSI models.
Figure 7. The most accurate Google model to nowcast US GDP.
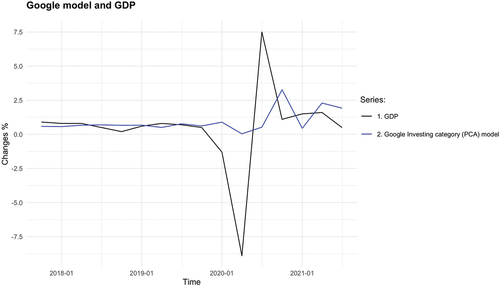
Table 2. RMSE results for nowcasting GDP.
Specifically, the Investing category model outperformed the others, generating an RMSE of 2.981, which was marginally lower than the RMSE scores obtained by the PMI and NSI models. These results suggest that Google search data could offer valuable insights into economic trends.
IV. Conclusions
We have discovered compelling evidence demonstrating that Google Trends can provide supplementary information for nowcasting the ISM PMI. Among the models considered, the one incorporating both AR-1 and the investing-category from Google Trends emerged as the most accurate. Interestingly, the Business & Industrial category model projected a significant decline in PMI during the spring of 2020, coinciding with the COVID-19 outbreak. Additionally, we find intriguing evidence that Google Trends data can yield valuable information when nowcasting the ISM non-manufacturing survey index (NSI). While the model featuring both the AR-1 and the investing category from Google Trends was the most accurate, the model solely utilizing the investing category accurately forecasted a sharp decrease in the NSI during the spring of 2020. Surprisingly, none of our nowcasting models was able to forecasts the sharp drop in the US GDP growth in spring 2020. Nevertheless, our results point out that weekly Google Trends data generates useful insights for nowcast the nowcasting, i.e. the purchasing manager’s index (PMI). Moreover, weekly Google data’s timeliness allows for an even faster estimate of the current economic conditions in the United States by helping to forecast changes in monthly economic variables and alleviating data limitations.
Acknowledgments
The JyIMaF research group is thankful for the OP Group Research Foundation’s financial support. Mr. Heikkinen is also grateful to the Jenny & Antti Wihuri foundation, YJS foundation and JSBE for their financial support. We also thank two anonymous referees for their comments.
Disclosure statement
No potential conflict of interest was reported by the author(s).
Additional information
Funding
Notes
References
- Apergis, N., I. Chatziantoniou, and D. Gabauer. 2022. “Dynamic Connectedness Between COVID-19 News Sentiment, Capital and Commodity Markets.” Applied Economics 1–15. https://doi.org/10.2139/ssrn.3797881.
- Bulut, L. 2018. “Google Trends and the Forecasting Performance of Exchange Rate Models.” Journal of Forecasting 37 (3): 303–315. https://doi.org/10.1002/for.2500.
- Carrière‐Swallow, Y., and F. Labbé. 2013. “Nowcasting with Google Trends in an Emerging Market.” Journal of Forecasting 32 (4): 289–298. https://doi.org/10.1002/for.1252.
- Choi, H., and H. Varian. 2012. “Predicting the Present with Google Trends.” Economic Record 88 (s1): 2–9. https://doi.org/10.1111/j.1475-4932.2012.00809.x.
- Cournède, B., V. Ziemann, and F. De Pace 2020. “The Future of Housing: Policy Scenarios,” OECD Economics Department Working Papers 1624, OECD Publishing.
- Götz, T. B., and T. A. Knetsch. 2019. “Google Data in Bridge Equation Models for German GDP.” International Journal of Forecasting 35 (1): 45–66. https://doi.org/10.1016/j.ijforecast.2018.08.001.
- Hastie, T., R. Tibshirani, J. H. Friedman, and J. H. Friedman. 2009. The Elements of Statistical Learning: Data Mining, Inference, and Prediction, 1–758. Vol. 2. New York: springer.
- Iselin, D., and B. Siliverstovs. 2016. “Using Newspapers for Tracking the Business Cycle: A Comparative Study for Germany and Switzerland.” Applied Economics 48 (12): 1103–1118. https://doi.org/10.1080/00036846.2015.1093085.
- Ito, T., M. Masuda, A. Naito, and F. Takeda. 2021. “Application of Google Trends‐Based Sentiment Index in Exchange Rate Prediction.” Journal of Forecasting 40 (7): 1154–1178. https://doi.org/10.1002/for.2762.
- James, G., R. Tibshirani, D. Witten, and T. Hastie. 2013. An Introduction to Statistical Learning: With Applications in R. New York: Springer.
- Javed, F., T. Kiss, and P. Österholm. 2022. “Performance Analysis of Nowcasting of GDP Growth When Allowing for Conditional Heteroscedasticity and Non-Gaussianity.” Applied Economics 54 (58): 6669–6686. https://doi.org/10.1080/00036846.2022.2075823.
- Jolliffe, I. T. 2002. Principal Component Analysis. 2nd ed. New York: Springer.
- Lahiri, K., and G. Monokroussos. 2013. “Nowcasting US GDP: The Role of ISM Business Surveys.” International Journal of Forecasting 29 (4): 644–658. https://doi.org/10.1016/j.ijforecast.2012.02.010.
- Ma, S., and C. Fang. 2021. “The Effect of Online Search on International Trade.” Applied Economics 53 (46): 5369–5384. https://doi.org/10.1080/00036846.2021.1922593.
- McLaren, N., and R. Shanbhogue. 2011. “Using Internet Search Data as Economic Indicators.” Bank of England Quarterly Bulletin 51 (2): 134–140. https://doi.org/10.2139/ssrn.1865276.
- Medeiros, M. C., and H. F. Pires. 2021. “The Proper Use of Google Trends in Forecasting Models.” arXiv Preprint arXiv: 2104.03065. https://doi.org/10.48550/arXiv.2104.03065
- Nagao, S., F. Takeda, and R. Tanaka. 2019. “Nowcasting of the US Unemployment Rate Using Google Trends.” Finance Research Letters 30:103–109. https://doi.org/10.1016/j.frl.2019.04.005.
- Perlin, M. S., J. F. Caldeira, A. A. P. Santos, and M. Pontuschka. 2017. “Can We Predict the Financial Markets Based on Google’s Search Queries?” Journal of Forecasting 36 (4): 454–467. https://doi.org/10.1002/for.2446.
- Statista. (2022). Market Share of Google. Retrieved from https://www.statista.com/statistics/216573/worldwide-market-share-of-search-engines/.
- Tuhkuri, J. 2014. Big Data: Google Searches Predict Unemployment in Finland. ETLA Reports, 31.
- Vosen, S., and T. Schmidt. 2011. “Forecasting Private Consumption: Survey‐Based Indicators Vs. Google Trends.” Journal of Forecasting 30 (6): 565–578. https://doi.org/10.1002/for.1213.
- Woloszko, N. 2020. Tracking Activity in Real Time with Google Trends. OECD. https://doi.org/10.1787/6b9c7518-en.
APPENDIX A
Table A1. Google Trends subcategories 1.
Table A2. Google Trends subcategories 2.
Table A3. Google Trends subcategories 3.
Table A4. Google Trends subcategories 4.
Table A5. Selected weeks of Google Trends data.
APPENDIX B
Table B1. Google Trends RMSE results for nowcasting PMI.
Table B2. Google Trends RMSE results for nowcasting NSI.
Table B3. Google Trends RMSE results for nowcasting GDP.