
 ?Mathematical formulae have been encoded as MathML and are displayed in this HTML version using MathJax in order to improve their display. Uncheck the box to turn MathJax off. This feature requires Javascript. Click on a formula to zoom.
ABSTRACT
In most developed countries, patients have been encouraged to elect their preferred choice of health care provider. However, this is different for specialized care, where the patient’s referral could be defined as a two-stage decision process and their options are pre-selected by their general practitioner (GP). In this study, we estimate patient preferences while controlling for the pre-selection procedure, and we investigate whether patients are actively choosing their provider for cancer care. The French national hospital discharge database (Programme de Médicalisation des Systèmes d’Information, PMSI – MCO 2017) has been used for investigation. We estimated a multinomial choice model when choice sets are in fact unobserved, which is assumed to identify patient preferences, in a revealed preferences framework. Our findings provide evidence that patients consider factors other than distance to select their provider. The patient – hospital distance as well as the specialization profile of providers appears to be internalized in the pre-selection process, while patients rather consider waiting times, hospital quality, and other provider attributes to make their final choice. We also found that patients would be treated in higher-quality hospitals if they had the opportunity to choose among all available providers.
I. Introduction
Understanding the referral process during which a patient chooses a health care provider is a major topic in health economics. In the matching between patients and hospitals, information is highly asymmetric (Arrow Citation1963; Choné and Ma Citation2011). Patients may not have sufficient information about appropriate healthcare providers for their condition, and some hospital attributes might be too complex for patients to understand (Faber et al. Citation2009; Gutacker et al. Citation2016). Information asymmetry increases the risk of adverse selection. When patients lack information on provider attributes they are less likely to make a choice that maximizes their utility.Footnote1 Hence, most health systems mandate patients are addressed by their general practitionerFootnote2 (GP) for specialized care in order to be reimbursed by the social security system (Garattini et al. Citation2023). In this context, patient referral could be defined as a two-stage decision process (Beckert Citation2018). During the first stage, GPs pre-select a subset of providers they deemed appropriate from all alternatives. Then, during the second stage patients will choose their preferred provider among the pre-selected choice set. The role of GPs as patient agents is to reduce the risk of adverse selection. Indeed, GPs benefit from superior information on alternative providers, in particular by using their extended network and based on their accumulated experience.
Nevertheless, GPs act as imperfect agents for patients as they pre-select a subset of providers based on their own preferences (Beckert Citation2018; Irvine, van der Pol, and Phimister Citation2019). It should be considered that GPs also assume the role of agents of health authorities since their decision may have an important impact on public health expenses (Brosig-Koch et al. Citation2015). Thus, there could be some attributes considered by patients only (e.g. hospital amenities) or by GPs only (e.g. technical quality indicators, public health expenses). Therefore, in the presence of information asymmetry, it is not clear whether patients are actively choosing their provider or if they are deferring their decision to their GP. This is especially relevant for complex care where information is likely to be even more asymmetric, and the size of the pre-selected choice set could thus drastically constrain the patient’s choice.
The aim of this study is to evaluate whether or not patients are actively choosing their provider for complex care with highly asymmetric information, taking into account the unobservable nature of choice sets in the French institutional setting. Using a nation-wide database, we study the case of breast cancer, which is the most frequent cancer among women. We focus on first-line treatment, particularly on hospital stays during which surgery was performed. For this type of cancer in particular,Footnote3 patient preferences have major implications for their health as the outcome of the surgical act could vary significantly from one hospital to another, depending on their hospital volume activities (Yen et al. Citation2017).
Several policies have been implemented in order to weaken the barriers obstructing the patient’s freedom of choice (Victoor et al. Citation2016). For example, in 2006 the UK set a reform which mandates GPs to offer at least five alternatives of providers when referring patients to a specialist. A recent study employed a structural model of demand based on the 2006 reform which explicitly models the selection process during which GPs pre-select a subset of alternatives (Gaynor, Propper, and Seiler Citation2016). Results support the theoretical expectation that increasing choices makes patients more responsive to the clinical quality of care in health systems where prices are excluded as demand shifters, which has led to a decrease in overall mortality rates. There have been several policies aimed at increasing patient’s access to objective quality information about health care providers to lessen information asymmetry. Nevertheless, evidence that patients rely on objective quality information is mixed, with some patients tending not to use the additional information provided (Avdic et al. Citation2019; Faber et al. Citation2009; Gutacker et al. Citation2016).
In the existing literature, a wide range of empirical studies have investigated the determinants of the patient’s choice by assuming that GPs and their patients act as a single decision-maker during the referral process. Empirical findings show that patients often bypass the nearest provider to find a hospital that best matches their preferences (Beckert and Kelly Citation2021; Gaynor, Propper, and Seiler Citation2016; Huguet Citation2020; Moscelli et al. Citation2016; Victoor et al. Citation2012). Findings suggest that the probability of choosing a hospital increases with its measured quality and decreases with waiting times and distance. However, this literature assumed a fixed choice set and thus ignored the agency problem and the role of GPs in the referral process.
There is also abundant literature investigating the influence of previous choices on future choices, providing evidence that past experiences and other patient experiences play an important role in future patient choices (Kozikowski et al. Citation2022; Pitkänen and Linnosmaa Citation2021). Regarding this aspect, a recent study investigated patient preferences in a rehabilitation facility for disabled patients who receive the service frequently (Pitkänen and Linnosmaa Citation2021). An interesting feature was that they distinguished choices of patients choosing a provider for the first time (new patients), as well as the choices of experienced patients who either initiated the switch (active switchers) or were forced to switch their provider (forced switchers) because their initial provider was no longer available in the pool of providers. They provide evidence of heterogeneous preferences, suggesting that new patients seek very experienced providers, active switchers have learned about certain quality aspects, and forced switchers may have had only limited time to choose their new provider.
However, only a few studies to date have delved into the agency problem and the role of GPs in the referral of patients to hospitals. In the US, there is a trend of integrating physician practices into hospitals, which has launched debates about the effect of such integration on the agency problem between physicians and patients. Using data on Medicare beneficiaries, the hospital’s ownership of a physician has indeed been shown to increase the probability that the physician’s patients will choose the owning hospital (Baker, Bundorf, and Kessler Citation2016). Note that in most western European countries (e.g. Germany, France, UK) GPs are independent in the sense that there is no integration into hospitals (Garattini et al. Citation2023). Nevertheless, GPs still have a central role in the referral process by pre-selecting a subset of providers based on their own utility function. Using UK administrative data, a study showed that ignoring the pre-selection process leads to biases and inconsistencies (Beckert Citation2018). Their findings support the notion that GPs act as imperfect agents for patients. The main finding is that patients tended to base their choice on tangible hospital attributes such as amenities and waiting times, whereas GP pre-selection was driven by distance, quality, and costs.
Using a revealed preferences framework, the main methodological challenge to disentangle patient preferences from observed patient-hospital allocation is that the true choice set is unobserved by the econometrician. Regarding this issue, we relied on an approach that allows the estimation of a multinomial choice model when choice sets are in fact unobserved (Lu Citation2022). While the true choice set is unobserved, the concept is to set an upper bound and a lower bound of the true choice set. In this study, we defined the lower bound as choices made by other patients around each patient’s place of residence, assuming that patients having the same condition, and which are living close to each other are likely to benefit from a similar pre-selected choice set. The bound on choice set can then be turned into a bound on choice probabilities, and the identification of the bound estimator relies on a moment inequality approach.
This study contributes to the existing literature by building on several aspects. First, we provide evidence of patient preferences for cancer care providers. Indeed, very little is known about patient preferences for cancer care. Cancer is a life-threatening disease that can only be treated by a subgroup of providers who receive approbation from health authorities. Information in this context can be even more asymmetric between patients and hospitals. Cancer treatments often include a chemotherapy treatment, which requires the patient to return for each chemotherapy cycle, and could also decrease the likelihood for patients to bypass their nearest hospital. We also contribute to the literature addressing the choice set formation. We show that taking into account unobserved choice sets in the modelling of cancer care provider choices significantly impacts the results.
The remaining part of this paper is structured as follows: section II describes the data, section III describes the empirical strategy and details the identification of the bound estimator, section IV presents the results, section V provides a discussion of the results and concludes.
II. Data
We used three data-sets in order to get detailed information on patient characteristics, and hospital attributes. We identified patients treated for breast cancer in France by using hospital discharge data from the PMSI, managed by the government agency named the Agence Technique de l’Information sur l’Hospitalisation (ATIH). The PMSI is an exhaustive, nationwide database for recording information about each hospital stay in France. The inclusion criteria were being diagnosed for breast cancer, and surgically treated in a hospital in mainland France in 2017. We focused on surgery, which is the gold standard initial treatment for breast cancer patients (Waks and Winer Citation2019). Using a retrospective cohort of patients in the US National Cancer Database treated in 2004–2016, Boyce-Fappiano et al. showed that only 4% of breast cancer patients did not undergo surgery (Boyce-Fappiano et al. Citation2021). Interestingly, they also shed light on a higher propensity to not undergo surgery for breast cancer patients with more aggressive disease and lower socioeconomic status. Thus, we believe that including patients who did not undergo surgery would introduce more heterogeneity in the sample. More details about the inclusion criteria are provided in Appendix A. Each patient’s, information included the FINESS hospital number where the surgeries were performed (i.e. a unique identifier of hospitals), the exact location of hospitals, the place of residence of patients, the patient’s length of stay in the hospital, and the age of the patient. We also computed straight-line distances in kilometres between patients’ residential municipalities and the exact location of all hospitals in mainland France. The comprehensiveness of the data allows us to compute the geographical availability of providers for each patient, as the number of available hospitals (i.e. having authorization to treat cancer) within a 50-kilometre radius using the distances patient – hospital.
We included information from the French Hospital Survey (SAE), managed by the Directorate for Research Studies Evaluation and Statistics (DREES), in order to get detailed attributes of hospitals in which breast cancer patients were cared for. We included information about the type of hospitalFootnote4 (i.e. public, private for-profit, private not-for-profit), the degree of specialization in oncology (i.e. the proportion of oncology cases relative to the total activity), and waiting times (i.e. bed occupancy rate). Our measure of hospital quality is the accreditation level assigned by the French Authority for Health (HAS) (French National Authority for Health Citation2018). The accreditation level is separated into four levels: without recommendations (A), with recommendations (B), with reservations (C), and conditional accreditation (D). Naturally, the accreditation process is informative about a rather general dimensionFootnote5 of the hospitals’ quality, which is certainly not the most relevant one for cancer care. For example, the degree of specialization might be more important for patient outcomes in cancer care (Yen et al. Citation2017). Still, the accreditation level is one of the few quality indicators that are easily accessible by patients online, so they are likely to be taken into account during the decision process.
To get information on hospital amenities, we matched our data with the ‘e-Satis’ survey of patients satisfactory managed by the HAS. We used the score to relate to how patients rated their room during their hospital stay (i.e. room rate), which is computed by the HAS overall respondents regardless of their disease and adjusted for patient health status.
III. Methods
Using the random utility framework,Footnote6 patient indirect utility can be described by choosing hospital
as:
Where represents the observed attributes of the utility, including the distance between patients and hospitals (measured as a continuous variable as well as a dummy indicating whether the hospital is the nearest to a patient’s place of residence), hospital amenities (i.e. patient room rate), hospital quality (i.e. accreditation level), type of hospital (i.e. public, private for-profit or private not-for-profit), degree of hospital specialization and waiting times (i.e. bed occupancy rates).
is the unobserved attributes of the econometrician such as hospital quality (unobserved part), personal experience, or feedback from social networks;
is an idiosyncratic shock representing taste heterogeneity;
is the true choice set, and finally,
is the full choice set. We allow for heterogeneity in patient preferences on distance according to their age and length of stay (i.e. a proxy for the severity of the diseaseFootnote7) via interaction terms. Heterogeneous preferences regarding hospital quality and amenities according to the geographical availability of providers are also allowed through interaction terms. While being an exogenous constraint on patient choice, the number of alternatives available within a reasonable distance could lead to heterogeneous preferences. Note that the geographical availability of providers is discretized as a dummy indicating 1 if the number of available hospitals is over the median and zero otherwise, due to the bi-modal distribution of that variable. We also allowed for unobserved heterogeneity in patient preferences through random coefficients for preferences on waiting times, degree of specialization, and type of hospital.
The Mixed Logit model, also called the Random Coefficient Logit model, has become the standard approach to model hospital choice (McFadden and Train Citation2000). In fact, any Random utility model can be approximated by a Mixed Logit model with the appropriate econometric specification. The key feature of such models is to allow for different preferences by patients through random parameters that vary among patients. However, the problem with estimating such a model is that, while we observe the full choice set (), the true choice set (
) is unobserved. As a benchmark, we estimate the parameters of the random utility model using a Mixed Logit model by assuming that
corresponds to all hospitals within 160 kilometres of a patient’s place of residence. We excluded providers located further away in order to avoid the most irrelevant alternatives.Footnote8 By assuming a fixed and observed choice set, the Mixed Logit model considers the GPs and patients as a single decision maker in the sense that it ignores the role of the GPs to pre-select a subset of alternatives. The aim of this benchmark estimation is to identify factors (i.e. hospital attributes) playing a role in the referral of patients to hospitals.
Nevertheless, to disentangle patient preference, it is necessary to estimate the probability of patient choices based on their pre-selected choice set. There are different ways of dealing with unobserved choice sets heterogeneity in the existing literature (Crawford, Griffith, and Iaria Citation2021). The most popular approach consists of modelling the choice set formation and the specific choice made by an agent conditionally on a certain choice set. This empirical approach has been widely applied in marketing studies, where products change rapidly in markets that make the assumption of full information unreliable (Goeree Citation2008; Mehta, Rajiv, and Srinivasan Citation2003). These studies model all possible choice sets and estimate a conditional choice probability on each of these choice sets. Then, the unconditional choice probability corresponds to the sum of each conditional choice probability times the probability that the choice set is the true choice set.
Where is equal to one if patient
chooses hospital
;
are the explanatory variables;
is the true choice set;
is one possible choice set.Footnote9 Note that
. Subsequently, different methods have been proposed to model the probability that a choice set is the true choice set. While these methods are suitable when the number of alternatives is reasonable, they become computationally expensive with high numbers of alternatives since they require integration over the distribution of unobserved choice sets in the estimation process.
A number of recent studies have proposed an alternative empirical strategy to deal with unobserved choice sets, in situations where information regarding the choice sets formation is not fully available and/or where integrating over unobserved choice sets is unrealistic due to the curse of dimensionality (Barseghyan et al. Citation2021; Lu Citation2022). In this study, we follow the empirical strategy of (Lu Citation2022), which consists of directly restricting the distribution support of consideration sets by using boundaries on choice sets.Footnote10 The main assumption is that each consumer’s true choice set () is bounded by an upper (
) and a lower (
) bound, such that
. Under this assumption, the bounds on the choice sets can be transformed into bounds on the choice probabilities.
Where is the choice probability in the lower bound,
is the choice probability in the true choice set,
is the choice probability in the upper bound, and
collectively represent the true parameters in the random utility model. The key to the transformation is a monotonicity property induced by the utility maximization in the random utility framework, which implies that if an alternative is chosen by a patient in the larger choice set, the same patient will choose the same alternative in the smaller choice set. Based on this monotonicity property, the bounds of choice probabilities can be derived using EquationEquation (1)
(1)
(1) . The parameters
are then estimated using a moment inequalities approach, where point identification is achieved if there exist some
such that the inequalities in probabilities in EquationEquation (1)
(1)
(1) are violated for a positive share of patients when
deviate from their true value
. In other words, the identification relies on the concept that some patients will have their true choice set relatively close to the bounds, such that the inequality constraints on the choice probabilities will be violated when
deviate from their true value
. Cliquez ou appuyez ici pour entrer du texte.The standard errors are obtained by bootstrap re-sampling.
This method requires setting up an upper and lower bound on the choice set. The upper bound could be defined as the whole market, which is in our case all hospitals that have treated at least one patient. To limit the number of choices, we restricted our sample to hospitals in a radius of 160 kilometres around each patient as the upper bound. The aim of this restriction is to avoid the most irrelevant alternatives, in the sense that they are located more than 160 kilometres from the patient’s home, and to ease the computation of the moment inequality estimator that could become computationally expensive with large data sets. The lower bound is more difficult to define, and it is important for identification. We defined the lower bound for a patient as hospitals chosen by other patients living within a radius of 15 kilometres of their place of residence, excluding their own choice.Footnote11 The assumption made here is that patients with the same condition, and who are living close to each other, are likely to benefit from a similar pre-selected choice set. More information about the choice of the 15-kilometre radius is provided in Appendix C. This assumption relates to the fact that GPs act as agents of patients, but are assumed to have no idiosyncratic taste variations. If this assumption holds, two patients with the same condition living in the same area should make their choice based on a similar pre-selected choice set, whether or not they were referred by the same GP. Then, if the number of patients living close to each other is sufficient, and there is some variation in the preferred hospital based on the same pre-selected choice set, taking choices made by other patients is an informative lower bound of the true choice set.
IV. Results
Descriptive statistics
We identified 57,151 patients who were surgically treated for breast cancer in mainland France in 2017, and cared for in 511 hospitals. The final sample used in this study decreased to 33,101 patients, treated in 232 hospitals, due to missing data on the patient room rate. Further descriptive statistics regarding this potential selection bias are provided in Appendix D ( in Appendix D). Nevertheless, the comprehensiveness of the initial data set based on all observations still allows us to compute the geographical density of providers around the patients’ places of residence, and then to restrict our sample to non-missing data. To maintain consistency in the analysis the following descriptive statistics are computed for the restricted sample with no missing data. More discussion regarding this potential issue of selection is provided in Section VII.
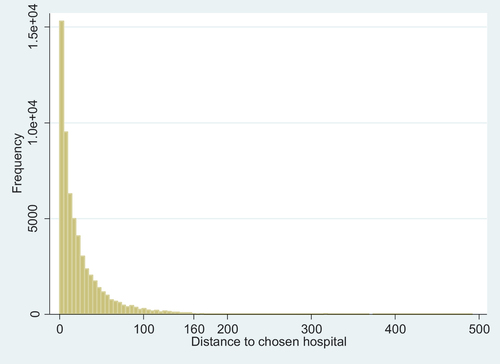
describes patient characteristics and hospital attributes in 2017 of our sample for breast cancer treatment in France. Patients had to travel an average of 26 kilometres to their chosen hospital ( in Appendix E provides more details about the distribution of distances). There is wide variation in the specialization profile of hospitals, with an average of 43% in hospital stay in oncology per hospital. The average bed occupancy rate was 59%, with wide variation between hospitals from a minimum of 18% to a maximum of 297%.Footnote12 Regarding our quality indicator, among the 232 hospitals, 42% had the highest accreditation level, 40% had the intermediate level (i.e. B) and 17% had a rather low accreditation level. A strong majority of hospitals in our sample are private for-profit (i.e. 80%), while 19% are private not-for-profit and only 1% are public hospitals. However, when considering the market share of each hospital (the number of patients treated by each hospital type), it is interesting to see that the relative weight of each hospital type differs significantly. Indeed, among patients, 59% are treated in private for-profit hospitals, 40% in private not-for-profit hospitals, and 1% in public hospitals. On this aspect, public hospitals are underrepresented in our sample due to missing data on the patient’s room rate. While we only observe 1% of patients treated in public hospitals in our sample, this share reaches 29% in the initial data set based on all observations. Yet, the market share by hospital types is still consistently ordered, with private for-profit hospitals having a higher market share (40%), followed by private not-for-profit hospitals (31%), and lastly by public hospitals.
Table 1. Descriptive statistics on patient characteristics and hospitals attributes.
Further descriptive statistics can be found in Appendix C, in order to illustrate the opportunity of alternatives for breast cancer patients seeking a provider for a surgical procedure. Interestingly, patients seem to have the opportunity to make decisions about their preferred provider among several alternatives within a reasonable distance, although this is accompanied by an unequal access ( and in Appendix C). supports the notion that patients are making a choice among available providers, since 73.95% of the patients bypassed their nearest provider (in Appendix C). Lastly, displays the distribution of the lower bound choice set size (in Appendix C). Wide variations in the distribution are present, which relates to either a degree of variability in the density of patients within 15 kilometres of a patient, or variability in the choices made by patients living in the same area.
Econometric results regarding patient referral (mixed logit)
We present in this section results from the random coefficient Logit model assuming a fixed choice set. While this type of model is miss-specified to identify patient preferences in the presence of a pre-selection process, it is informative of factors playing a role in patient referral.
It is observed that the relative location of hospitals plays an important role in the decision process (). Patients are indeed more likely to be treated in their nearest hospital , and in a hospital closer to their place of residence
. The negative impact of distance tended to be greater for older patients
and the most severely ill patients
.
Table 2. Parameter estimates from the mixed Logit model, and of the bound estimator.
Regarding hospital amenities, patients with a lower geographical availability of providers tend to be referred more often to hospitals with highly comfortable rooms , while having more choice opportunities attenuates this effect
.Footnote13
We find heterogeneous results on the accreditation level, according to the exogenous constraint of the patient’s geographical availability of providers. Patients with a lower density of providers were found to be referred more often to a moderate (i.e. accreditation level B) or low-quality (i.e. accreditation level C or D)
hospital compared to high-quality hospitals. Interestingly, having a higher density of providers available attenuates this effectFootnote14
. In other words, patients benefiting from a higher density of providers are treated significantly more often in higher-quality hospitals compared to patients having fewer provider alternatives available.
In our sample, breast cancer patients are also found to be more likely to be treated in a private not-for-profit hospital compared to a private for-profit hospital (i.e. a Wald test indicates that we can reject the null hypothesis of equality of the two coefficients ). We also found a higher likelihood for a hospital to be chosen associated with more specialized hospitals
and with less waiting times (i.e. bed occupancy rate)
. Note that while preferences regarding the specialization profile and private not-for-profit hospitals tend to be homogeneous, we identify unobserved heterogeneity in preferences regarding waiting times and private hospitals
.
Econometric results regarding patient choice (bound estimator)
Compared to the Mixed Logit specification, results from the bound estimator are assumed to be informative of patient preferences conditionally on the pre-selected choice set. When solely assessing patient preferences, the distance from patients to hospitals is only weakly significant in the decision-making process . Distance seems to be considered during the pre-selection process, but not during the final patient’s choice. Conversely, most severely ill patients still tend to prefer more nearby hospitals
. We found no heterogeneity in preferences for distance according to patient age. Thus, the heterogeneity according to patient age underlined in the Mixed Logit seems unrelated to distance aversion, but is actually a factor taken into account during the pre-selection process.
In the bound estimator, patients having limited geographical availability of providers tend to prefer hospitals with accreditation level A compared to accreditation level B . Nonetheless, they often choose hospital with accreditation level C compared to level A
. Interestingly, patients with a larger choice set, tend to put more weight on the quality of hospitals, such that they more often choose higher quality care hospitals compared to lower quality care hospitals.
Contrary to the Mixed Logit results, we found with the bound estimator that patients tend to prefer private for-profit hospitals compared to private not-for-profit hospitals.Footnote15 Note that we also identify strong unobserved heterogeneity in patient preferences regarding the type of hospital. Finally, the degree of specialization as well as Waiting times
are also playing an important role in patient preferences and were also found to determine patient referrals.
Predictions of patient referral versus patient choice with complete information
Based on the parameter estimates from the Mixed Logit and the Bound Estimator, we conducted two sets of predictions (). As stated before, the Mixed Logit model is miss-specified to identify patient preferences in the presence of a pre-selection process, but still allows patient referrals to be predicted.
Table 3. Expected distribution of hospital characteristics, based on the predicted probabilities of patient referral and predicted patient choice.
In a second set of predictions, we predicted the choice that patients would have made, based on their individual preferences only, if they had the opportunity to select their preferred provider directly from the full choice set (i.e. optimal patient choice with complete information). This was done by predicting the probabilities of patient choice based on the parameters from the Bound Estimator, which is assumed to identify patient preferences. It can be seen in that if patients had the opportunity to select any provider, the patient – hospital distance would increase from 26 km to 45 km, the share of patients treated in the highest accreditation level hospitals would increase by 23% points (pp), and the share of patients treated in private hospitals would increase by 8 pp, while the share in private not-for-profit hospitals would decrease by 12 pp.
V. Discussion
In this study, we investigate the extent to which patients are actively choosing their provider for breast cancer surgery, and investigate patient preferences, considering that choice sets are in fact unobserved. Descriptively, patients seem to have the opportunity of choosing between several providers within a reasonable distance, however, this is accompanied by an unequal distribution of providers in the country and thus unequal access ( and in Appendix C).
According to a revealed preferences framework, we exploit these variations in patients’ choices to explore the mechanisms underlying the referral process of breast cancer patients. Assuming a fixed and observed choice set, we first estimate a Mixed Logit model in order to identify hospital attributes affecting patient referral. Our results underline that patients were more often referred to a more nearby hospital, to private not-for-profit hospitals compared to private for-profit hospitals, to hospitals more specialized in oncology, and to hospitals with shorter waiting times. Interestingly, patients are not more likely to be referred to hospitals with a higher accreditation level, and are even more likely to be referred to low or moderate accreditation levels when their choice set is constrained by the geographical density of providers around their place of residence. In comparison with studies investigating patient referral for more common surgical procedures, patient referral for breast cancer surgeries seems to attribute more weight to the specialization profile and to hospital type rather than to general quality indicators such as hospital accreditation (Beckert and Kelly Citation2021; Gaynor, Propper, and Seiler Citation2016; Moscelli et al. Citation2016; Victoor et al. Citation2012).
When considering unobserved choice sets by setting an upper and lower bound, our findings substantially differ from those of the Mixed Logit (Yen et al. Citation2017). Our results suggest that the pre-selection process seems to be rather driven by the degree of specialization of hospitals, while patients rely on both rather general quality indicators such as the accreditation level and on the specialization profile of providers. As stated before, the specialization profile might be more directly associated with patient outcomes compared to the accreditation level in the case of breast cancer surgeries (Yen et al. Citation2017). Regarding hospital type, patients are more likely to be channelled to a private not-for-profit hospital compared to a private for-profit hospital when considering the full choice set (i.e. Mixed Logit), while they conditionally prefer private for-profit hospitals compared to private not-for-profit hospitals on their pre-selected choice set (i.e. bound estimator). This opposite result on hospital types depending on the choice set considered demonstrates the importance of considering unobserved choice sets in the referral process. One possible explanation could be that GPs, as agents of health authorities, often tend to pre-select private not-for-profit hospitals compared to private for-profit hospitals, while patients tend to prefer private for-profit during the final stage of the decision process.
Regardless of the disease, the existing literature on the agency problem in the patient referral process is scarce. To the best of our knowledge, only two studies to date have examined unobserved choice sets in the identification of patient preferences, and both investigated the UK health system (Beckert Citation2018; Gaynor, Propper, and Seiler Citation2016). The institutional setting in the UK for patient referral differs in many aspects from the French one. First of all, GPs have to propose at least five alternatives of providers to patients during the referral process, thanks to the 2006 reform in the UK. Gaynor et al exploited the natural experiment given by the 2006 reform and showed that after the reform, patients were treated in higher-quality hospitals than they would have been prior to the reform (Gaynor, Propper, and Seiler Citation2016). Our findings tend to support this notion in the French institutional setting, since our predictions indicate that patients would have chosen a higher-quality hospital if they had the opportunity to select their provider from the full choice set (). Before 2006, choices were also restricted in the UK because GPs had strong incentives to refer patients to hospitals with which the local Primary Care Trust (PCT) had a contract. After the reform, contracts were abolished, but PCTs were given a fixed budget for the cost of care for the local population. In this context, W. Beckert investigated whether GPs internalize these costs and consider the opportunity cost of referring a patient for other patients within the same PCT (Beckert Citation2018). They found that GPs responded to indirect financial incentives in the referral process, which shed light on a potential conflict of interest.
In France, the payment scheme is such that GPs have no financial incentives during the referral process. Our findings extend those from Beckert by providing evidence to suggest that unobserved choice sets are also playing an important role in the French institutional setting, which might suggest that GPs act as imperfect agents for patients even in the absence of financial incentives. GPs might also have non-financial incentives such as their reputation with patients, consultants, and, health administrators, which also lead to a misalignment of incentives.
VI. Conclusion
Identifying factors taken into account by patients when choosing a healthcare provider is a major topic in health economics. For cancer surgeries in particular, patient preferences have major implications for their health, as the outcome of the surgical procedure can vary significantly from one hospital to another. Our findings provide evidence that patients indeed take part in the referral process for cancer care. Patients appear to have the option of choosing between several providers within a reasonable distance from their place of residence, although this is accompanied by an unequal access. In comparison with studies investigating patient referral for more common surgical procedures, patient referral for breast cancer surgeries appears to attribute more weight to the specialization profile and to the hospital type rather than to general quality indicators such as hospital accreditation. Our findings also substantiate the need to take into account the unobservability of patient choice sets in the estimation of their preferences. The pre-selection of alternatives appears to be driven by the degree of specialization of hospitals and their relative distances, while patients rather consider waiting times, hospital quality, specialization profile, and type to make their final choice. Our results indicate heterogeneous preferences according to the exogenous constraint of patient geographical availabilities of providers, which prevents a fraction of patients from choosing hospitals based on their quality.
VII. Limitations
While unobserved choice sets were taken into account in the bound estimator, we could not allow for variation in the pre-selection process according to whether the GP was a family doctor or an independent specialist doctor due to a lack of information regarding the referring physicians. Another potential limitation is that we lacked information on the patient’s room rate for some providers, which could have led to a risk of selection bias in the sample used in this study. Note that the comprehensiveness of the initial data set based on all observations still allowed us to compute the geographical density of providers around the patients’ places of residence and then to restrict our sample to non-missing data. Nevertheless, there is still a risk for a potential issue of selection if the missing patients in the sample have different preferences compared to patients included in the sample. This attrition in the sample could also impact patient choice sets, either in the random coefficient Logit or in the bound estimator. To assess the robustness, we estimated the random coefficient Logit model on the full sample without missing data by excluding the patients’ room rate covariate from the model, which induced the missing values (see Appendix F). While this robustness check does not completely negate the risk of selection bias, it supports the fact that the patient preferences included in our sample () were consistent with those of patients and hospitals in the full sample ( in Appendix F). Lastly, individual characteristics such as socioeconomic status could play a role in the referral of patients for breast cancer care. However, such information was not available at the individual level.
Acknowledgements
This work was supported by the SIRIC LYriCAN (INCa-DGOS-Inserm 12563). The authors are grateful to Sophie Domingues-Montanari for helping with the final editing of the manuscript. This study was conducted in compliance with the MR-005 framework developed by the French data protection authority (Commission Nationale de l’Informatique et des Libertés, CNIL). The data controller’s certificate was approved by the CNIL on September 14, 2018 (N° 2206880 v 0). The authors wish to thank the Agence Technique de l’Information sur l’Hospitalisation (ATIH) for granting access to the PMSI database. The authors are also grateful to Gerald Chapuis for allowing us to use the computation server of the Aix Marseille School of Economics.
Disclosure statement
No potential conflict of interest was reported by the author(s).
Additional information
Funding
Notes
1 Adverse selection is a major topic in health economics and has been investigated in a variety of settings. It is particularly a topic of interest in the literature addressing inconsistencies in choices in health insurance markets, where adverse selection can occur due to information asymmetry when patients have private information about their risk profile that is not accessible to the insurance provider (Geruso and Layton Citation2017, Pardo Citation2019).
2 In some countries (e.g. France), patients can also be referred for specialized care by an independent specialist doctor. In this study, the term GP refers to the doctor who referred the patients to the various hospitals, irrespective of whether they were a family doctor or an independent specialist doctor.
3 In France, hospitals are mandated to get a specific authorization of treatment to be authorized to perform breast cancer surgeries. Since 2007, the French Cancer Institute set a minimum volume threshold of 30 surgeries per year for breast cancer care below which hospitals would not be accredited to provide care for these patients. In a setting of centralization of care, this threshold has recently been increased from 30 to 70 surgeries per year (Official Journal of the French Republic Citation2022).
4 In France, the hospital sector is composed of public, private for-profit, and private not-for-profit hospitals. All hospitals are reimbursed under a Statutory Health Insurance (SHI) through a Diagnosis-Related Group (DRG) system. A study conducted by the DREES showed that public hospitals are mainly funded by SHI (i.e. approximately 80%) compared to direct patient payments and voluntary insurance (Directorate for Research Studies Evaluation and Statistics Citation2022). Public and private not-for-profit hospitals are also eligible for research and teaching grants. In comparison, private for-profit hospitals are funded through the same mechanism as public and private not-for-profit hospitals, except that the share of respective payers differs and the DRG payment rates are lower.
5 Under the current procedure (i.e. V2014), accreditation levels are determined based on a range of indicators such as the evaluation of clinical practices policy, quality & security improvement program, risk management, patient needs, pain management, patient file follow-up, drug management, end of life, infectious risk, complaints, operating room, etc.
6 While the random utility model remains the standard choice model in patient choice studies, other choice model approaches exist in the literature, such as random regret models where individuals are assumed to minimize their regret instead of maximizing their utility (Buckell et al. Citation2022, Paul et al.Citation2018).
7 The length of stay for breast cancer patients has been shown to vary primarily according to the extent of the patient’s illness, such as the tumour stage at diagnosis (Lindqvist et al. Citation2004). It is thus assumed that for a given patient, the length of stay would have been comparable regardless of the hospital chosen for treatment.
8 This restriction excluded 850 patients (i.e. 1.49% of the sample) who were treated in a hospital located more than 160 kilometres from their places of residences. These extreme values for distance may reflect an incorrect postal code in the data, or patients with several places of residence, and were thus excluded from the estimation. The limit of 160 kilometres was chosen based on a visual inspection of the patient – hospital distances distribution fitted on the raw dataset (See appendix B).
9 corresponds to a combination of all alternatives (i.e. hospitals) that forms a possible choice set. If
is the number of alternatives, there is
possible combination of alternatives, and thus
possible choice sets
.
10 Compared to the method of (Lu Citation2022), the alternative method of (Barseghyan et al. Citation2021) achieves a partial identification based only on knowledge of the minimum size of the true choice set. The identification is also based on a finite number of conditional moment inequalities. However, the number of inequalities grows with the cardinal of the full choice set, which can make the evaluation of the moment inequalities more challenging with large full choice sets. Furthermore, a large full choice set relative to the minimum size of the true choice set enlarges the parameters’ region surface, even if the sharp identification region continues to be characterized. Since in our application the full choice set included 232 hospitals and the minimum size of the pre-selected choice sets is likely to be low (i.e. the minimum number of providers pre-selected by the GPs), we favoured the approach of (Lu Citation2022).
11 Note that the patients’ own choices would be part of as long as at least another patient within 15 kilometres chooses the same hospital. The aim of this restriction is to avoid choice-based sampling (e.g. where the patient’s own choice is included in
by definition), which could cause identification failure.
12 The bed occupancy rate can actually exceed 100%, since it is computed for bed in surgery department only. Thus, a rate exceeding 100% indicates that a positive share of patients in surgery have used beds from other departments due to a congestion in the surgery unit.
13 The effect is attenuated such that a Wald test indicates that these patients are less likely to be referred to a hospital highly ranked for its room quality (p < 0.001).
14 Even though the effect is attenuated, a Wald test indicates that patients with a larger choice set are still overall less likely to be treated in hospitals with the highest accreditation level (i.e. accreditation level A) compared to a hospital with accreditation level B (p < 0.001) or accreditation level C or D (p < 0.001).
15 Testing the linear constraint of equality between the coefficient associated to private for-profit and private not-for-profit hospitals indicates that we can reject the null hypothesis of equality of the two coefficients (p < 0.0001).
16 Otherwise, the probability of hospital choice in the lower bound choice set cannot be computed.
References
- Arrow, K. J. 1963. “Uncertainty and the Welfare Economics of Medical Care.” The American Economic Review LIII (5): 851–883. https://doi.org/10.1215/03616878-26-5-851.
- Avdic, D., T. Büyükdurmus, G. Moscelli, A. Pilny, and I. Sriubaite. 2019. “Subjective and Objective Quality Reporting and Choice of Hospital: Evidence from Maternal Care Services in Germany.” Journal of Health Economics 68:102229. https://doi.org/10.1016/j.jhealeco.2019.102229.
- Baker, L. C., M. K. Bundorf, and D. P. Kessler. 2016. “The Effect of Hospital/Physician Integration on Hospital Choice.” Journal of Health Economics 50:1–8. https://doi.org/10.1016/j.jhealeco.2016.08.006.
- Barseghyan, L., M. Coughlin, F. Molinari, and J. C. Teitelbaum. 2021. “Heterogeneous Choice Sets and Preferences.” Econometrica 89 (5): 2015–2048. https://doi.org/10.3982/ECTA17448.
- Beckert, W. 2018. “Choice in the Presence of Experts: The Role of General Practitioners in patients’ Hospital Choice.” Journal of Health Economics 60:98–117. https://doi.org/10.1016/j.jhealeco.2018.06.003.
- Beckert, W., and E. Kelly. 2021. “Divided by Choice? For-Profit Providers, Patient Choice and Mechanisms of Patient Sorting in the English National Health Service.” Health Economics 30 (4): 820–839. https://doi.org/10.1002/hec.4223.
- Boyce-Fappiano, D., I. Bedrosian, Y. Shen, H. Lin, O. Gjyshi, A. Yoder, S. F. Shaitelman, and W. A. Woodward. 2021. “Evaluation of Overall Survival and Barriers to Surgery for Patients with Breast Cancer Treated without Surgery: A National Cancer Database Analysis.” NPJ Breast Cancer 7 (1). https://doi.org/10.1038/s41523-021-00294-w.
- Brosig-Koch, J., H. Hennig-Schmidt, N. Kairies-Schwarz, and D. Wiesens. 2015. “The Effects of Introducing Mixed Payment Systems for Physicians: Experimental Evidence.” Health Economics 26 (2): 243–262. https://doi.org/10.1002/hec.
- Buckell, J., V. Vasavada, S. Wordsworth, D. A. Regier, and M. Quaife. 2022. “Utility maximization versus regret minimization in health choice behavior: Evidence from four datasets.” Health Economics 31 (2): 363–381. https://doi.org/10.1002/hec.4455.
- Choné, P., and C. A. Ma. 2011. “Optimal Health Care Contract Under Physician Agency.” Annals of Economics and Statistics 101 (102): 229–256. https://doi.org/10.2307/41615481.
- Crawford, G. S., R. Griffith, and A. Iaria. 2021. “A Survey of Preference Estimation with Unobserved Choice Set Heterogeneity.” Journal of Econometrics 222 (1): 4–43. https://doi.org/10.1016/j.jeconom.2020.07.024.
- DREES (Directorate for Research Studies Evaluation and Statistics). 2022. Les dépenses de santé en 2021. https://drees.solidarites-sante.gouv.fr/sites/default/files/2023-04/CNS2022MAJ280423.pdf.
- Faber, M., M. Bosch, H. Wollersheim, S. Leatherman, and R. Grol. 2009. “Public Reporting in Health Care: How Do Consumers Use Quality-Of-Care Information? A Systematic Review.” Medical Care 47 (1): 1–8. https://doi.org/10.1097/MLR.0b013e3181808bb5.
- French Cancer Institute. 2013. “Algorithme de sélection des hospitalisations liées à la prise en charge du cancer dans les bases nationales d’activité hospitalière de court séjour “algorithme cancer”.” Ouvrage Collectif Édité Par l’INCa. https://www.e-cancer.fr/content/download/63161/568597/file/Algorithme-cancer-2013-V2.pdf.
- French National Authority for Health. 2018. French Certification Manual. Ht tps://W ww.Has-Sante.Fr/Upload/Docs/Application/Pdf/2014-10/Guide_methodologique_v2014.Pdf. https://www.has-sante.fr/upload/docs/application/pdf/2014-03/manuel_v2010_janvier2014.pdf.
- Garattini, L., A. Nobili, M. Badinella Martini, and P. M. Mannucci. 2023. “The Role of General Practitioners in the EU: Time to Draw Lessons from a Too Wide Range?” Internal and Emergency Medicine 18 (2): 343–346. https://doi.org/10.1007/s11739-023-03205-y.
- Gaynor, M., C. Propper, and S. Seiler. 2016. “Free to Choose? Reform and Demand Response in the English National Health Service.” The American Economic Review 106 (11): 3521–3557. https://doi.org/10.1257/aer.20121532.
- Geruso, M., and T. J. Layton. 2017. “Selection in Health Insurance Markets and Its Policy Remedies.” Journal of Economic Perspectives 31 (4): 23–50. https://doi.org/10.1257/jep.31.4.23.
- Goeree, M. S. 2008. “Supplement to Limited Information and Advertising in the U.S. Personal Computer Industry: B. Miscellaneous.” Econometrica 76 (5): 1–7. https://doi.org/10.3982/ecta4158suppb.
- Gutacker, N., L. Siciliani, G. Moscelli, and H. Gravelle. 2016. “Choice of Hospital: Which Type of Quality Matters?” Journal of Health Economics 50:230–246. https://doi.org/10.1016/j.jhealeco.2016.08.001.
- Huguet, M. 2020. “Centralization of Care in High Volume Hospitals and Inequalities in Access to Care.” Social Science & Medicine 260 (May): 113177. https://doi.org/10.1016/j.socscimed.2020.113177.
- Irvine, A., M. van der Pol, and E. Phimister. 2019. “A Comparison of Professional and Private Time Preferences of General Practitioners.” Social Science & Medicine 222:256–264. https://doi.org/10.1016/j.socscimed.2019.01.014.
- Kozikowski, A., D. Morton-Rias, S. Mauldin, C. Jeffery, K. Kavanaugh, and G. Barnhill. 2022. “Choosing a Provider: What Factors Matter Most to Consumers and Patients?” Journal of Patient Experience 9. https://doi.org/10.1177/23743735221074175.
- Lindqvist, R., T. A. Alvegard, P. E. Jönsson, and M. Stenbeck. 2004. “Hospital Stay Related to TNM-Stage and the Surgical Procedure in Primary Breast Cancer.” Acta oncologica 43 (6): 545–550. https://doi.org/10.1080/02841860410018485.
- Lu, Z. 2022. “Estimating Multinomial Choice Models with Unobserved Choice Sets.” Journal of Econometrics 226 (2): 368–398. https://doi.org/10.1016/j.jeconom.2021.06.004.
- McFadden, D., and K. Train. 2000. “Mixed MNL Models for Discrete Response.” Journal of Applied Econometrics 15 (May): 447–470. https://doi.org/10.1002/1099-1255(200009/10)15:5<447:AID-JAE570>3.0.CO;2-1.
- Mehta, N., S. Rajiv, and K. Srinivasan. 2003. “Price Uncertainty and Consumer Search: A Structural Model of Consideration Set Formation.” Marketing Science 22 (1): 58–84. https://doi.org/10.1287/mksc.22.1.58.12849.
- Moscelli, G., L. Siciliani, N. Gutacker, and H. Gravelle. 2016. “Location, Quality and Choice of Hospital: Evidence from England 2002–2013.” Regional Science and Urban Economics 60:112–124. https://doi.org/10.1016/j.regsciurbeco.2016.07.001.
- Official Journal of the French Republic. 2022. JORF n° 0098 du 27 avril 2022. https://www.legifrance.gouv.fr/jorf/id/JORFTEXT000045668843.
- Pardo, C. 2019. “Health Care Reform, Adverse Selection and Health Insurance Choice.” Journal of Health Economics 67:102221. https://doi.org/10.1016/j.jhealeco.2019.07.001.
- Paul, P., C. Berlin, M. Maessen, and H. Valtonen. 2018. “A comparison of regret-based and utility-based discrete choice modelling – an empirical illustration with hospital bed choice.” Applied Economics 50 (40): 4295–4305. https://doi.org/10.1080/00036846.2018.1444260.
- Pitkänen, V., and I. Linnosmaa. 2021. “Choice, Quality and patients’ Experience: Evidence from a Finnish Physiotherapy Service.” International Journal of Health Economics and Management 21 (2): 229–245. https://doi.org/10.1007/s10754-020-09293-z.
- Victoor, A., D. Delnoij, R. Friele, and J. Rademakers. 2012. “Determinants of Patient Choice of Healthcare Providers: A Scoping Review.” BMC Health Services Research 272 (12). https://doi.org/10.1186/1472-6963-12-272.
- Victoor, A., D. Delnoij, R. Friele, and J. Rademakers. 2016. “Why Patients May Not Exercise Their Choice When Referred for Hospital Care. An Exploratory Study Based on Interviews with Patients.” Health Expectations 19 (3): 667–678. https://doi.org/10.1111/hex.12224.
- Waks, A. G., and E. P. Winer. 2019. “Breast Cancer Treatment: A Review.” JAMA - Journal of the American Medical Association 321 (3): 288–300. https://doi.org/10.1001/jama.2018.19323.
- Yen, T. W. F., L. E. Pezzin, J. Li, R. Sparapani, P. W. Laud, and A. B. Nattinger. 2017. “Effect of Hospital Volume on Processes of Breast Cancer Care: A National Cancer Data Base Study.” Cancer 123 (6): 957–966. https://doi.org/10.1002/cncr.30413.
Appendix A.
Inclusion criteria
The PMSI database records information about all patients treated in a hospital in France, for all diseases or procedures. To identify our population of interest, we first included patients based on the World Health Organization (WHO) International Classification of Disease (ICD-10). The inclusion criteria were having an ICD-10 diagnosis code C50 (i.e., malignant neoplasm of breast). Among these patients, we excluded patients not surgically treated in order to focus our analysis on first-line treatment choices. To do this, we used the complete list of Common Classification of Medical Acts (CCAM) codes published in a report of the French National Cancer Institute corresponding to a surgical act for breast cancer (French Cancer Institute Citation2013).
Appendix B.
Patients–hospitals distribution in the raw dataset
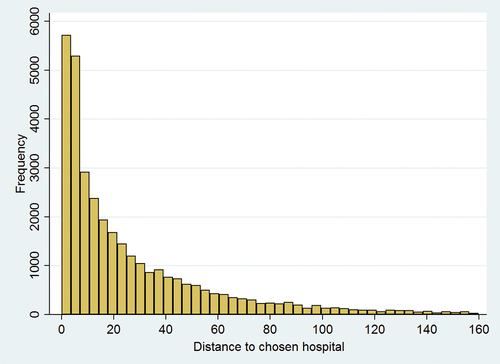
Figure B1. Distance patients – hospitals distribution fitted in the raw dataset, before restricting the sample to hospitals within 160 kilometres of the patients’ places of residence.
Appendix C.
Descriptive statistics
Table C1. Share of patients (%) having at least h hospitals available within a radius of k kilometres.
gives an insight into the number of providers around the patients’ places of residence. Patients seem to have the opportunity to make decisions about their preferred provider among several alternatives within a reasonable distance. Indeed, half (46.8%) of the patients had at least two alternatives within 10 kilometres, and 55.4% had at least 4 alternatives within 30 kilometres. Almost all patients (97.2%) had at least two alternatives within a radius of 50 kilometres.
Figure C1. Cumulative density of patient geographical availabilities of providers.
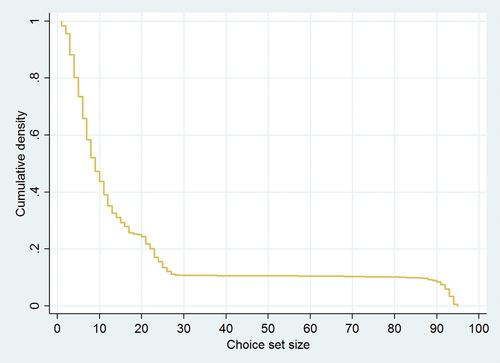
To further illustrate the opportunity of alternatives for breast cancer patients seeking a provider for a surgical procedure, displays the cumulative density of the geographical availability of providers defined as the number of hospitals within 50 kilometres radius. There is an observable wide variation in the geographical availability of providers among patients living in mainland France, which relates to strong inequalities in access to care induced by the allocation of patients and hospitals in the territory. The average number of hospitals available is 18.76 hospitals within 50 kilometres, with a median of 9, a minimum of 1, and a maximum of 95 hospitals in a given area. The plateau in the geographical availability of providers cumulative density is due to the bi-modal distribution of that variable. displays the histogram of the geographical availability of providers, which also highlights the bi-modal distribution.
Figure C2. Histogram of patient geographical availability of providers.
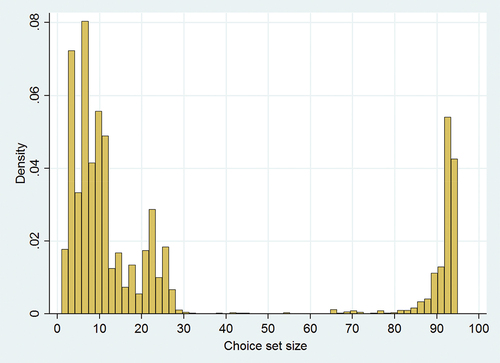
Table C2. Share of patients (%) choosing the ith nearest hospital.
The fact that patients seem to have the opportunity of making a choice, in the sense that more than one hospital is located within a reasonable distance, does not necessarily imply that they would bypass their nearest provider. displays the distribution of patients that chose their nearest provider. Note that only 26.05% of all patients chose to be treated in their nearest hospital. From a descriptive point of view, this thereby demonstrates that patients are making a choice among available providers, since they often bypass their nearest provider. Strikingly, the share of patients choosing their nearest provider varies by patient age, length of stay, and geographical availability of providers. Indeed, the share of patients choosing their nearest provider varied by age from 22.7% for the
quartile (i.e., younger patients) to 30.51% for the
quartile (i.e., older patients). Conversely, the share decreases with the geographical availability of providers quartile, from 35.48% for the
quartile (i.e., lower degree of freedom of choice) to 19.03% for the
quartile (i.e., higher degree of freedom of choice). From a descriptive point of view, this illustrates that older patients tended to be more distance-averse compared to younger patients, and patients who had a higher degree of freedom of choice (i.e., a larger choice set) tended to bypass their nearest hospital more often.
Figure C3. Histogram of the lower bound (i.e. hospitals chosen by other patients living within a radius of 15 kilometres) of the patient choice set size in our identification strategy.
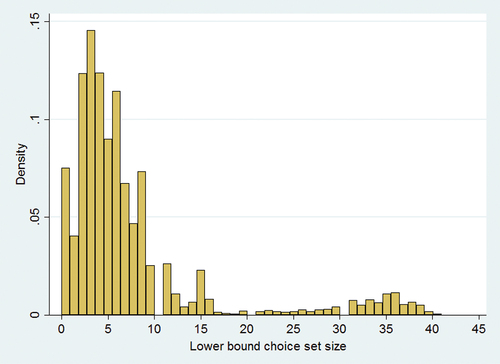
In the econometric specification of the bound estimator, we defined the lower bound of patient choice set as hospitals chosen by other patients living in a radius of 15 kilometres within their places of residence, excluding their own choice. Thus, only patients that have a lower bound choice set including at least two hospitals, and for which their observed choice is included in the lower bound choice set will contribute to the identification of the bound estimator.Footnote16 displays the distribution of the lower bound choice set size. Wide variations in the distribution are present, which relates to either a degree of variability in the density of patients within 15 kilometres of a patient, or variability in the choices made by patients living in the same area. The distribution varied from a minimum of 0 hospitals to a maximum of 41 hospitals, with a median of 5 hospitals included in the lower bound choice set. The rich variations tend to support that the definition of our lower bound is indeed informative to bound the true choice set. Among the 31,101 patients in our sample, 3,486 (11.21%) patients had less than two hospitals in their lower bound choice set. Among patients that had at least two hospitals in their lower bound choice set, 2,655 (8.97%) did not have their observed choice included in the set. Overall, among the 31,101 patients in our sample, 26,680 (86.69%) patients contribute to the identification of the parameters.
When choosing the radius that defines the lower bound, there is a tradeoff between choosing a restrictive radius (i.e., a low radius) that will prevent a fraction of the sample from contributing to the identification, and choosing a rather conservative radius (i.e., a high radius) that will use more patients in the identification of the parameters but that may not be informative in terms of the location of the true choice set within the bounds. This tradeoff is well represented in and below. In , it can be seen that when the radius chosen increased, the share of patients having their hospital chosen excluded from the lower bound choice set decreased. For example, 26.21% of the patients would have their choice excluded from the lower bound with a radius of 5 kilometres, while this share decreased to 16.33% with a radius of 15 kilometres. It can also see in that the slope decreased steeply from 5 to 15 kilometres, while it became less steep after 15 kilometres.
lists the number of hospitals included in the lower bound choice set according to the radius chosen. It can be seen that the median lower bound choice set size was five hospitals with a radius of 15 kilometres, and it clearly increased when the radius increased. Wide variations in the distribution of lower bound choice set sizes are present (i.e., large standard errors), which relates to either a degree of variability in the density of patients, or variability in the choices made by patients living in the same area.
Based on and , we chose a radius of 15 kilometres to define the lower bound choice set, which corresponds to the points where the slope became less steep (), and for which a median of five hospitals were included in the lower bound choice set (). Unfortunately, we could not perform a sensitivity analysis of the bound estimator using different radii because the moment inequality estimator is computationally intensive with large data sets.
Figure C4. Share of patients excluded from the lower bound according to the radius chosen for the lower bound.
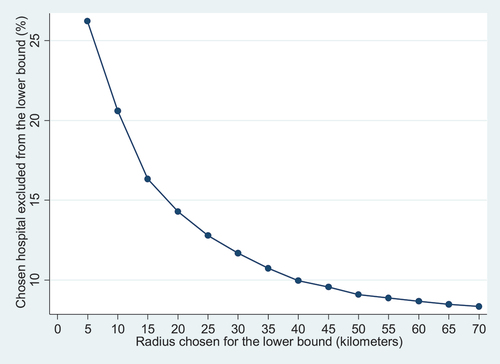
Table C3. Average size of the lower bound choice set according to the radius chosen.
Appendix D.
Comparison of the full sample with the restricted sample
Table D1. Descriptive statistics on hospital attributes in the full sample without missing data (i.e. excluding the parameters for the patients’ room rate) and in the restricted sample.
Appendix E.
Distribution of patients–hospitals distances
Figure E1. Distribution of patients-hospitals distances.
Appendix F.
Benchmark estimation in the full sample without missing data
Table F1. Parameter estimates from the mixed Logit model in the full sample without missing data, thus excluding the parameters on patients’ room rate.
