
 ?Mathematical formulae have been encoded as MathML and are displayed in this HTML version using MathJax in order to improve their display. Uncheck the box to turn MathJax off. This feature requires Javascript. Click on a formula to zoom.
ABSTRACT
In this paper, we explore the effects of historical and contemporary ethnolinguistic diversity on socio-economic development in Afghanistan. Using a dataset of Afghan provinces, we find that historical ethnolinguistic borders are strongly associated with income, provision of public goods, and political preferences in Afghanistan. Pashtun areas exhibit higher levels of income and public goods provision as well as political support for the incumbent. There has been a persistent rule of Pashtun leaders in Afghanistan during the last three centuries. Furthermore, we instrument measures of contemporary ethnolinguistic diversity by the diversity of archaeological sites that belong to different ancient and medieval empires. We argue that higher levels of contemporary diversity are likely to induce lower levels of conflict, higher levels of income and trust, and lower levels of individualism.
I. Introduction
The history of Afghanistan has been hallmarked by the rule of diverse historical empires as well as persistent colonial and imperial interference. These developments constantly changed Afghanistan’s external borders. As it has been evidenced in the comparative development literature, colonial empires have left a long-lasting impact on the countries that remained under their rule for centuries. This is the case for the Habsburg and Ottoman Empires regarding the performance of contemporary institutions in their respective successor states. Institutions in the former Habsburg territories were significantly more efficient than institutions in the former Ottoman Empire territories (Dimitrova-Grajzl Citation2007). Contemporary levels of democracy in colonized countries are also determined by the duration of colonization: countries colonized during the imperialist era after 1850 have a weaker democracy than the countries that were colonized much earlier during the mercantilist era (Olsson Citation2009). The level of financial development in the successor states of the Ottoman Empire is presently low due to the prohibition of interest lending in Islam (Grosjean Citation2011). This is also the case for Africa, whose contemporary underdevelopment is associated with its history of slave trade and colonialism. The high degree of external extraction made the economy transition from a high production equilibrium with secure property rights to a low production equilibrium with insecure property rights (Nunn Citation2007). As the latter remained stable, society remained trapped in suboptimal equilibrium even with the end of the slave trade (Nunn Citation2007).
An experimental study by Kim et al. (Citation2017) reveals that the homogenous population of Korea, which has remained divided into communist North Korea and capitalist South Korea for the last several decades, shows very different characteristics. North Koreans were found to possess a less self-centred approach, whereas Rawlsian, altruistic, and utilitarian types were less common among South Koreans (Kim et al. Citation2017). Such was the case in Poland despite remaining divided among three empires for more than a century. However, these empires left their legacies about religious practices and political preferences via intergenerational transmission (Grosfeld and Zhuravskaya Citation2015).
Past political institutions and past literacy rates determine the level of economic performance through culture (Tabellini Citation2010). Colonial history may also be a determinant of conflict through its impact on ethnolinguistic divisions. The scale of ethnolinguistic polarization based on the experience of English language acquisition across Sri Lankan districts during colonial rule was found to be the most significant determinant of conflict (Dower, Ginsburgh, and Weber Citation2017). This suggests that history matters significantly in understanding segmentations within society (Dower, Ginsburgh, and Weber Citation2017). Historical events may also have long-run effects, such as in the regions of Russia affected by the Holocaust during the Second World War (Acemoglu, Hassan, and Robinson Citation2011). These regions are presently less developed than the rest of the country as the size of the Jewish middle class shrank after this event (Acemoglu, Hassan, and Robinson Citation2011).
Afghanistan is a multilingual and multi-ethnic country at the crossroads of South and Central Asia. Ethnolinguistic diversity is strong in Afghanistan. It is higher in the north and the centre and lower in the south and east. General studies on the linkages between diversity and development indicate that high ethnolinguistic diversity may be linked to poor economic growth, such as low financial development, underdeveloped infrastructure, malfunctioning foreign exchange markets, and low levels of schooling (Easterly and Levine Citation1997). Ethnolinguistically heterogeneous countries also display low quality of government (La Porta et al. Citation1999). When it comes to India, four cross-cultural empirical studies suggest that cultural diversity is compatible with several pan-Indian cultural values such as collectivism, respect for authority, familism, low levels of societal trust, and desire to develop an in-group identity (Abinash and Gupta Citation2004). Shaban and Khan (Citation2023) argue that while cultural diversity and human capital have a positive effect on regional economic growth in India, their interaction produces negative effects; this corroborates the positive role of cultural diversity, as human capital is usually low on average in Indian states. Border changes in Europe after the First World War had no impact on international trade. The most significant reason for low trade was ethnolinguistic differences among European countries (Heinemeyer, Schulze, and Wolf Citation2008). Nevertheless, in the aftermath of the Cold War, US economic policies facilitated unprecedented levels of growth and human development around the globe, particularly in Europe and Japan, oftentimes at the expense of long-run US economic dominance (Ostry Citation2008); ethnolinguistic differences do not appear to matter in that context.
Beugelsdijk and Klasing (Citation2016) argue that diversity in values, which is linked with economic policy, constitutes a key element of societal diversity and produces different socio-economic outcomes. Furthermore, societies that are more diverse in values vis-â-vis income redistribution and government interference in markets have lower levels of trust (Beugelsdijk and Klasing Citation2016). Voicu (Citation2017) draws evidence from the International Social Survey Programme (ISSP) and argues that ethnic diversity is empirically associated with lower support for marriage while having no significance in determining gender roles. Ethnic polarization increases the probability of the occurrence of civil conflict (Montalvo and Reynal-Querol Citation2005). Three indicators of ethnic distribution – fractionalization, polarization, and the Gini-Greenberg index – are significant determinants of conflict (Esteban, Mayoral, and Ray Citation2012).
High levels of ethnic polarization are strongly associated with the duration of civil war (Montalvo and Reynal-Querol Citation2005). Language is a key factor triggering civil conflict, whereas the economic cost of rebellion determines the level of resistance, as was shown in the study on Ukraine by Zhukov (Citation2016). Countries that are linguistically and ethnically more diverse and oil-wealthy have an added probability of experiencing civil unrest. Furthermore, countries that are more democratic and wealthy are at lower risk of violence (Anyanwu Citation2014). However, according to Elbadawi and Sambanis (Citation2000), the level of occurrence of civil conflict in Africa is not explained by ethnic divisions. Instead, civil conflict is an outcome of poor political institutions, poverty, and economic dependence on natural resources (Elbadawi and Sambanis Citation2000). In the case of the Basque country study by Gardeazabal (Citation2011), linguistic polarization and education were found to reduce conflict, whereas political polarization had a dual impact on conflict. Political polarization concerning left-right politics had a positive impact, whereas nationalist polarization had a negative impact, on conflict (Gardeazabal Citation2011). Data from post-communist countries reveals a negative association between conflict and democracy, although this study finds no evidence of any impact of social fractionalization on democracy or civil conflict (Fish and Kroenig Citation2006). Instead, in the case of Bulgaria, diversity may promote institutions and practices for open politics (Fish and Kroenig Citation2006). Between-group inequality is negatively correlated to the provision of public goods in less-established democracies (Baldwin and Huber Citation2010).
According to Jackson (Citation2013), the relationship between diversity and the provision of public goods is subject to the nature of public goods. Demand for culturally-oriented public goods results in their high provision (Jackson Citation2013). Rulers may be inclined to provide culturally-driven public goods to a lesser degree if close substitutes are privately provided to the ruler’s co-religionists and exclude the followers of other religions (Chaudhary and Rubin Citation2016). Grigoriadis (Citation2016) highlights the role of religion in the provision of public goods. Experimental results show that universal discipline played a significant part in the provision of public goods, whereas solidarity and obedience had no such role; free riding occurred at lower levels of hierarchy in Eastern Orthodox society, thus stressing the need to reform the public sector of lower and middle rank (Grigoriadis Citation2017).
This study examines the role of diversity, historical and contemporary, in Afghan socio-economic development. Afghanistan has suffered from civil conflict since 1978, while ethnic cleavages have been the main driver of this conflict. Islam was a mobilizing factor for the Mujahedeen to fight against Soviet forces. The Soviet KGB and the Pakistani ISI during the 1980s nurtured an environment of ethnic conflict among different ethnic groups (Sharma Citation2016). Ethnicity was the main driver of Afghan conflict after the fall of the Communist rule of Najibullah in 1992. Sharma (Citation2016) has underscored the overrepresentation of the Pashtuns in the ruling class, the political mobilization of ethnic and sectarian minorities, and external actors as determinants of ethnic violence in Afghanistan.
We define diversity by utilizing the standard measures of fractionalization and polarization of the economics literature (Montalvo and Reynal-Querol Citation2005; Greenberg Citation1956; Esteban and D. Ray Citation1994; Desmet, Ortuño-Ortín, and Weber Citation2005). We use data from Afghan political-historical geography (Historical and Political Gazetteer: Adamec,Citation1972–1985; National Atlas of the Democratic Republic of Afghanistan: Shah, Górski, and Satar Citation1985), and the census of archaeological sites of Afghanistan (Archaeological Gazetteer: Ball Citation1982) to explain the effects of diversity on contemporary Afghanistan. Methodologically we follow two approaches. First, we use regression discontinuity regressions to explore whether historical ethnolinguistic borders produce persistent outcomes and whether rulers tend to favour their co-ethnic or co-linguistic group. Given that Afghanistan has been ruled by the Pashtuns in the centre for the last three centuries we find that Pashtun rulers have contributed more to the development of the Pashtun areas of the country. Second, we employ an IV approach, where contemporary ethnolinguistic diversity has been instrumented by civilizational diversity. The latter is measured by the share of the archaeological sites belonging to various civilizations and empires during Afghan history. We observe that there is a significant and positive effect of diversity on income and trust, and a negative effect on the support of an incumbent Pashtun leader, perceptions of individualism, and violence or crime.
Our study makes a two-fold contribution. On the one hand, we expand the current state of knowledge on Afghanistan, a country largely absent from the economic literature. The elaborate data collection from the Historical and Political Gazetteer as well as from the Archaeological Gazetteer provides a novel perspective on the role of regional culture and its history towards contemporary Afghan development. On the other hand, we explore the long-run impact of culture on socio-economic outcomes by testing the effect of historical ethnolinguistic borders within the country and by instrumenting contemporary ethnolinguistic diversity with the frequency of archaeological sites of different imperial structures. We find that contemporary diversity has positive and significant developmental effects when driven by the exogenous variation of sites of ancient civilizations.
The study is structured as follows. Section II introduces the concepts of ethnic and linguistic diversity in Afghanistan, while Section III reports the data and empirical strategy. In Section IV, we discuss the results of the regression discontinuity designs and instrumental variables regressions. Section V concludes.
II. Measures of diversity in Afghanistan
Afghanistan is a multiethnic and landlocked country that shares borders with Pakistan to the east, Iran to the southwest, Turkmenistan to the northwest, Uzbekistan to the north, and Tajikistan and China to the northeast. Pashtuns are the largest ethnic group in Afghanistan, while Tajiks are the second largest group, followed by Hazaras, Uzbeks, and Balochis.
Ethnic polarization is considered to be the foundation of civil conflict in Afghanistan. According to Fearon and Laitin (Citation2003), civil war is not a result of ethnic divide. Montalvo and Reynal-Querol (Citation2005), however, suggest that ethnic and linguistic polarization is a major factor in civil unrest. An ethnic culture of violence is transmited to the next generations only if institutional quality is poor (Grosjean Citation2014). Afghanistan was largely devastated during the Soviet invasion. It then faced a severe civil war in the 1990s after the departure of Soviet forces in 1989. Different warlords who had fought against the Soviet Union started to fighting against each other to gain control of the centre. After 9/11 and the Afghan war in 2001, Afghanistan restarted its reconstruction, and new institutions were built. The spread of education and media awareness led to the reduction of Afghan ethnic disintegration and fragmentation. This is the reason why during the Afghan presidential elections, each Afghan ethnic group was divided from within and supported Afghan presidential candidates of different ethnicities (Malikyar Citation2014). As the ethnolinguistic maps in Figures A.1 and A.4 show, most of the areas in the east, southeast, and southwest adjacent to the Pakistan and Iranian borders are inhabited by Pashtuns. Balochis live in small numbers in the south and southwest of Afghanistan. Most of the areas in the northeast, centre, and northwest belong to Tajiks. The Hazara population is mostly located in the west of Afghanistan close to the Iranian border, while the Uzbek population is concentrated in the north next to the Uzbek border.
A total of forty-one languages are spoken in Afghanistan (Simons and Fennig Citation2018). The major languages are Pashto, Dari (Afghan Persian), Uzbek, and Tajik, with Pashto and Dari being Afghanistan’s main languages. As the linguistic map of Afghanistan in Figures A.2 and A.5 as well as the linguistic tree in Figure A.6 show, two major groups of languages are spoken in Afghanistan. The Indo-Iranian group of languages includes Balochi and dialects of Pashto and Persian. Pashto has two dialects, northern Pashto and southern Pashto, whereas Persian has the dialects Dari, Hazaragi, Tajik, and Aimaq. The Turkic languages share no branches with the Indo-Iranian family. The major Turkic languages in Afghanistan are Uzbek and Turkmen. Pashto shares three out of a maximum of six branches with the Persian dialects and Balochi. However, Balochi is closer to Dari as it shares four branches.
Montalvo and Reynal-Querol (Citation2005) introduced a new measure of ethnic diversity that satisfied the properties of polarization:
ELF is fractionalization and is the proportion of people in the total population belonging to ethnic group i and N is the number of groups (Montalvo and Reynal-Querol Citation2005).
RQ is the polarization index. The above formulas can also be used to measure linguistic or religious fractionalization or polarization by replacing the ethnic proportion with the linguistic or religious proportion, respectively:
Presented by Greenberg (Citation1956), this index considers the linguistic distance between any two groups:
Esteban and D. Ray (Citation1994) introduced an index that takes linguistic distance into account while measuring linguistic polarization. If the linguistic distance is the same across all groups, then the ER index and the above RQ index of polarization are perfectly correlated.
The index of Klaus Desmet, Ignacio Ortuño-Ortín, and Shlomo Weber (Citation2005) considers the distance between central and peripheral groups.
III. Data and methodology
Data
This study uses both historical and contemporary data. Historical data on the ethnolinguistic distribution of various regions of Afghanistan have been taken from the Historical and Political Gazetteer of Afghanistan (Adamec Citation1972–1985). The Gazetteer was originally printed for secret official purposes during the late 19th and early 20th century and edited by Ludwig W. Adamec. This gazetteer has six volumes that correspond to six different regions of Afghanistan and it includes the former official gazetteer compiled in 1914 with the addition of new maps and developments up to the 1970s. The six regions defined in the six volumes of the gazetteer are the following. The Northeastern region adjacent to the border of Kashmir, China, and Tajikistan contains mainly the provinces of Badakhshan and Baglan; the Northern region attached to the Uzbek border includes the provinces of Balkh, Bamiyan, and Samangan; the Northwestern region shares a border with Iran and consists of Herat and the surrounding areas. The Southwestern region shares a border with Iran and the Pakistani province of Baluchistan and includes the Helmand and Farah provinces; the Southeastern region along with a border with Pakistan includes the province of Kandahar; and the Central region includes the capital Kabul and ten surrounding provinces of Afghanistan. The historical ethnolinguistic borders used for the regression discontinuity design have been extracted from the Historical and Political Gazetteer of Afghanistan.Footnote1
Details of archaeological sites in Afghanistan are taken from the Archaeological Gazetteer of Afghanistan, which was published in 1982. The gazetteer has information on 1286 archaeological sites in Afghanistan (Ball Citation1982). These sites cover the period from the Palaeolithic epoch to the Safavid dynasty. It includes details of palaces, shrines, religious cemeteries, monasteries, mosques, roadside inns, statues, old bridges, towers, and places of sherds and coins. The archaeological sites are of a ceramic, architectural, numismatic, lithic, epigraphic, or stylistic nature, and they are facing various threats. Apart from natural deterioration, these sites have been at risk due to civil conflict, looting, and Taliban attacks.Footnote2
This study uses a microdata set called ‘Survey of the Afghan People’, which was collected every year from 2006 to 2017 by the Asia Foundation (Mulakala and Hongbo Citation2017). Over the 12 years, more than 97 thousand people were surveyed. This unique data set covers various socio-economic and political issues.
Table A.1. shows the descriptive statistics of the variables used for the RD and IV estimations. Regarding contemporary data, twelve waves of the Asian Foundation Survey were used and several variables are available in multiple waves. All the variables have been aggregated at the province level. A large majority of the people are reluctant to trust others and a majority believe that most people are self-centred. The variable of violence or crime depicts the law and order situation in Afghanistan. About one-fifth of the respondents think that their families have faced some kind of violence or crime. Measures of diversity have been provided at the provincial level by using the formulas discussed in Section II of this paper. Ethnolinguistic fractionalization and polarization measured at the provincial level reveal a very high standard deviation. As illustrated in Table A.2, almost eighty percent of the Afghan population is either Pashtun or Tajik. Just over six percent are Uzbeks, whereas the share of Hazaras is ten percent. The remaining four percent of the population is divided into several ethnic minority groups. Almost half of the Afghans speak Dari as their first language. Roughly thirty nine percent speak Pashto, whereas the Uzbek language is spoken by ten percent of the people as their mother tongue.
Regression discontinuity design
Discontinuity can be defined as an observation near any threshold or cut-off, the continuity of which is discontinued at the point of the threshold. This threshold may be a policy intervention, selection criteria, or a geographic/administrative border. The idea behind introducing discontinuity in the regression framework is to remove selection bias that may arise due to the observations that are very much homogeneous in characteristics, but they lie on either side of the threshold, and they are divided into treatment and control groups.
The regression discontinuity design (RDD) divides the geographic area into treatment and control zones based on geographic, administrative, or ethnolinguistic borders (Keele and Titiunik Citation2015), if people living close to the geographic border on either side are more or less similar in characteristics. Applying regular non-experimental methods may lead to the problem of selection bias, whereas RDD with its very few assumptions appears to be more efficient as an econometric approach (Keele and Titiunik Citation2015). This method was previously used by Dell (Citation2010) to estimate the persistent impact of MITA (forced mining labour system that remained enacted in Peru and Bolivia from the 16th to the 19th century) boundaries on household consumption and stunted growth.
Utilizing the geographic RDD approach, we propose the following equation:
where is the contemporary outcome variable such as income both in aggregate and logarithmic terms, violence or crime, trust, individualism, political preferences, electricity provision, and access to safe drinking water,
is the set of covariates, and Distancei is the distance of each provincial capital from the respective ethnolinguistic border. Historical ethnic borders are drawn based on the Historical and Political Gazetteer of Afghanistan (Adamec Citation1972–1985) and linguistic borders are drawn based on the linguistic map of the National Atlas of the Democratic Republic of Afghanistan (Shah, Górski, and Satar Citation1985). RDD enables us to explore the possibility of significant jumps across the internal ethnolinguistic borders of the country. Distancei, therefore, denotes the distance of any provincial capital from the designated ethnolinguistic borders.Footnote3
This study uses a sharp geographic RD design, which divides the data into treatment and non-treatment groups at the cut-off. We have estimated the regression discontinuity with bias-corrected coefficients and robust standard errors as proposed by Calonico Sebastian, Matias D. Cattaneo, and Rocio Titiunik (Citation2014, Citation2015, Citation2017).
Instrumental variables (IV) estimation
To instrument measures of contemporary diversity, we utilize the index of civilizational diversity and the ratio of the number of archaeological sites belonging to different ancient and medieval empires as our instruments. IV regressions are widely used to overcome the problem of endogeneity. An endogeneity problem arises when any regressor correlates with the error term, which violates the assumption of exogeneity and leads to biased estimators (Wooldridge Citation2008). Simultaneity due to reverse causation, any omitted variable correlating with both the dependent and the independent variable, and measurement error in the independent variable are the three sources of the endogeneity problem (Johnston Citation1972). Two-stage least squares (2SLS) and the generalized method of moments (GMM) are the two most common methods that are used to obtain unbiased estimators in the presence of an endogeneity problem.
First & second stage
where is the outcome variable, is the measure of ethnolinguistic diversity,
, is the set of instrumental variables related to ancient and medieval empires and their civilizations, and Xit is the set of covariates. Moreover:
where vi is the cross-section or province-specific error component and wit is the combined cross-section and time series error component. Measures of ethnolinguistic diversity used in this paper have been treated as endogenous variables. According to the study of Ahlerup and Olsson (Citation2012), countries with a longer history of human settlement and where geographical conditions force people to live in isolation from other groups are ethnolinguistically more diverse. According to Michalopoulos (Citation2012), land quality and elevation are the most significant geographic factors of ethnolinguistic diversity. We find a strong correlation between ethnolinguistic diversity and civilizational diversity; all our instruments are observed to be statistically significant and positively linked with ethnolinguistic diversity. Moreover, archaeological diversity also satisfies the exclusion restriction as it is likely to be uncorrelated with the unobserved determinants of contemporary outcomes. We use three types of IV estimators: the between-effects (BE) estimator, the random-effects (RE) estimator, and the generalized-method-of-moments (GMM) estimator. The BE estimator captures panel averages and assumes that there is no unobserved heterogeneity between individual observations, while the RE estimator combines the properties of the between-effects and fixed-effects estimators. The IV GMM estimator is more efficient in terms of causal inference than the BE or RE estimators because it allows for more robust instruments and a stronger exclusion restriction under overidentifying conditions.
IV. Results
Pairwise correlations
It is important to keep in mind that our analysis and empirical observations are within the boundaries of the Afghan political and economic context. The pairwise correlation results are reported in Table A.3. Provinces on the border of Pakistan/former British India have significantly less freedom of expression, less access to electricity, and face significantly more violence and crime.Footnote4 These areas are highly homogenous and less polarized. Provinces on the border of Iran have less access to safe drinking water, while provinces on the border of the former Soviet Union are highly ethnolinguistically diverse and polarized and have less access to safe drinking water. People in these border areas have higher levels of interpersonal trust and have a strong perception that the people in their area are generally not self-centred. Moreover, people in the border areas with the former Soviet Union have more freedom of expression than people in the rest of Afghanistan. The law and order situation there is also significantly better.
Pashtuns appear to be wealthier, but they live under higher levels of violence or crime. General trust and freedom of expression are low among Pashtun people. Dari speakers are overall positive towards democracy and freedom of expression while enjoying better law and order conditions than Pashtuns. Tajiks experience less access to safe drinking water than Pashtuns, but, similarly to Dari speakers, they enjoy more freedom of expression and are more educated.
Measures of diversity are negatively correlated with access to safe drinking water and positively correlated with the provision of electricity. Interestingly, linguistically fractionalized, and polarized areas in Afghanistan have lower levels of violence or crime. There is a significantly high correlation between historical ethnic fractionalization and polarization from a reduced sample derived from the Gazetteer data on the one hand, and contemporary ethnic fractionalization and polarization on the other hand.
Regression discontinuities
The regression discontinuity (RD) results are reported in four different ways. First, they are estimated without covariates at the optimal bandwidth based on the MSERD criterion.Footnote5 Second, they are reported without covariates at a bandwidth of 100 kilometres. Third, with covariates at the optimal MSERD-based bandwidth. Fourth, with covariates at a bandwidth of 100 kilometres. According to the MSERD criterion, there are different bandwidths selected for each equation, generally from eight to fifty kilometres, given that many of the provincial capitals were very close to ethnolinguistic borders. A bandwidth of one hundred kilometres has been selected as a robustness check.
Pashto speakers vs. non-Pashto speakers
Since Afghanistan has been ruled exclusively by Pashto-speaking leaders for the last three centuries Pashto speakers are expected to have an advantage over other language groups. As and indicate, Pashto speakers earn significantly more than other language groups. The mean income difference between Pashto speakers and non-Pashto speakers is 2857 Afghanis and it is significant at the 1-percent level with both a bias-corrected and a robust confidence interval. When we increase the bandwidth to one hundred kilometres or include such covariates as the level of education and violence or crime, the results remain similar both in terms of magnitude and statistical significance. The results of average monthly income do not change when we compute the natural logarithm of income (lny).
Figure 1. RD plots for Pashto speakers vs. non-Pashto speakers. Bandwidth: MSERD.
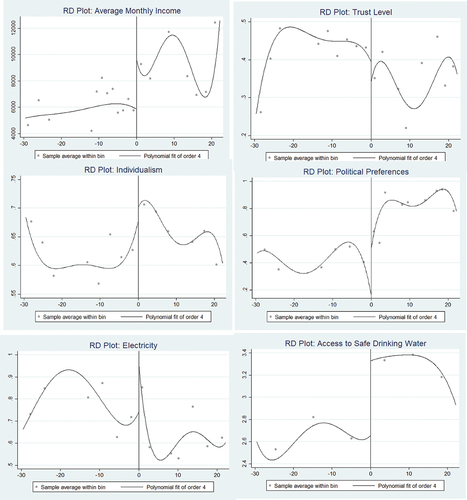
Table 1. RD results with robust bias-corrected CIs: Pashto Speakers vs. non-Pashto Speakers.
The Pashto-speaking areas exhibit significantly higher levels of socio-economic development in Afghanistan. The uninterrupted rule of Afghanistan by Pashtun leaders since Ahmad Shah Durani established the Durani Empire in 1747 is the reason why ethnic Tajiks, despite being the second largest ethnic group, and Dari speakers, despite being the largest linguistic group, earn significantly less than the Pashtuns. This is also evident in Figure A.20, where most Southeastern areas are wealthier. This area is the Pashtun belt of Afghanistan. Moreover, Pashto speakers appear to have more access to safe drinking water and the provision of electricity. These results are corroborated by all three methods with conventional, bias-corrected, and robust confidence intervals and at bandwidths based on the MSERD criterion and 100 kilometres with and without covariates.
The mean difference in the share of support in favour of Ashraf Ghani, the current president of Afghanistan, in the Pashto-speaking areas is 0.277 (27.7 percentage points) with an MSERD-based bandwidth and 0.287 (28.7 percentage points) at a bandwidth of 100 kilometres; the results are robust to the inclusion of covariates. All four coefficients have been estimated with bias-corrected and robust CIs and they are statistically significant (). When it comes to violence or crime, the mean difference in favour of the Pashto-speaking areas is 3.9 percentage points and this is significant at the 10-percent level with a conventional CI. The inclusion of such covariates as the level of income, education, and freedom of expression increases the mean difference in the Pashto-speaking areas, which is now statistically significant at the 5-percent level both with a bias-corrected and a robust CI (panel C of ).
Pashto speakers have experienced more violence or crime than other language groups due to the imperial legacies and foreign involvement in Afghanistan; these results are also supported by Figure A.21, which shows that most provinces with a Pashto-speaking majority experience more conflict. The RD results reported for Pashto speakers are aligned with those for ethnic Pashtuns (Table A.4 and Figure A.17), particularly when we add covariates and a bandwidth of 100 km into our estimations (panel D of Table A.4).
Ethnic Tajiks vs. non-ethnic Tajiks
Although Tajiks are the second largest ethnic group in Afghanistan, they earn significantly less than other ethnicities. Using 100 kilometres as a bandwidth, the mean income difference between Tajiks and non-Tajik areas of Afghanistan is −5362.30 Afghanis, significant at the 1-percent level with bias-corrected and robust CIs. This finding is also confirmed when the outcome is lny (see also ). Moreover, the Tajiks lack access to the provision of basic public goods such as safe drinking water and electricity. Access to safe drinking water is lower by a mean difference of −1.745 scale points, which is statistically significant at the 5-percent level with a robust CI (Panel C of ). Furthermore, there is no straightforward evidence of Tajiks being overall individualist, as it has been shown by the covariate-adjusted models (Panels C and D of ). As the map in Figure A.23 shows, respondents in the centre, centre-west, and centre-east of the country have stronger perceptions of individualism. Support for Ashraf Ghani in the 2014 presidential elections was the lowest in the Tajik areas as the Tajiks voted for the Tajik candidate Abdullah Abdullah. The mean difference in the support for a Pashtun leader is −0.883 percentage points without covariates and −0.882 percentage points with income, education, and violence or crime as covariates. Both differences are statistically significant with bias-corrected and robust CIs. This is clear evidence that Afghan society is strongly divided along ethnic lines in terms of political preferences. Afghanistan’s present president, Ashraf Ghani, won the second round of the 2014 presidential election with the narrowest of margins after both leaders failed to gain a simple majority in the first round. Our RD results suggest that Afghanistan’s people voted for ethnicity and there is a strong historical ethnolinguistic border effect.
Figure 2. RD plots for ethnic Tajiks vs. non-ethnic Tajiks. BW: MSERD.
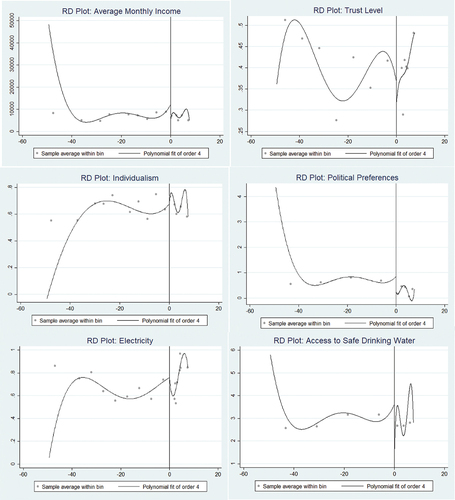
Table 2. RD results with robust bias-corrected CIs: Ethnic Tajiks vs. non-ethnic Tajiks.
Uzbek speakers vs. non-Uzbek speakers
Uzbeks are the third largest language and ethnic group in Afghanistan. In Table A.5 and Figure A.18, at a bandwidth of 100 kilometres, Uzbek speakers have higher levels of income and endure lower levels of violence or crime. These findings are significant at the 1-percent level with bias-corrected CIs. Moreover, trust is significantly lower among Uzbek speakers.
Dari speakers vs. non-Dari speakers
Dari is spoken by ethnic Tajik, Hazara, and Aimaq people. Dari speakers represent the largest language group in Afghanistan. Their average income level, however, is less than that of other language groups in Afghanistan, with a mean difference of −2974.70 Afghanis, significant at the 1-percent level. As the map in Figure A.20 indicates, most areas adjacent to the former Soviet Union, have higher levels of trust. RD results show that there is some evidence that Dari speakers exhibit higher levels of trust while having less access to basic public goods such as safe drinking water and electricity provision (see Table A.6 and Figure A.19).
Instrumental variables (IV) approach
Different equations are estimated using different techniques of instrumental variable methods: BE 2SLS, RE 2SLS, and IV GMM. In each equation, measures of diversity are instrumented by using the index of civilizational diversity and the ratios of the number of archaeological sites belonging to Old Persian, Greek, East Iranian, Islamic Persian, and Turkic civilizations. First-stage regression results given at the bottom of each table of the IV Estimation suggest that all the instruments are significantly associated with measures of diversity. Moreover, the validity of our instruments is confirmed by the reported Hansen J tests, which are presented at the bottom of each IV estimation; this is the case for violence or crime, trust, individualism, and political preferences. However, this is not the case for income as an outcome variable. Other predetermined/exogenous variables, such as lagged income level, violence or crime, and education, are also used as covariates (see Tables A.7-A.11 in the Appendix). Due to Afghanistan’s radical exposure to military conflict in the last four decades, we also control for province-level violence or crime.
Income
The IV estimation results (Table A.7) suggest that diversity is a positive determinant of income level. Ethnically or linguistically diverse provinces exhibit higher levels of income than provinces with a lower level of diversity. As demonstrated in Table A.7 ethnic fractionalization induces a higher level of income at the 10-percent level in the BE model. Moreover, ethnic polarization is a positive and significant determinant of income according to BE 2SLS, RE 2SLS, and IV GMM models. Education is also a positive and significant determinant of income at the provincial level in Afghanistan, as evidenced by the results reported in Table A.7.
Violence or crime
Diversity is negatively associated with the scale of violence or crime (Table A.8). Ethnic fractionalization causes a lower level of violence or crime (RE 2SLS model). Diversity measured by ethnic polarization exhibits a significant and negative effect on violence or crime and this finding is consistent in all three models (BE 2SLS, RE 2SLS, and IV GMM). Higher income is associated with higher levels of violence or crime, while more freedom of expression predicts a lower level of violence or crime in all three models as well.
Political preferences
The IV estimation results given in Table A.9 provide strong evidence that the popularity of the Pashtun leader Ashraf Ghani declines significantly with an increase in the level of diversity at the province level. This finding of an inverse relationship between the level of support for Ghani in the 2014 presidential elections and the level of diversity is consistent with all reported diversity indices (ethnic and linguistic fractionalization, ethnic and linguistic polarization, ELF distance, and RQ distance). More diverse provinces with a higher proportion of Tajiks, Uzbeks, and Hazaras are more inclined towards a non-Pashtun leader. There is strong evidence that provinces with a higher level of education exhibit lower levels of support for Ashraf Ghani, whereas wealthier provinces exhibit higher support for the same candidate.
Trust
Figure A.22 reports higher levels of trust in the northern and several of the eastern provinces of the country. There is strong evidence that diversity in the form of standard linguistic fractionalization as well as linguistic fractionalization with linguistic distance (ELF distance) has a positive impact on trust in Afghanistan. Provinces with a higher share of Uzbek and Turkmen populations exhibit have higher linguistic distance, because both Uzbek and Turkmen belong to the Turkic language group, whereas other major languages spoken in Afghanistan such as Dari belong to the Indo-European language group (Table A.10). This suggests that empire-instrumented diversity in the form of linguistic fractionalization (with and without ELF distance) gives rise to contracting across language groups, which in return bolsters trust and institutional development. The results are robust across the three tested models (BE 2SLS, RE 2SLS, and IV GMM).
Individualism
The positive role of individualism in development has been widely discussed in the economic literature (Gorodnichenko and Roland Citation2017; Kyriacou Citation2016). Individualism as an outcome in the Asia Foundation survey captures the perception of respondents about whether people in most instances care about themselves or try to help others. We observe that when current diversity is instrumented by civilizational diversity it has a negative impact on perceptions of individualism (Table A.11). Measures of ethnic fractionalization and polarization are found to be statistically significant in five of the reported six models. Income is positively associated with individualism, while the opposite is observed for crime or violence as a covariate. Long-run diversity may, therefore, promote collective coordination among different ethnic or language groups towards community building.
V. Conclusions
In this study, we propose that the positive impact of diversity on development relates to the role of historical diversity both in terms of historical ethnolinguistic borders as well as in terms of civilizational diversity, which captures the imprint of the different ancient and medieval empires that were dominant in Afghanistan. Using RD regressions, we have shown the long-run political dominance of Pashtuns in modern-day Afghanistan, which has also resulted in their increased wealth; Pashtuns are not only wealthier than the other Afghan ethnic or language groups, but they also have better access to basic public goods, such as electricity and safe drinking water. Hence, historical ethnolinguistic borders appear to be persistent. This result is corroborated also by IV regressions. Afghan voters tend to vote for presidential candidates along ethnic lines. Diversity at the province level contributes positively to Afghan society by reducing individualism and violence or crime and by bolstering income and trust. This is due to ancient civilizational diversity being a powerful instrument for contemporary ethnolinguistic diversity. Provinces where different ancient civilizations or empires left their imprint exhibit higher levels of socio-economic development.
Supplemental Material
Download Zip (9.6 MB)Data availability statement
The data that support the findings of this study are available from the corresponding author upon reasonable request.
Disclosure statement
No potential conflict of interest was reported by the author(s).
Supplementary material
Supplemental data for this article can be accessed online at https://doi.org/10.1080/00036846.2023.2298213
Additional information
Funding
Notes
1 A detailed discussion on Afghanistan’s ancient civilizations can be found in the Appendix. For a visualization of baseline ethnic and linguistic data on Afghanistan, see Figures A.1-A.7. We map different measures of ethnolinguistic fractionalization and polarization in Figures A.8-A.10.
2 Visualizations of civilizational diversity are provided in Figures A.11-A.16.
3 10 mm on the map equal 100 km on the ground.
4 Freedom of expression is also an indicator reported by Asia Foundation and denotes the perception of freedom of expression by the survey respondents at the province level, as this is mentioned in Table A.1 (Appendix). Approximately half of the Afghanistan’s population believe that they do not enjoy freedom of expression; this is particularly the case for provinces such as Nuristan.
5 Mean Square Error Regression Discontinuity (MSERD) is a criterion used for the bandwidth selection in the regression discontinuity framework. The use of optimum bandwidth based on the MSERD criterion make the robust bias-corrected estimators valid (Calonico et al. Citation2019, Citation2020).
References
- Abinash, P., and R. K. Gupta. 2004. “Mapping Cultural Diversity within India: A Meta-Analysis of Some Recent Studies.” Global Business Review 5 (1): 27–49. https://doi.org/10.1177/097215090400500103.
- Acemoglu, D., T. A. Hassan, and J. A. Robinson. 2011. “Social Structure and Development: A Legacy of the Holocaust in Russia.” The Quarterly Journal of Economics 126 (2): 895–946. https://doi.org/10.1093/qje/qjr018.
- Adamec, L. W., Edited by. 1972–1985. Historical and Political Gazetteer of Afghanistan (Vol.1-Vol.6). Graz: Akademische Druck- u. Verlagsanstalt.
- Ahlerup, P., and O. Olsson. 2012. “The Roots of Ethnic Diversity.” Journal of Economic Growth 17 (2): 71–102. https://doi.org/10.1007/s10887-011-9075-0.
- Anyanwu, J. C. 2014. “Oil Wealth, Ethno-Religious-Linguistic Fractionalization and Civil Wars in Africa: Cross-Country Evidence.” African Development Review 26 (2): 209–236. https://doi.org/10.1111/1467-8268.12077.
- Baldwin, K., and J. D. Huber. 2010. “Economic versus Cultural Differences: Forms of Ethnic Diversity and Public Goods Provision.” American Political Science Review 104 (4): 644–662. https://doi.org/10.1017/S0003055410000419.
- Ball, W. 1982. “Archaeological Gazetteer of Afghanistan. Archaeological Gazetteer of Afghanistan = Catalogue Des Sites Archéologiques D’afghanistan.”
- Beugelsdijk, S. and M. J. Klasing, 2016. Diversity and trust: The role of shared values. Journal of Comparative Economics, 44 (3), pp.522–540. https://doi.org/10.1016/j.jce.2015.10.014.
- Calonico, S., M. D. Cattaneo, and M. H. Farrell. 2020. “Optimal Bandwidth Choice for Robust Bias-Corrected Inference in Regression Discontinuity Designs.” The Econometrics Journal 23 (2): 192–210.
- Calonico, S., M. D. Cattaneo, M. H. Farrell, and R. Titiunik. 2019. “Regression Discontinuity Designs Using Covariates.” Review of Economics and Statistics 101 (3): 442–451. https://doi.org/10.1162/rest_a_00760.
- Calonico, S., M. Cattaneo, M. H. Farrell, and R. Titiunik. 2017. “Rdrobust: Software for Regression-Discontinuity Designs.” Stata Journal 17 (2): 372–404. https://doi.org/10.1177/1536867X1701700208.
- Calonico, S., M. D. Cattaneo, and R. Titiunik. 2014. “Robust Nonparametric Confidence Intervals for Regression-Discontinuity Designs.” Econometrica 82 (6): 2295–2326. https://doi.org/10.3982/ECTA11757.
- Calonico, S., M. D. Cattaneo, and R. Titiunik. 2015. “Optimal Data-Driven Regression Discontinuity Plots.” Journal of the American Statistical Association 110 (512): 1753–1769. https://doi.org/10.1080/01621459.2015.1017578.
- Chaudhary, L., and J. Rubin. 2016. “Religious Identity and the Provision of Public Goods: Evidence from the Indian Princely States.” Journal of Comparative Economics 44 (3): 461–483. https://doi.org/10.1016/j.jce.2016.05.001.
- Dell, M. 2010. “The Persistent Effects of Peru’s Mining Mita.” Econometrica 78 (6): 1863–1903.
- Desmet, K., I. Ortuño-Ortín, and S. Weber. 2005. Peripheral Diversity and Redistribution. SSRN Scholarly Paper. Id 760664. Rochester, NY: Social Science Research Network.
- Dimitrova-Grajzl, V. 2007. “The Great Divide Revisited: Ottoman and Habsburg Legacies on Transition.” Kyklos 60 (4): 539–558. https://doi.org/10.1111/j.1467-6435.2007.00384.x.
- Dower, P.C., Ginsburgh, V. and S. Weber. 2017. Colonial legacy, polarization and linguistic disenfranchisement: The case of the Sri Lankan War. Journal of Development Economics, 127,pp.440–448. https://doi.org/10.1016/j.jdeveco.2016.12.006.
- Easterly, W., and R. Levine. 1997. “Africa’s Growth Tragedy: Policies and Ethnic Divisions.” The Quarterly Journal of Economics 112 (4): 1203–1250. https://doi.org/10.1162/003355300555466.
- Elbadawi, E., and N. Sambanis. 2000. “Why are There so Many Civil Wars in Africa? Understanding and Preventing Violent Conflict.” Journal of African Economics 9 (3): 244–269. https://doi.org/10.1093/jae/9.3.244.
- Esteban, J., L. Mayoral, and D. Ray. 2012. “Ethnicity and Conflict: An Empirical Study.” American Economic Review 102 (4): 1310–1342. https://doi.org/10.1257/aer.102.4.1310.
- Esteban, J., and D. Ray. 1994. “On the Measurement of Polarization.” Econometrica 62 (4): 819–851. https://doi.org/10.2307/2951734.
- Fearon, J. D., and D. D. Laitin. 2003. “Ethnicity, Insurgency, and Civil War.” American Political Science Review 97 (1): 75–90. https://doi.org/10.1017/S0003055403000534.
- Fish, M. S., and M. Kroenig. 2006. “Diversity, Conflict and Democracy: Some Evidence from Eurasia and East Europe.” Democratization 13 (5): 828–842. https://doi.org/10.1080/13510340601010735.
- Gardeazabal, J. 2011. “Linguistic Polarization and Conflict in the Basque Country.” Public Choice 149 (3–4): 405–425. https://doi.org/10.1007/s11127-011-9869-9.
- Gorodnichenko, Y., and G. Roland. 2017. “Culture, Institutions, and the Wealth of Nations.” Review of Economics and Statistics 99 (3): 402–416. https://doi.org/10.1162/REST_a_00599.
- Greenberg, J. H. 1956. “The Measurement of Linguistic Diversity.” Language 32 (1): 109–115. https://doi.org/10.2307/410659.
- Grigoriadis, Theocharis. “Religion, administration & public goods: Experimental evidence from Russia.” Economic Modelling 66 (2017): 42-60.
- Grosfeld, I., and E. Zhuravskaya. 2015. “Cultural Vs. Economic Legacies of Empires: Evidence from the Partition of Poland.” Journal of Comparative Economics 43 (1): 55–75. https://doi.org/10.1016/j.jce.2014.11.004.
- Grosjean, P. 2011. “The Institutional Legacy of the Ottoman Empire: Islamic Rule and Financial Development in South Eastern Europe.” Journal of Comparative Economics 39 (1): 1–16. https://doi.org/10.1016/j.jce.2010.05.003.
- Grosjean, P. 2014. “A History of Violence: The Culture of Honor and Homicide in the Us South.” Journal of the European Economic Association 12 (5): 1285–1316. https://doi.org/10.1111/jeea.12096.
- Heinemeyer, H.-C., M.-S. Schulze, and N. Wolf. 2008. Endogenous Borders? the Effects of New Borders on Trade in Central Europe 1885-1933. SSRN Working Paper. Id 1104972. Rochester, NY: Social Science Research Network.
- Jackson, K. 2013. “Diversity and the Distribution of Public Goods in Sub-Saharan Africa.” Journal of African Economies 22 (3): 437–462. https://doi.org/10.1093/jae/ejt002.
- Johnston, J. 1972. Econometric Methods. 2nd ed. New York: McGraw Hill Higher Education.
- Keele, L. J., and R. Titiunik. 2015. “Geographic Boundaries as Regression Discontinuities.” Political Analysis 23 (1): 127–155. https://doi.org/10.1093/pan/mpu014.
- Kim, B.-Y., S. Choi, J. Lee, S. Lee, and K. Choi. 2017. “Do Institutions Affect Social Preferences? Evidence from Divided Korea.” Journal of Comparative Economics 45 (4): 865–888. https://doi.org/10.1016/j.jce.2016.08.004.
- Kyriacou, A. P. 2016. “Individualism–Collectivism, Governance, and Economic Development.” European Journal of Political Economy 42:91–104. https://doi.org/10.1016/j.ejpoleco.2015.11.005.
- Malikyar, H. 2014. ‘Afghanistan Elections: The Myth and Reality about Ethnic Divides’. Al Jazeera English, Media Outlet.
- Michalopoulos, S. 2012. “The Origins of Ethnolinguistic Diversity.” American Economic Review 102 (4): 1508–1539. https://doi.org/10.1257/aer.102.4.1508.
- Montalvo, J. G., and M. Reynal-Querol. 2005. “Ethnic Polarization, Potential Conflict, and Civil Wars.” American Economic Review 95 (3): 796–816. https://doi.org/10.1257/0002828054201468.
- Mulakala, A., and J. Hongbo. 2017 ‘Afghanistan in 2017: A Survey of the Afghan People’. Asia Foundation. Accessed 11 May 2020. https://asiafoundation.org/publication/afghanistan-2017-survey-afghan-people/.
- Nunn, N. 2007. “Historical Legacies: A Model Linking Africa’s past to Its Current Underdevelopment.” Journal of Development Economics 83 (1): 157–175. https://doi.org/10.1016/j.jdeveco.2005.12.003.
- Olsson, O. 2009. “On the Democratic Legacy of Colonialism.” Journal of Comparative Economics 37 (4): 534–551. https://doi.org/10.1016/j.jce.2009.08.004.
- Ostry, S. 2008. The post-Cold War Trading System: Who’s on First? Chicago: University of Chicago Press.
- Porta, L., F. L.-D.-S. Rafael, A. Shleifer, and R. Vishny. 1999. “The Quality of Government.” Journal of Law, Economics and Organization 15 (1): 222–279. https://doi.org/10.1093/jleo/15.1.222.
- Shaban, A., and S. Khan. 2023. “Cultural Diversity, Human Capital, and Regional Economic Growth in India.” Regional Science Policy & Practice 15 (5): 973–991. https://doi.org/10.1111/rsp3.12528.
- Shah, M. M., H. Górski, and A. Satar. “Przedsiębiorstwo Eksportu Geodezji I Kartografii GEOKART, Afganistan, & Idārah-I’umūmī-I Jiyūdīzī Va Kārtūgrāfī. (1985).” National Atlas of the Democratic Republic of Afghanistan.
- Sharma, R. 2016. Nation, Ethnicity and the Conflict in Afghanistan| Political Islam and the Rise of Ethno-Politics 1992-96. 1st ed. New York: Imprint Routledge.
- Simons, G. F., and C. D. Fennig. 2018. “Ethnologue: Languages of Afghanistan.” In Ethnologue: Languages of the World, 42. Dallas, Texas: SIL International.
- Tabellini, G. 2010. “Culture and Institutions: Economic Development in the Regions of Europe.” Journal of the European Economic Association 8 (4): 677–716. https://doi.org/10.1111/j.1542-4774.2010.tb00537.x.
- Voicu, M. 2017. “Diversity and Family: An Inquiry into the Effects of Ethnic, Linguistic, and Religious Fractionalization on Family Values.” Ethnic and Racial Studies 40 (14): 2501–2519. https://doi.org/10.1080/01419870.2016.1250936.
- Wooldridge, J. M. 2008. Introductory Econometrics: A Modern Approach. 4th ed. Mason, OH: South Western Cengage Learning.
- Zhukov, Y. M. 2016. “Trading Hard Hats for Combat Helmets: The Economics of Rebellion in Eastern Ukraine.” Journal of Comparative Economics 44 (1): 1–15. https://doi.org/10.1016/j.jce.2015.10.010.