
 ?Mathematical formulae have been encoded as MathML and are displayed in this HTML version using MathJax in order to improve their display. Uncheck the box to turn MathJax off. This feature requires Javascript. Click on a formula to zoom.
ABSTRACT
Using the Armenian Household Survey data for 2004–2018 this study explores the causal effect of family benefits, the country’s main poverty targeted program, on multidimensional and monetary poverty. We find that only 40% of the total fund of this targeted program reaches the severe multidimensional poor households. Our regression estimation based on bias-corrected dynamic panel data models reveals that an increase in the proportion of households receiving family benefits mostly results in a decrease in the incidence of severe multidimensional poverty. However, it has no significant effect on moderately poor households and those who are vulnerable to poverty. This program significantly benefits only those households who are poor in terms of their health expenditure. We further observe that the impact of these benefits is significant on extreme monetary poor but the effect is inconclusive on those who live below the national upper poverty line. Our findings suggest that in the current development stage of the country the targeted poverty programs should focus on enhancing capabilities and human capital development. Also, to address the social assistance coverage gap, the government needs to enhance incentive mechanisms for the main actors in the social protection system.
I. Introduction
Poverty reduction is universally recognized as an important aspect of economic and social development. The capacity of social protection to reduce poverty has been critical for developing economies and bolstering social cohesion (Barrientos and Hulme Citation2009). New forms of social assistance introduced in the last decade reach more than 150 million poor households in developing countries. However, according to the International Labour Organization (ILO Citation2020), only 46.9% of the global population was effectively covered by at least one social protection benefit (excluding healthcare and sickness benefits). The social protection coverage rate is characterized by significant inequalities across and within regions (ILO Citation2022).
Compared with advanced economies, social protection in developing countries is grounded on a widely shared understanding that poverty is multidimensional and persistent in time and across generations (Addison, Hulme, and Kanbur Citation2009). In this study, we analyse the effectiveness of the main national pro-poor targeted program – family benefits (FBs) – on multidimensional and monetary poverty, using the Armenian Household Survey datasets (HSDs) for 2004–2018. We follow the claims that when studying the interlinkages between social transfers (including FBs) and poverty one should consider poverty as a multidimensional problem (Kakwani and Silber Citation2008).
Armenia represents an interesting case for analysing the effectiveness of poverty targeted programs in the Eastern Europe and Central Asia (ECA) region. The Armenian government has implemented a major reform in targeted social transfer programs in 2011. Despite continuous efforts by the government, both monetary and multidimensional poverty rates in the country remain among the highest in the region. According to UNICEF (Citation2020), around one-fourth of the total population and one-third of children in Armenia live in monetary poverty. Moreover, around one-third of the population, who were successful in getting rid of monetary poverty during 2010–2015, fell back into the poverty trap. The most significant contributors to the multidimensional deprivation at the country level are sanitation, school attendance and nutrition (OPHI Citation2022). Armenia experiences declining fertility rates, ageing of the population, and sequential waves of emigration, making the country highly sensitive to the effectiveness of social protection policies.
We use the capability approach (Anand et al. Citation2021; Sen Citation1999) to account for household-level determinants of multidimensional poverty. Similar to Maldonado and Nieuwenhuis (Citation2015), we claim that the context in which individuals have opportunities for doing (functionings) is influenced by the welfare state. The welfare state theory underlines the importance of the state’s role in protecting and promoting citizens’ wellbeing (Korpi Citation2000) and preparing households to become economically independent (Morel, Touzet, and Zemmour Citation2018). To identify monetary poor households, we use national poverty lines.
This article contributes to the existing literature in two ways. Firstly, the available research concentrates on exploring the effectiveness of various pro-poor spending programs on monetary poverty. Since poverty is not confined to money metrics alone, we examine the efficiency of targeted welfare programs from multidimensional poverty (MDP) and monetary poverty perspectives. While MDP analysis is being widely used in academic studies analysing poverty (Burchi et al. Citation2022; Pham, Mukhopadhaya, and Vu Citation2020), its application in measuring the effects of social protection programs remains understudied (Barrientos and DeJong Citation2006; Kilburn et al. Citation2020). Our study focuses on the post-reform outcomes and provides insights into policy improvement directions.
Secondly, the literature on the effectiveness of poverty targeted programs in developing economies mainly covers Latin America, Africa and South and Southeast Asia. Our study is the first to explore the issue of a post-soviet economy. An examination of poverty targeted programs in such economies is important since they carry out a heavy heritage from a centrally planned economy in designing and implementing public programs.
The article is organized as follows. A brief note of the global evidence of social protection policies and their impact on poverty is provided in Section II. Poverty targeting and the programs in Armenia are discussed in Section III. The method is discussed in Section IV. Data is analysed in Section V. The regression results and robustness checks are presented in Section VI. Section VII concludes.
II. Social protection policies and poverty: global evidence
Social protection interventions are documented to be powerful instruments to address household poverty, inequality, food insecurity, and child schooling outcomes (Carter and Barrett Citation2006; Woolard and Leibbrandt Citation2013). In developed countries, family benefits have a significant effect on monetary poverty reduction (Maldonado and Nieuwenhuis Citation2015; Misra, Moller, and Budig Citation2007). Kangas and Palme (Citation2000) claim that family-related poverty is lowest in countries with social protection interventions, whereby cash benefits are combined with public childcare services. This enables parents to be active in the labour market. Evidence from South Africa shows that social protection in the face of child benefits contributes to non-monetary poverty reduction, such as improved child nutrition and food security of households (Coetzee Citation2013); lower risk of mental health disorders (Plagerson et al. Citation2011); and improved school attendance among adolescents (Adato, Devereux, and Sabates-Wheeler Citation2016).
Despite the extant evidence on social transfers’ positive impact on several individual aspects of wellbeing (Barrientos and DeJong Citation2006; Kilburn et al. Citation2020; Yu and Li Citation2021), the effects of social protection interventions on multidimensional poverty remain understudied. Among the few studies that analyse the impact of interventions on multidimensional outcomes, Kilburn et al. (Citation2020) use a multidimensional poverty framework to assess the effects of conditional cash transfer intervention for young girls in South Africa. The authors find that social protection interventions increase empowerment by affecting their independence, relationships, and mental and emotional health. Barrientos and DeJong (Citation2006) find that overall, cash transfers positively impact childhood poverty across different settings (Sub-Saharan Africa, Latin America, and transition economies). Evidence from higher-income countries in the EU shows considerable effects of cash transfers on household-level material deprivation (Notten and Guio Citation2016). Furthermore, the literature provides evidence of the positive impact of targeted programs on income poverty reduction inter‐generationally. This effect is captured by improved schemes to guarantee a minimum income (Sainsbury and Morissens Citation2002) as well as human capital development of children (Baird et al. Citation2014). The targeted programs are considered particularly important to protect households from poverty in cases where they are ineligible for social insurance benefits or if these transfers do not fully cover their needs (Behrendt Citation2000). The evidence claims that targeted programs, when coupled with support planning, investment, and business development programs offered by implementers, have better effects (Bastagli et al. Citation2019).
III. Poverty targeting
In the social policy literature, the discussion on the role of social protection is mainly built on two central principles – targeting and universalism (Ferrarini, Nelson, and Palme Citation2016). Targeting is about concentrating on poor people as the core beneficiaries of social programs, while the universal principle considers eligibility for such programs without looking at family income.
Poverty targeted programs can directly outperform universal programs, as they are exclusively designed to meet the needs of the poor (Lavallée et al. Citation2010). In practice, however, targeted programs may turn into an inefficient policy due to high exclusion and inclusion errors (Smolensky et al. Citation1995). Exclusion errors occur when the targeted poor are excluded from the program. Inclusion errors, on the other hand, occur when program participants are not initially targeted (they are not poor) while they directly benefit from the program. Means testing identifies the poor using income or consumption measurement as an eligibility criterion. The alternative approach is proxy means testing, a composite measure bringing together indicators that capture a household’s wellbeing. Lavallée et al. (Citation2010) characterize these measurements as follows: (i) they should be correlated with households’ poverty, (ii) they can be easily measured and observed (iii) they are hard for households to manipulate. In fact, proxy means testing has a multidimensional approach, and program participants identified by this method are multidimensionally poor. The downside of the proxy means testing is that it does not fully account for incentives to encourage participation of the poor and discourage non-participation of the non-poor. Also, it requires trained personnel to calculate scores for identifying the poor, and households are easily confused with the methodology.
Poverty targeting in Armenia: programs and trends
Social protection expenditures relative to GDP remain low in Armenia in comparison to countries in the ECA region (UNICEF Citation2020). As of 2019 the government’s total spending on social protection (excluding health care) is around 28% of the state budget. The share of this expenditure as a percentage of GDP is about 6–7%. Social assistance programs comprise both targeted and universal benefits, and the programs are typically multi-tiered. In , all programs besides poverty targeted Family Living Standards Enhancement Benefits (FLSEB) are universal social programs.
Table 1. State social assistance programs in Armenia.
Families with children under 18 are eligible for the FBs program. In 2014, the Social benefit (SB) program was introduced for vulnerable families without children. Family and Social benefits are regular proxy means tested, non-contributory cash transfers, which are considered as both protective and preventive instruments for reducing chronic poverty and household deprivation.Footnote1 In Armenia, the Ministry of Labour and Social Affairs (MoLSA) is the primary public institution mandated to oversee the social protection sector and is responsible for relevant policy making. In a recent joint report by the MoLSA, World Bank and UNICEF, it was acknowledged that the social protection system in the country lacks a comprehensive, in-depth analysis and an overall performance evaluation (UNICEF Citation2020).
In , we plot the FBs’ volumes and their percentage shares in social expenditures for the period 2008–2018.Footnote2 In this data and throughout our study, SBs are incorporated in FBs, which can explain the 9.4% jump in allocated FBs in 2015 when SBs were introduced. The volumes of FBs steadily increase, with the exception of the year 2010 (−3.0%). On average, the annual growth of FBs is 5.2%. The growing volumes of FBs signify the high value of the program in the menu of social protection schemes. On the other hand, the decreasing percentage of FBs in the social expenditures is a result of expanding and introducing new programs of both contributory and non-contributory nature, but not directly targeted to the poor.
Figure 1. Family benefits, social and budget expenditures in billions AMD, 2008–2018.
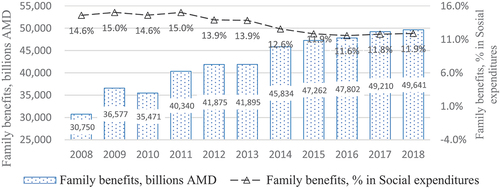
Major reforms in the social protection system related to FBs occurred in late 2011. Amendments were carried out in two directions: (i) revision of the family vulnerability assessment procedures and (ii) improved administration.Footnote3 These modifications aimed at including low-income families, especially those having children, in the eligibility pool for FB. Within the revision of the family vulnerability assessment, the main changes were in the structure of the average monthly income of households and in the formula for calculating the income coefficient. In the meantime, pensions were increased, and the score for eligibility for FB was decreased to 30.00 in 2012 (as compared to 35.00 set in 2004). The lump-sum allowance was also amended. The amendment implied that the average monthly FB equaled AMD 29,350 (USD72.42) starting in 2012, as compared to AMD 26,850 (USD71.35) in 2011. The revised formula for calculating income coefficient led to the gross average monthly income entitling to FB being doubled as compared to 2011. As a result, for instance, a pensioner is eligible for FB if receiving a pension equal to AMD 27,300 (USD 67.37) as compared to AMD 13,650 (USD 36.27) in 2011.
IV. Methodology
Multidimensional poverty measures
Monetary poverty measures associate a money-valued observable space to an unobservable welfare space, with the idea that it is possible to identify a level of income or monetary resources corresponding to a minimum acceptable welfare level. However, the level of welfare may not be guaranteed by income (Sen Citation1993). In our article we refer to the definition of ‘poor’ as outlined by Alkire et al. (Citation2015), which incorporates several dimensions of deprivation, such as in education, health, physical safety, housing and social security. We use the Dual Cut-offs approach (as proposed by Alkire and Foster Citation2011) to measure MDP in Armenia.Footnote4 Despite criticisms for its limitations (Alkire and Santos Citation2010; Silber Citation2011), this method inspired several empirical studies (Burchi et al. Citation2022; Pham, Mukhopadhaya, and Vu Citation2020). We explain the method in Appendix 1.
Choice of dimensions/indicators and weight
Many scholars have advocated for the combination of monetary and non-monetary components, claiming that it enables better measurement and understanding of poverty (Martinez et al. Citation2016; Ntsalaze and Ikhide Citation2018). Income-related dimensions are often used to proxy functionings (Kuklys Citation2005), while living standard indicators are perceived as means rather than ends; they are not direct measures of functionings (Alkire and Santos Citation2010). Our study includes four dimensions of poverty: education, health, living standards and self-reported poverty, which are chosen based on a hybrid of alternative sources suggested by Alkire (Citation2007). We choose normative weights for the dimensions and indicators for our multidimensional poverty measure (see Decancq and Lugo Citation2013). Each dimension is given an equal weight. Within a dimension, indicators are given equal weights. lists the dimensions, indicators, their deprivation cut-offs and weights.
Table 2. Dimensions and indicators.
Dimensions and indicators
Education. We have two indicators for education, adult literacy, and child pre-school attendance. A household is deprived of adult literacy if any household adult member has less than low secondary education, which is eight years of school education. In Armenia, the heritage of an established and close-to-mandatory secondary educational system from the Soviet time stipulates quite a lower likelihood that an adult citizen has less than a low secondary education. Still, in 2018 around 15% of households are deprived in this indicator.
Health
In our study, a household is deprived in the health dimension if health expenditures exceed 50% of non-food expenses. That is, we link the measurement of the health dimension to the financial capability of the household to afford health services. Due to the lack of direct outcome information on health we opted for this affordability indicator following Boardman (Citation1991).Footnote5 The self-reported health outcome indicator is included in the self-reported poverty dimension together with other self-reported indicators. In this way we consider both affordability and outcome of health in our multidimensional poverty computation. More than 10% of households were deprived in health dimension in 2018.
Living Standard
We have three indicators under this dimension: the state of the dwelling, the location of the water tap, and the water source. Dwelling conditions were found important at the time of the earthquake in 1988 and during the massive immigration from Azerbaijan due to the early phase of the Nagorno-Karabakh conflict (1991–1994). In 2018, more than 21% of households in our sample were deprived in this indicator. Water conditions capture the infrastructure development that has a high regional variation.
Self-reported poverty
Self-reported states can reflect opportunities as proxies of potential functionings and capabilities (Alkire et al. Citation2015). We include three indicators to capture self-reported poverty to enrich the multidimensional nature of our measurements. In 2018, around 9% of cases, at least one household member reported that her/his family was poor. In the same year, the proportion of households with self-reported poverty in dwelling and health were 21.5% and 23.2%, respectively.
Empirical strategy
Our model identification strategy has shared properties with that of Phan et al. (Citation2017). We take FBs into the model with a one-year lag to ensure that the allocated transfers in terms of population proportions are exogenous. Poverty targeted transfers are allocated based on the current poverty incidence and, therefore, correlated with a current poverty level. To control for the potential causality from poverty incidence to the transfer payment, we include FBs in the model with a one-year lag. That means that one year is the considered time for translating changes in the transfer payment coverage into changes in poverty measures. We also control for the source of endogeneity related to the time-persistence of a poverty measure by including the lagged dependent variable in the model (Banerjee and Duflo Citation2003).
We estimate the model as a dynamic panel, wherein the cross section is an administrative unit (a province), and the time unit is a year. The empirical model is
Province level controls are humanitarian aid, GDP per capita and the industry structure (agriculture-manufacture ratio). Humanitarian aid is represented in terms of the percentage of population, constructed from the household survey data. We control for humanitarian aid as the omission of this may lead to a biased coefficient of the FBs.Footnote6 The development stage of the country with province-level variation is controlled by GDP per capita. We also include the agriculture-manufacture ratio to control for poverty differences owing to the industry structure.
In dynamic or autoregressive panel models, the presence of unobserved heterogeneity in cross-sections is effectively controlled by (one-way) fixed effects. Nickell (Citation1981) shows that the least-squares dummy variable (LSDV) results in a biased coefficient of the lagged dependent variable, which is not mitigated with the increase of cross sections. Anderson and Hsiao (Citation1982), Arellano and Bond (Citation1991) and Blundell and Bond (Citation1998) suggest estimators using instrumental variables (IV) in the framework of the generalized method of moments (GMM). These estimators are consistent when while the bias can be very large for small
In our case, the number of cross sections is very small, which makes the use of instrument based GMM (IV-GMM) methods ineffective.
In the literature, a bias-correction of LSDV with strictly exogenous regressors is considered as an alternative approach. Nickell (Citation1981) derives the bias formula, Kiviet (Citation1995) uses higher-order asymptotic expansion to approximate sample bias. Bruno (Citation2005a) develops an LSDV bias-corrected (LSDVC) estimator, extended to unbalanced panels with a strictly exogenous selection rule. Bruno (Citation2005b) computes the LSDVC estimator. The performance of LSDVC is evaluated in comparison to LSDV, Anderson and Hsiao (Citation1982), Arellano and Bond (Citation1991) and Blundell and Bond (Citation1998) estimators for a small N (10 and 20 units) using Monte Carlo simulations. The results provide strong support for LSDVC.
Bias correction by Kiviet (Citation1995) and the estimator developed by Bruno (Citation2005a) do not account for heteroscedasticity and any form of correlation. Everaert and Pozzi (Citation2007) address the issue by using a bootstrap-based bias correction procedure. They do not derive analytical expression for the bias of the fixed effect (FE) estimator, instead, it is numerically evaluated using bootstrap resampling. De Vos et al. (Citation2015) execute a bootstrap-based bias corrected FE (BCFE) estimator, based on Everaert and Pozzi (Citation2007). The authors conduct Monte Carlo simulations showing that BCFE is virtually unbiased for the sample sizes under consideration. Also, they show that the BCFE estimator outperforms the difference and system GMM estimators, in terms of both bias and inference, in samples with small to a moderate number of time series observations (). Also, BCFE is not sensitive to the nonnormality of the errors and conditional heteroscedasticity.
Regarding the error term ( in EquationEquation 1
(1)
(1) ), De Vos et al. (Citation2015) make the following assumptions:
Assumption (2) states that the error terms are uncorrelated, both within and over cross-sections. The dynamic structure of the model decreases the probability of serial correlation. Assumptions (3) and (4) allow for heteroscedasticity forms, such as general form (, cross sectional (
, =
or temporal (
, =
.
We estimate the model in (1) by LSDV, LSDVC and BCFE, using censored headcount ratio (the proportion of poor households for a specified poverty and deprivation cut-offs) and adjusted headcount ratio (the measure of MDP reflecting both the incidence and intensity of poverty) as dependent variables. We estimate three models: (i) households that are only vulnerable to MDP (with the poverty cut-off k = 1/5); (ii) households that are moderately multidimensionally poor (k = 1/3); (iii) households that are in severe MDP (k = 1/2).Footnote7 We additionally estimate the model for the monetary poor using national poverty lines, upper-level and extreme, to find the variation of empirical results from multidimensional and monetary poverty models.
For LSDVC models, Arellano-Bond estimation is used to initialize the bias correction. Bootstrap estimation with 100 repetitions is used for calculating the variance-covariance matrix and standard errors. Bias correction is up to order O(1/NT). For BCFE models, the number of bootstrap samples is also set to 100. Estimation results are not sensitive to the number of bootstrap samples (repetitions). We report the root mean square error (RMSE), within- and overall R2 measures as model fit criteria. In our case, RMSEs are the lowest in LSDVC models and the largest in the BCFE models.Footnote8 High values of within R2 suggest that the specifications successfully capture within-province variation.
V. Data description
We construct administrative unit (province) level measurements from the Armenian HSDs for the period 2004–2018. We did not include the years 2019 and 2020 for a number of reasons. Firstly, during COVID-19 time, the data collection method was changed from face-to face to telephonic interviews. This impacts the quality of the data and consequently affects our empirical estimation. Secondly, the COVID-19 related social assistance had critically changed the nature and the distribution of social program impacts on households vulnerable to poverty. Moreover, 2019–2020 is the early period of economic consequences of institutional transformation followed by the Velvet-revolution in Armenia in 2018.Footnote9 And finally, the war in Nagorno-Karabakh in 2020 has largely affected both the landscape and allocation of social expenditures, further perturbing the long-term trends and relationships between variables of interest.
The capital city Yerevan is considered as one of the 11 administrative units. The panel data enables to capture the within province variation and thereby assesses the efficiency of the main targeted program in the country from the regional development perspective. The Armenian HSDs are province-representative. The number of households in an annual sample is in the range of 5000–6000. Province level measurements are used to obtain 165 ( = 11 provinces × 15 years) observations for our panel data models.
Poverty measures
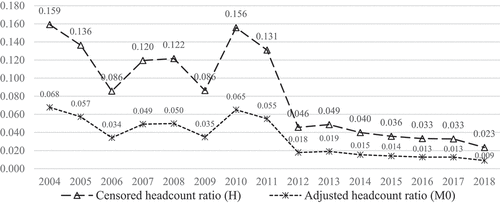
We plot the country level censored headcount ratio (H) and adjusted headcount ratio (M0) for the period 2004–2018 in . The MDP indexes are estimated for . The extent of poverty decreased in the 2004–2009 period, while there was a jump in 2010, responding to the first wave of the global financial crisis (GFC) that started in 2008. A continual decrease is observed throughout 2010–2018, suggesting that the country has successfully combated MDP since 2010.
Figure 2. Country level MDP indexes for k=1/3.
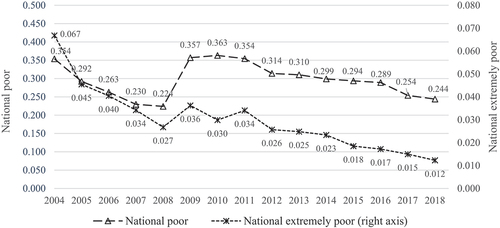
Monetary cut-offs of national poverty lines change annually to account for price changes in consumption baskets. In 2018, the monetary poor are defined as those whose consumption per adult equivalent is below the national upper poverty line, AMD 42,621 (USD88.2) per month; the moderate poor are defined as those whose consumption per adult equivalent is below the national lower poverty line, AMD 35,071 (USD72.6) per month; whereas the extreme poor or the undernourished are defined as those whose consumption per adult equivalent is below the extreme poverty line, AMD 24,827 (USD51.4) per month. plots the dynamics of national upper and extreme poverty from 2004–20018. In line with evidence from other countries (von Maltzahn and Durrheim Citation2008; Waglé Citation2008), we note that the monetary poverty trend is similar to that of the MDP. Decreases in monetary poverty rates were somewhat accelerated in 2012, but it is hard to mark them as structural shifts.
Figure 3. National poverty lines.
Poverty targeted transfers
As displayed in , emergency assistance is one of the poverty-targeted programs. In the datasets, there are years for which emergency assistance is not reported. Moreover, this form of benefit covers a very small percentage of households (in the range of 0.15–0.2%). In this study, we drop emergency assistance and consider FBs (together with SBs) as the main poverty targeted program.
In , we plot the proportions of households receiving FBs. There are increasing and decreasing phases. The lowest proportion of households with FBs was observed in 2011, in the late phase of GFC. While GFC resulted in a dramatic jump in monetary poverty in 2009 and of MDP in 2010, fewer households received FBs in these years, which can be explained by the limited financial resources in times of crisis that the Armenian government could redistribute to the poor (). However, a further decline in the proportions of households receiving FBs in 2011 cannot be explained by the reduction in FBs’ volumes but rather by the increase in FB amount per recipient.
Figure 4. Proportions of households receiving family benefits.
Matching family benefits to multidimensional poverty status
Proxy means testing criteria used for the provision of FBs in Armenia are different from the indicators and dimensions used in our MDP measures. Therefore, we cannot make a precise assessment of exclusion and inclusion errors by exploring correspondence between receiving FBs and MDP status. Still, such an analysis can help make judgements on the efficiency of allocating FBs from the MDP perspective and detect structural changes, if any.
plots the fraction of multidimensionally deprived households receiving FBs each year. We identify households as multidimensionally poor by EquationEquation (A1)(A1)
(A1) , Appendix 1. Further, we calculate the fraction of households whose deprivation lies in a particular interval. The intervals are based on poverty thresholds used in our study, 1/5, 1/3 and 1/2. In the figure, we report the corresponding percentages of households receiving FBs for each interval. For example, in 2004, 21.8% of poor households for
but not severely deprived (
) received FBs. From the perspective of our MDP measure efficient targeting would cover a high percentage of households experiencing severe MDP. If resources were still left, they should have been directed to the next MDP category (1/3 < k < 1/2), and so forth.
Figure 5. Percentages of multidimensionally deprived receiving family benefits.
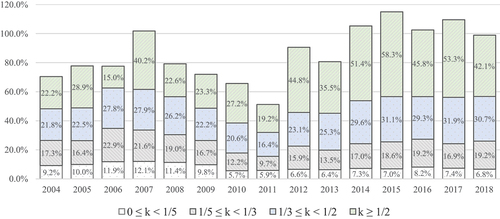
While the proportions of the coverage are larger for each upper MDP category, we observe a substantial provision of benefits for lower poverty categories too. For example, in 2018, those households that are not in severe MDP are more likely to receive benefits (56.7%) as compared with households experiencing severe poverty (42.1%). These findings signal both high inclusion and exclusion errors. Exclusion errors somewhat decrease after 2012, since we have larger coverage for households in severe MDP. However, the proportions of households in lower MDP categories receiving FBs remain high (inclusion errors).
VI. Regression results
Prior to the regression analysis we provide specification tests for model selection from fixed effect, random effect and pooled OLS. The choice of fixed- over random effect model is validated by the Hausman test. The null hypothesis that models should be estimated by random effect is rejected for all specifications. In Appendix 2 , along with the Hausman test, we report F-test (Chow test) for province specific intercepts versus a common intercept, as well as Pesaran (Citation2004) test for random effect models.Footnote10 F-test results show that the fixed effect is preferred to the pooled OLS. The fixed-effect approach is used for our model specifications based on these specification tests.
In , we report regression results for the censored headcount ratio. In all specifications, the coefficient of the lagged dependent variable is significant. The LSDV coefficient of the lagged dependent variable falls below from those in the LSDVC and BCFE models. For , the LSDV estimate of the persistence parameter is 0.274, by which the censored headcount ratio is explained by its previous-year value. The corresponding LSDVC and BCFE estimates are 0.361 and 0.418. The coefficients decrease in
, suggesting that severe forms of MDP are less persistent and hence more responsive to exogenous factors and policy instruments. Similar coefficients are obtained from the regression models with the adjusted headcount ratio, with slightly less magnitudes ().
Table 3. Regression results for censored headcount ratio.
Table 4. Regression results for adjusted headcount ratio (M0).
According to the LSDV model with the censored headcount ratio (Column 1, ), a one-percentage point increase in the fraction of households receiving benefits results in 0.049% point decrease in the next year’s MDP incidence. The effect is significant at the 5% level. The effect magnitudes in LSDVC and BCFE models are close to that in LSDVC but differ in significance. The LSDVC coefficient is significant at the 10% level, while the BCFE coefficient fails to be significant at any conventional level. The corresponding coefficients in M0 models () are smaller in absolute values (in the range 0.26–0.28), but significant in all three models. Still, we observe the lowest (5%) significance in the BCFE model.
FBs are not significant in models with smaller poverty cut-offs. For k = 1/3, the coefficient magnitudes in the censored headcount ratio models are larger than those for k = 1/2, but not significant. A similar pattern is observed in regression results for the adjusted headcount ratio. Finally, both magnitudes and significance are very low in estimated models for k = 1/5.
Regarding the control variables, humanitarian aid enters the LSDV model for both censored and adjusted headcount ratios with high magnitude and significance. However, the significance is not preserved in LSDVC and BCFE models. Auxiliary regressions without humanitarian aid indicate that the confounding effect of humanitarian aid on FBs is not substantial. GDP per capita is significant in models for k = 1/3, indicating that a one-percent GDP per-capita growth decreases the censored headcount ratio by 0.041–0.044% points and adjusted headcount ratio by almost 0.2% points. The observed significance of the industry structure in the LSDV model is not confirmed in LSDCV and BCFE models.
We also estimate the model in (1) with our various indicators of MDP as dependent variables. Regression results from LSDV, LSFVC and BCFE specifications are reported in . The results help identify the key dimensions responsible for the role of FBs in mitigating MDP, among other results. It is noted that a one-percentage point increase in the coverage of FBs results in around 0.11% point decrease in the health-expenditure ratio. The effect is significant in LSDV and LSDVC models, but not in the BCFE model. Interestingly, the eligibility criteria for FBs are not directly related to the health dimension, while our analysis suggests that the impact on the MDP is channelled predominantly through the health-expenditure ratio.
Table 5. Regression results from models with indicators as dependent variables.
The effectiveness of FBs on monetary poverty is analysed below. For this purpose, we report estimation results of the same specifications as MDP but have headcount ratios constructed from national upper- and extreme poverty lines (). FBs significantly impact households in extreme monetary poverty. A one-percentage point increase in the fraction of the population receiving FBs enables to decrease extreme monetary poverty by 0.073–0.076% points, depending on the estimation method. This result confirms the relevance of FBs for the most income-sensitive layer of society. The coefficient magnitudes are larger than those estimated for severe MDP. Cash transfers received by such households may help report higher income, for some households high enough to escape the extreme monetary poverty trap. This, however, does not necessarily translate into a non-monetary resource to alleviate MDP. Family benefits significantly impact households below the national upper poverty line in the LSDV model only. That means the effect of this benefit on the poor below the national upper poverty line is not very certain.
Table 6. Regression results for the national poverty headcount ratios.
Robustness checks
We test the robustness of our model findings in several ways. The model estimates do not change qualitatively if we drop humanitarian aid. The effect magnitude and the significance of FBs are not highly sensitive to the omission of other controls either. Dropping province dummies, however, deprives the significance of the FBs. This suggests that the geographic composition of the MDP measures matters for the causal relationship between FBs and MDP. Similar qualitative results are observed for models with monetary poverty.
We further explore the significance of higher lags of FBs in the model (up to 4 lags). In MDP models with the poverty cut-off 1/2, the first lag of FBs preserves significance, while higher order lags turn out to be insignificant. Higher order lags are relevant for the model with national poverty lines, but at the expense of the lost significance in the first lag.
We run rolling window regressions to identify structural breaks, more likely to be associated with GFC and the major reform in 2011.Footnote11 The impact of FBs on MDP measures is the highest in an absolute value for time windows centred on 2011. The effect starts decaying with a high rate for subsequent windows. We also run rolling window regressions for models with indicators as dependent variables. The effect of FBs on the health-expenditure ratio decays in an absolute value over time. From the contribution analysis, we detect a drastic decrease in contributions of the health-related indicator to the adjusted headcount ratio since 2012 (). In fact, the effect of FBs on the health-related indicator becomes insignificant for the time period when the contribution of the latter falls below its weight.
Figure 6. Contributions of indicators to the adjusted headcount ratio.
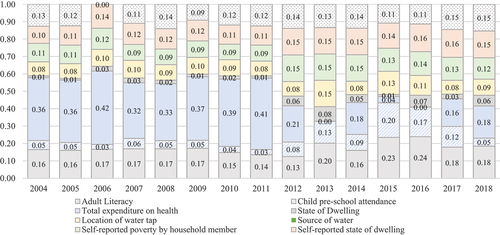
After GFC, the economic recovery and further growth deprive the contribution power of the income-sensitive health dimension. Since 2012, we observe more equal contributions by MDP indicators, making it even harder to target MDP with a single policy instrument. We observe higher contributions by indicators in the education dimension, signifying the increased role of human capital in addressing MDP. The highest contributor in the post-reform period becomes the self-reported poverty dimension, primarily capturing limitations in achievement opportunities (capabilities).Footnote12
VII. Conclusion and policy recommendations
In this study, we use the country HSDs for the period 2004–2018 to explore the possible effects of family benefits, as the main poverty targeted program in Armenia, on multidimensional and monetary poverty measures.
Our findings suggest that FBs reduce both multidimensional and monetary poverty with limitations. FBs mitigate severe MDP but not its lower levels. Even in the case of severe MDP, the effect is not uniformly observed. Among indicators included in the MDP, the health-expenditure ratio is the most affected by FBs. From the MDP analysis, we find that 15% of households in our sample are deprived in adult literacy and 21% - in dwelling standards. On the contrary, only 10% of households are deprived in the health dimension. These findings suggest that the program is not successfully addressing pure non-monetary dimensions, in which the rate of poverty is considerably high. Regarding monetary poverty, the impact of FBs is significant on the extreme poor, while the effect is somewhat inconclusive on those who are below the national upper poverty line. Auxiliary regressions and robustness checks confirm the stability of the estimates obtained from the baseline model.
Rolling window regression results show that the effect of FBs on MDP decays after 2011. In the post-reform period, the contribution of the health expenditure ratio falls, which can be explained by steadily increasing income and, hence, expenditures. Instead, self-reported poverty and education become the main contributors to MDP. Self-reported health status refers to the overall wellbeing in terms of social, biological and psychological health, and the deprivation captures limitations in the use of health services (Williams, Di Nardo, and Verma Citation2017). Similarly, the other two self-reported poverty indicators reveal limited capabilities of households in dwelling and achieving overall welfare. There is an important emphasis on the pro-poor targeted programs’ further development and funding in the Strategy for the Republic of Armenia Labor and Social Protection for 2022–2026. In this context, our findings suggest that in the current development stage of the country the targeted poverty programs should attribute high weights to dimensions associated with opportunities and access to welfare-improving infrastructures, such as education and health.
In Armenia, the administration lacks efficiency from several perspectives, as reported in a recent study by UNICEF (Citation2020). Inefficiencies range from the technical process of handling the applications to the human resources capacities. Social protection programs pay little attention to incentives for administrators to identify and enrol all eligible beneficiaries and provide quality services. On the beneficiaries’ side too, behavioural incentives are mostly disregarded, resulting in systematic distortions in the system. There are, however, steps towards improvement: the recent amendments to the FLSEB program secure benefit payments for vulnerable families without termination for up to 6 months if a working-age member engages in an income generating activity and up to 12 months if the member engages in agricultural production (UNICEF Citation2020).
Our study paves the way for future research to explore the micro foundations of targeted social programs in Armenia with the objective of tackling effectiveness gaps in poverty reduction.
Evidence from matching family benefits to multidimensional status suggests that, despite a higher coverage of family benefits after the GFC, inclusion and exclusion errors remain considerably high with no substantial improvement over time. This finding, at least partially, confirms the UNICEF’s (Citation2020) assessment that there is a considerable social assistance coverage gap regarding the extreme poor. We also observe that the coverage of family benefits among households in severe MDP has been improving since 2011. Nevertheless, the overall positive trend cannot be satisfactory, as there are spikes signifying the low resilience of the system towards external shocks.
In this light, it is critical that the Armenian government continue enhancing incentive compatible mechanisms for the main actors in the social protection system. Incentives need to be further anchored for non-poor households to abstain from applying for family benefits by adjusting and/or misreporting nominal income. Shifting resources from multidimensionally non-poor to poor households will enable an increase in the size of family benefits, which can help reduce poverty by investing in human capital and productive technologies.
Acknowledgements
We gratefully acknowledge the funding (Grant number 6/21, 2021) received from the Center for the Promotion of Economic Education and Research Foundation of the Central Bank of Armenia.
Disclosure statement
No potential conflict of interest was reported by the author(s).
Additional information
Funding
Notes
1 A decision regarding the provision of FBs is made based on the score constituting 12 indicators: (i) household’s social group (there are 19 groups, from disability to child and pension age); (ii) number of household members out of the labour force; (iii) settlement; (iv) household conditions; (v) owning a car; (vi) a household member is involved in entrepreneurship; (vii) signed real estate contract(s); (viii) custom payments; (ix) electricity bill during summer months; (x) a statement on the household’s socio-economic conditions issued by the community-level agency; ;(xi) family income; (xii) the 12-month gas consumption.
2 Budget expenditure items of FBs are not clearly defined for the period 2004–2007, and we abstain from reporting this data.
3 The amendments were reflected in the Government Decree No. 1864-N of December 2011.
4 The two cut-offs are ‘deprivation cut-off’ in each indicator (if the household’s achievement is below a predefined level, then the household is poor) and ‘poverty cut-off’ is a fraction of total number of indicators in which the household is poor.
5 See also Hills (Citation2011), Barnes et al. (Citation2011).
6 There might be high correlation between FBs and humanitarian aid, as both programs target the poor.
7 UNDP (Citation2021).
8 Bruno (Citation2005b) obtains the lowest RMSE for LSDV models for Monte-Carlo simulations. De Vos et al. (Citation2015) calculate a different RMSE measure, which takes both the coefficient’s bias and the model variance into account. They show that the constructed RMSE measure for BCFE is smaller than that for LSDVC.
9 The newly formed government has been eager to bring changes in government expenditures in forms of corrections of formerly established corruptive schemes, in many cases without any change in formal policies.
10 We apply Pesaran (Citation2004) test instead of the Breusch and Pagan (Citation1980) Lagrange multiplier test, since the latter exhibits substantial distortion for finite T (De Hoyos and Sarafidis Citation2006), which is our case.
11 We run regressions with the window lengths of 8–10 years, to keep the balance between the time span and the number of observations.
12 Correlation between self-reported poverty and deprivation from income has a decreasing trend with a higher slope in the post-reform period. The largest and lowest values are observed in 2004 and 2016 (0.22 and 0.09, respectively).
References
- Adato, M., S. Devereux, and R. Sabates-Wheeler. 2016. “Accessing the ‘Right’ Kinds of Material and Symbolic Capital: The Role of Cash Transfers in Reducing Adolescent School Absence and Risky Behaviour in South Africa.” The Journal of Development Studies 52 (8): 1132–1146. https://doi.org/10.1080/00220388.2015.1134776.
- Addison, T., D. Hulme, and R. Kanbur, Eds. 2009. Poverty Dynamics: Interdisciplinary Perspectives, Vol. 16. USA: Oxford University Press.
- Alkire, S. 2007. “The Missing Dimensions of Poverty Data: Introduction to the Special Issue.” Oxford Development Studies 35 (4): 347–359. https://doi.org/10.1080/13600810701701863.
- Alkire, S., and J. Foster. 2007. ”Counting and Multidimensional Poverty Measurement.” OPHI Working Paper 7, University of Oxford. https://ophi.org.uk/working-paper-number-07/
- Alkire, S., and J. Foster. 2011. “Counting and Multidimensional Poverty Measurement.” Journal of Public Economics 95 (7–8): 476–487. https://doi.org/10.1016/j.jpubeco.2010.11.006.
- Alkire, S., J. E. Foster, S. Seth, M. E. Santos, J. M. Roche, and P. Ballon. 2015. Multidimensional Poverty Measurement and Analysis. USA: Oxford University Press.
- Alkire, S., and M. E. Santos 2010. Acute multidimensional poverty: A new index for developing countries. United Nations development programme human development report office background paper, (2010/11).
- Anand, P., S. Jones, M. Donoghue, and J. Teitler. 2021. “Non-Monetary Poverty and Deprivation: A Capability Approach.” Journal of European Social Policy 31 (1): 78–91. https://doi.org/10.1177/0958928720938334.
- Anderson, T. W., and C. Hsiao. 1982. “Formulation and Estimation of Dynamic Models Using Panel Data.” Journal of Econometrics 18 (1): 47–82. https://doi.org/10.1016/0304-4076(82)90095-1.
- Arellano, M., and S. Bond. 1991. “Some Tests of Specification for Panel Data: Monte Carlo Evidence and an Application to Employment Equations.” The Review of Economic Studies 58 (2): 277–297. https://doi.org/10.2307/2297968.
- Baird, S., F. H. Ferreira, B. Özler, and M. Woolcock. 2014. “Conditional, Unconditional and Everything in Between: A Systematic Review of the Effects of Cash Transfer Programmes on Schooling Outcomes.” Journal of Development Effectiveness 6 (1): 1–43. https://doi.org/10.1080/19439342.2014.890362.
- Banerjee, A. V., and E. Duflo. 2003. “Inequality and Growth: What Can the Data Say?” Journal of Economic Growth 8 (3): 267–299. https://doi.org/10.1023/A:1026205114860.
- Barnes, D. F., S. R. Khandker, and H. A. Samad. 2011. “Energy Poverty in Rural Bangladesh.” Energy Policy 39 (2): 894–904. https://doi.org/10.1016/j.enpol.2010.11.014.
- Barrientos, A., and J. DeJong. 2006. “Reducing Child Poverty with Cash Transfers: A Sure Thing?” Development Policy Review 24 (5): 537–552. https://doi.org/10.1111/j.1467-7679.2006.00346.x.
- Barrientos, A., and D. Hulme. 2009. “Social Protection for the Poor and Poorest in Developing Countries: Reflections on a Quiet Revolution: Commentary.” Oxford Development Studies 37 (4): 439–456. https://doi.org/10.1080/13600810903305257.
- Bastagli, F., J. Hagen-Zanker, L. Harman, V. Barca, G. Sturge, and T. Schmidt. 2019. “The Impact of Cash Transfers: A Review of the Evidence from Low-And Middle-Income Countries.” Journal of Social Policy 48 (3): 569–594. https://doi.org/10.1017/S0047279418000715.
- Behrendt, C. 2000. “Do Means-Tested Benefits Alleviate Poverty?: Evidence on Germany, Sweden and the United Kingdom from the Luxembourg Income Study.” Journal of European Social Policy 10 (1): 23–41. https://doi.org/10.1177/a011398.
- Blundell, R., and S. Bond. 1998. “Initial Conditions and Moment Restrictions in Dynamic Panel Data Models.” Journal of Econometrics 87 (1): 115–143. https://doi.org/10.1016/S0304-4076(98)00009-8.
- Boardman, B. 1991. Fuel Poverty: From Cold Homes to Affordable Warmth. UK: Belhaven Press.
- Breusch, T. S., and A. R. Pagan. 1980. “The Lagrange Multiplier Test and Its Applications to Model Specification in Econometrics.” The Review of Economic Studies 47 (1): 239–253. https://doi.org/10.2307/2297111.
- Bruno, G. 2005. “Approximating the Bias of the LSDV Estimator for Dynamic Unbalanced Panel Data Models.” Economics Letters 87 (3). https://doi.org/10.1016/j.econlet.2005.01.005.
- Bruno, G. G. 2005. “Estimation and Inference in Dynamic Unbalanced Panel-Data Models with a Small Number of Individuals.” The Stata Journal 5 (4): 473–500. https://doi.org/10.1177/1536867X0500500401.
- Burchi, F., D. Malerba, C. E. Montenegro, and N. Rippin. 2022. “Assessing Trends in Multidimensional Poverty During the MDGs.” Review of Income and Wealth 68 (S2). https://doi.org/10.1111/roiw.12578.
- Carter, M. R., and C. B. Barrett. 2006. “The Economics of Poverty Traps and Persistent Poverty: An Asset-Based Approach.” The Journal of Development Studies 42 (2): 178–199. https://doi.org/10.1080/00220380500405261.
- Coetzee, M. 2013. “Finding the Benefits: Estimating the Impact of the South African Child Support Grant.” South African Journal of Economics 81 (3): 427–450. https://doi.org/10.1111/j.1813-6982.2012.01338.x.
- Decancq, K., and M. A. Lugo. 2013. “Weights in Multidimensional Indices of Wellbeing: An Overview.” Econometric Reviews 32 (1): 7–34. https://doi.org/10.1080/07474938.2012.690641.
- De Hoyos, R. E., and V. Sarafidis. 2006. “Testing for Cross-Sectional Dependence in Panel-Data Models.” The Stata Journal 6 (4): 482–496. https://doi.org/10.1177/1536867X0600600403.
- De Vos, I., G. Everaert, and I. Ruyssen. 2015. “Bootstrap-Based Bias Correction and Inference for Dynamic Panels with Fixed Effects.” The Stata Journal 15 (4): 986–1018. https://doi.org/10.1177/1536867X1501500404.
- Everaert, G., and L. Pozzi. 2007. “Bootstrap-Based Bias Correction for Dynamic Panels.” Journal of Economic Dynamics and Control 31 (4): 1160–1184. https://doi.org/10.1016/j.jedc.2006.04.006.
- Ferrarini, T., K. Nelson, and J. Palme. 2016. “Social Transfers and Poverty in Middle-And High-Income Countries–A Global Perspective.” Global Social Policy 16 (1): 22–46. https://doi.org/10.1177/1468018115591712.
- Hills, J. 2011. Fuel poverty: the problem and its measurement. CASE Reports from Centre for Analysis of Social Exclusion, London School of Economics.
- ILO 2020. World Social Protection Report 2020–22: Social Protection at the Crossroads – in Pursuit of a Better Future. Geneva, International Labour Office.
- ILO. 2022. “World Social Protection Report 2020-2022.” Geneva: International Labour Office.
- Kakwani, N., and J. Silber Eds. 2008. Many Dimensions of Poverty. Springer. USA.
- Kakwani, N., and J. Silber. 2008. “Introduction: Multidimensional Poverty Analysis: Conceptual Issues, Empirical Illustrations and Policy Implications.” World Development 36 (6): 987–991. https://doi.org/10.1016/j.worlddev.2007.10.004.
- Kangas, O., and J. Palme. 2000. “Does Social Policy Matter? Poverty Cycles in OECD Countries.” International Journal of Health Services 30 (2): 335–352. https://doi.org/10.2190/NCWB-35G3-NE2T-8VQR.
- Kilburn, K., L. Ferrone, A. Pettifor, R. Wagner, F. X. Gómez-Olivé, and K. Kahn. 2020. “The Impact of a Conditional Cash Transfer on Multidimensional Deprivation of Young Women: Evidence from South Africa’s HTPN 068.” Social Indicators Research 151 (3): 865–895. https://doi.org/10.1007/s11205-020-02367-y.
- Kiviet, J. F. 1995. “On Bias, Inconsistency, and Efficiency of Various Estimators in Dynamic Panel Data Models.” Journal of Econometrics 68 (1): 53–78. https://doi.org/10.1016/0304-4076(94)01643-E.
- Korpi, W. 2000. “Faces of Inequality: Gender, Class, and Patterns of Inequalities in Different Types of Welfare States.” Social Politics: International Studies in Gender, State & Society 7 (2): 127–191. https://doi.org/10.1093/sp/7.2.127.
- Kuklys, W. 2005. “Functionings-Based vs. Income-Based Inequality Measures: Informational Content and Robustness.” Amartya Sen’s Capability Approach: Theoretical Insights and Empirical Applications, 59–74. Berlin, Heidelberg: Springer Berlin Heidelberg.
- Lavallée, E., A. Olivier, L. Pasquier-Doumer, and A. S. Robilliard. 2010. “Poverty Alleviation Policy Targeting: A Review of Experiences in Developing Countries.” In Document de Travail. Paris: Université Paris-Dauphine/IRD, 1–29. https://d1wqtxts1xzle7.cloudfront.net/39163680/0fcfd512b31892ff36000000-libre.pdf?1444770762=&response-content-disposition=inline%3B+filename%3DPoverty_alleviation_policy_targeting_a_r.pdf&Expires=1706509920&Signature=PBKyZvXZHeFp8NF1VBvjAcmzUad8aEZzmHuvIPFucP7l73tL60Z5E~PS-i1aGrQ4W7DkVb11LRg8tcqIhXQs6w2GDo1-2kM5E9NZBFcLPGc5V2Gxe0w8QCTfQ0wbJ2Rdbn3l6Q-wBTKgp52uvGzRcckJriRbgy31z9WZs9dHYkfSk29kOnVR8muRKsZXQmxA~lOgW0cQW4hrza7uuuIgWdqGWsFZGxw47TS0nlB2OrkbWXAEGxVtKE5NIj2mvWd3-tn0KONIj8gQEhAgQZCEXvG-FbiGOce2Pwu9VeLBvJLumDJwhv~t~85NXreX2X72CBkXqp239Pyx0SG7ImiYig__&Key-Pair-Id=APKAJLOHF5GGSLRBV4ZA.
- Maldonado, L. C., and R. Nieuwenhuis. 2015. “Family Policies and Single Parent Poverty in 18 OECD Countries, 1978–2008.” Community, Work & Family 18 (4): 395–415. https://doi.org/10.1080/13668803.2015.1080661.
- Martinez, O. A., M. Lombe, A. M. Vazquez, and M. Coronado. 2016. “Rethinking the Construction of Welfare in Mexico: Going Beyond the Economic Measures.” International Journal of Social Welfare 25 (3): 259–272. https://doi.org/10.1111/ijsw.12202.
- Misra, J., S. Moller, and M. J. Budig. 2007. “Work—Family Policies and Poverty for Partnered and Single Women in Europe and North America.” Gender & Society 21 (6): 804–827. https://doi.org/10.1177/0891243207308445.
- Morel, N., C. Touzet, and M. Zemmour. 2018. “Fiscal Welfare in Europe: Why Should We Care and What Do We Know so Far?” Journal of European Social Policy 28 (5): 549–560. https://doi.org/10.1177/0958928718802553.
- Nickell, S. J. 1981. “Biases in Dynamic Models with Fixed Effects.” Econometrica 49 (6): 1417–1426. https://doi.org/10.2307/1911408.
- Notten, G., and A.-C. Guio. 2016. “The Impact of Social Transfers on Income Poverty and Material Deprivation (ImPRovE Working Paper No. 16/17).” Herman Deleeck Centre for Social Policy, University of Antwerp, 85–107. Accessed July 20, 2016. https://econpapers.repec.org/paper/hdlimprov/1617.htm.
- Ntsalaze, L., and S. Ikhide. 2018. “Rethinking Dimensions: The South African Multidimensional Poverty Index.” Social Indicators Research 135 (1): 195–213. https://doi.org/10.1007/s11205-016-1473-4.
- OPHI. 2022. Global MPI Country Briefing 2022: Armenia (Europe and Central Asia). UK: University of Oxford.
- Pesaran, M. H. 2004. General Diagnostic Tests for Cross Section Dependence in Panels. University of Cambridge, Faculty of Economics, Cambridge Working Papers in Economics No. 0435.
- Pham, A. T. Q., P. Mukhopadhaya, and H. Vu. 2020. “Targeting Administrative Regions for Multidimensional Poverty Alleviation: A Study on Vietnam.” Social Indicators Research 150 (1): 143–189. https://doi.org/10.1007/s11205-020-02285-z.
- Pham, A. T. Q., P. Mukhopadhaya, and H. Vu. 2021. “Estimating Poverty and Vulnerability to Monetary and Non-Monetary Poverty: The Case of Vietnam.” Empirical economics 61: 3125–3177.
- Phan, P. V., M. O’brien, S. Mendolia, and A. Paloyo. 2017. “National Pro-Poor Spending Programmes and Their Effect on Income Inequality and Poverty: Evidence from Vietnam.” Applied Economics 49 (55): 5579–5590. https://doi.org/10.1080/00036846.2017.1313957.
- Plagerson, S., V. Patel, T. Harpham, K. Kielmann, and A. Mathee. 2011. “Does Money Matter for Mental Health? Evidence from the Child Support Grants in Johannesburg, South Africa.” Global Public Health 6 (7): 760–776. https://doi.org/10.1080/17441692.2010.516267.
- Sainsbury, D., and A. Morissens. 2002. “Poverty in Europe in the Mid-1990s: The Effectiveness of Means-Tested Benefits.” Journal of European Social Policy 12 (4): 307–327. https://doi.org/10.1177/a028598.
- Sen, A. 1993. “Capability and well-being.” The Quality of Life, edited by M. C. Nussbaum and A. K. Sen, 30–53. Oxford: Oxford University Press.
- Sen, A. K. 1999. Development as Freedom. Oxford: Oxford University Press.
- Silber, J. 2011. “A Comment on the MPI Index.” Journal of Economic Inequality 9 (3): 479–481. https://doi.org/10.1007/s10888-011-9198-8.
- Smolensky, E. S. Reilly, and E. Evenhouse 1995. “Should Public Assistance Be Targeted?.” Journal of Post Keynesian Economics 18 (1): 3–28.
- UNDP 2021. 2021 Global Multidimensional Poverty Index (MPI): Unmasking disparities by ethnicity, caste and gender. New York.
- UNICEF. 2020. Core Diagnostic of the Social Protection System in Armenia. Washington, D.C.: World Bank Group. http://documents.worldbank.org/curated/en/386661625213315758/Core-Diagnostic-of-the-Social-Protection-System-in-Armenia.
- UN WOMEN 2021. Assessment of the social protection floor in Armenia.
- von Maltzahn, R., and K. Durrheim. 2008. “Is Poverty Multidimensional? A Comparison of Income and Asset Based Measures in Five Southern African Countries.” Social Indicators Research 86 (1): 149–162. https://doi.org/10.1007/s11205-007-9105-7.
- Waglé, U. R. 2008. “Multidimensional Poverty: An Alternative Measurement Approach for the United States?” Social Science Research 37 (2): 559–580. https://doi.org/10.1016/j.ssresearch.2007.06.013.
- Williams, G., F. Di Nardo, and A. Verma. 2017. “The Relationship Between Self-Reported Health Status and Signs of Psychological Distress within European Urban Contexts.” European Journal of Public Health 27 (May): 68–73. https://doi.org/10.1093/eurpub/ckx008.
- Woolard, I., and M. Leibbrandt. 2013. “The evolution and impact of unconditional cash transfers in South Africa.” Development Challenges in a Postcrisis World, edited by L. Harrison, J. Lin, and C. Sepulveda, 363. Washington DC: World Bank.
- Yu, L. R., and X. Y. Li. 2021. “The Effects of Social Security Expenditure on Reducing Income Inequality and Rural Poverty in China.” Journal of Integrative Agriculture 20 (4): 1060–1067. https://doi.org/10.1016/S2095-3119(20)63404-9.
Appendix 1.
Computation of multidimensional poverty
Multidimensional poverty may be estimated using several methods. Every method has certain advantages and shortcomings (see Pham et al. Citation2021). The Alkire-Foster median method (see Alkire and Foster Citation2011) is one of the most widely used measures of MDP, which has been used by the UNDP to compare MPI worldwide. We will use this method for our computation of MDP in Armenia.
The unit of our analysis is household. The outcome variable is based on the poverty deprivation score, and the methodology for constructing the score is described below. Let denotes the achievement of household
in dimension
for all
, and
We use a dual cut-off framework to identify multidimensional poor households. The deprivation cut-off (denoted as
) is the poverty line in dimension or indicator
. If the achievement of household
is higher than the cut-off,
, household
is not deprived in dimension/indicator
. Otherwise, the household
is deprived in this dimension/indicator. If household
is deprived in dimension
, then we denote that the deprivation status value is
, otherwise,
. The second cut-off is the overall poverty cut-off
which is a pre-determined fraction of the total number of dimensions or indicators. That is, if we define poverty measure as the household being poor when it is deprived in 40 percent of total number of indicators then we assign a value
In this process, there are two steps to identify a poor household. First, by giving weight
to each dimension or indicator
such that
we obtain the weighted deprivation status value
and the deprivation score of household i is,
Second, if household
is considered to be poor (and we will denote
as
, otherwise (that is, if
non-poor (in this case
. The censored deprivation score (
captures the share of possible deprivations experienced by poor household
.
Three indicators are used to measure MDP: the headcount ratio (), the average poverty gap (
) and the adjusted headcount ratio (
). By dividing the number of the poor households by the total number of households, we can obtain the censored headcount ratio:
where is the number of poor households, for a given k. The average deprivation score across the poor is represented by the average poverty gap,
This poverty gap index, also called the intensity of poverty, provides relevant information about MDP. Households experiencing simultaneous deprivations in a higher fraction of dimensions have a higher intensity score and are poorer than others with a lower intensity.
Based on these two measurements, the adjusted headcount ratio () can be obtained as:
Here, is the weighed deprivation status specific to dimension
. The adjusted headcount ratio is the share of weighted deprivations experienced by the poor divided by the number of individuals. If poor individuals are deprived in all dimensions simultaneously, that is, intensity of poverty (A) is the highest,
approaches
.
Censored headcount ratio of dimension/indicator j, is defined as the percentage of poor households who are deprived in j after the introduction of the dual cut-off:
The adjusted headcount ratio satisfies the additive decomposability principle (see Alkire and Foster Citation2007), so it can be decomposed by dimensions and subgroups. Using equations (A4) and (A5),
can be written as the weighted sum of the censored headcount ratios:
The contribution of dimension is
Appendix 2.
Table A1. Specification tests.