
ABSTRACT
We aim to identify how relative importance of potential drivers of national suicide rates has changed over time. We apply statistical model averaging techniques to a dataset that covers 25 potential suicide determinants for 172 countries over 20 years. Our application of the weighted average least squares (WALS) approach indicates that some inferences are unstable across time. Suicide determinants related to religious affiliations tend to become less important in recent years. The opposite is true for non-educational measures of human capital, such as life expectancy at age 65, and labour market variables, such as unemployment. Our analysis sheds some light on the differential effects of potential suicide determinants on male and female suicidality and their evolution over time.
I. Introduction
Since the turn of the twenty-first century, global patterns of suicide mortality have markedly changed. Suicide rates have lowered in Europe and Africa but increased in Americas (World Health Organization Citation2021). In 2000, the highest suicide rates were observed in Russia, Botswana and Lithuania. In 2019, the highest suicide prevalence is recorded in Lesotho, Guyana and Eswatini. A possible reason underlying these patterns is that key determinants of national suicide rates have changed over 20 years from 2000 to 2019. This paper examines this possibility using a model averaging technique.
We examine variation in importance over time of 25 potential drivers of age-standardized suicide rates that have been identified in the literature (J. Chen et al. Citation2012). To do so, we compile a dataset of potential suicide determinants for 172 countries over 20 years and use statistical model averaging techniques to determine their relative importance in each period. We rely on model averaging as an alternative to model selection that combines inferences from multiple models and incorporates model uncertainty. Our analysis sheds some light on the differential effects of potential suicide determinants on male and female rates and their evolution over time.
We consider variables that were empirically linked with suicidality in the literature. They fall into five broad categories. The first group includes geographic and climate factors such as absolute latitude (An et al. Citation2023) or precipitation (Fountoulakis et al. Citation2016). The second category contains six macroeconomic and labour market variables such as GDP per capita (Meda et al. Citation2022), unemployment (Botha and Nguyen Citation2022), or female labour force participation (Jalles and Andresen Citation2015). The third category includes life expectancy at birth (Wu and Bond Citation2006), life expectancy at age 65 (Breuer Citation2015), and mean years of schooling (Salman et al. Citation2017). These variables proxy for what economic theory often refers to as human capital (Hamermesh and Soss Citation1974; Koo and Cox Citation2008). We also consider seven demographic factors that range from population density (Oka et al. Citation2015) to population growth (Mobley and Taasoobshirazi Citation2022) to fertility (Okada and Samreth Citation2013). Our final category contains sociocultural factors such as religious affiliations (Wu et al. Citation2022), internet usage (Lari and Emamgholipour Citation2023), or alcohol consumption (Ilgun et al. Citation2020).
Empirical studies that explore the factors influencing suicide mortality have to address the problem of model uncertainty. Estimation results are often not robust to small changes in statistical model specification. For example, most of the 26 factors listed in Chen et al. (Citation2012) show positive, negative or null association with suicide rates, depending on specification. Theories from various fields of social and health sciences support the choice of specific explanatory variables. However, they offer little guidance on how to specify the model or how to measure qualitative variables. For example, economic theories of suicide predict that the level of human capital is inversely related to suicide mortality (Hamermesh and Soss Citation1974; Koo and Cox Citation2008). Should human capital be proxied by years of schooling or life expectancy, tertiary enrolment or adult literacy rates? Durkheim’s sociology classic suggests that economic booms are associated with moral decay which leads to more suicides. But how to measure booms? Should one use changes in unemployment rates or deviations of per capita GDP from some long-term trend?
There are two general approaches to address model uncertainty: model selection and model averaging. The former is concerned with selecting a single ‘correct model’ out of the available set of statistical models and is commonly used in suicide literature (Meda et al. Citation2022; Wu et al. Citation2022). Model selection is subject to sampling uncertainty which, if not addressed, might overestimate accuracy (Kabaila and Mainzer Citation2018). In this study, we rely on model averaging that incorporates the uncertainty arising from estimation and model selection jointly. It collects pieces of information on the parameters of interest from each possible model and incorporates them into an unconditional estimate. The latter is computed as a weighted average of the conditional estimates across all possible models. Prominent overviews of model averaging techniques can be found in Raftery (Citation1995) and Hoeting et al. (Citation1999), whereas more recent advances and applications are reviewed in Moral-Benito (Citation2015) and Steel (Citation2020).
We use weighted-average least squares (WALS) approach to model averaging recently developed in Magnus et al. (Citation2010) and De Luca et al. (Citation2018) and reviewed in Magnus and De Luca (Citation2016). The method delivers a Bayesian combination of frequentist estimators and has several advantages over alternative model averaging techniques. It allows to rank the importance of potential suicide determinants on the basis of their statistical robustness. Hence, applying the model averaging technique to a cross-section of countries for each of 20 consecutive years reveals how the importance of suicide determinants and their coefficients evolved over time.
Model averaging has been widely used in a range of applications from vaccine effectiveness studies (Oliveira, Shapiro, and Weinberger Citation2022) to health effect studies of particulate matter (Clyde Citation2000). Applications of model averaging to determine the drivers of complex socioeconomic phenomena extend to economic growth (Brock and Durlauf Citation2001), political polarization (Grechyna Citation2016), foreign aid (Bayale Citation2022). The weighted-average least squares (WALS) approach to model averaging has been exploited in a range of applications, from examining the determinants of cross-country disparities in per capita income (Magnus, Powell, and Prufer Citation2010; Osterloh Citation2012) to evaluating the deterrent effect of capital punishment across US states (Moral-Benito Citation2015). To the best of our knowledge, this study is the first attempt to apply WALS to the determinants of suicide mortality and their evolution.
II. Data
We compile a dataset that covers the evolution of 28 variables over the period 2000–2019. Observations are collected from public sources for 172 countries at annual frequency. Variable definitions and data sources are presented in Table A.1 of the Supplementary Appendix, whereas Table A.2 reports the list of countries included in our dataset. presents the key summary statistics.
Table 1. Potential suicide determinants.
Suicide mortality data
We consider age-standardized suicide rates at the national level reported by World Health Organization (Citation2021). We examine total suicide mortality as well as disaggregated by sex.
Potential suicide determinants
enumerates 25 potential suicide determinants we selected from the literature as regressors in our model averaging approach. Our choice of regressors is partially governed by their prominence in the literature and partially by data availability. Each explanatory variable is accompanied by a reference to a recent study that examined it as a suicide factor. lists four geo-climate, six macroeconomic, three human capital, seven demographic, and five socio-cultural variables. Comparable data on five variables, namely population weighted absolute latitude, religious affiliations and international migrant stock, are available only at 5-year intervals. In such cases, we rely on linear interpolation to deal with missing annual observations. Our dataset and additional details on its construction are available from the author upon request.
As emphasized by Lepori et al. (Citation2024), suicide is a result of an interplay between ‘seed’ factors (e.g. mental illness), ‘soil’ factors (e.g. divorce and other major life events), and ‘climate’ factors (e.g. socioeconomic or geo-climatic conditions). Our analysis focuses on the ‘climate’ factors that are robustly associated with cross-country variation in suicide mortality, rather than on factors that directly increase individual suicide risk. However, this restriction raises several concerns. First, it might be hard to distinguish between ‘climate’, ‘soil’, and ‘seed’ factors. Second, we do not consider several potentially important factors due to data availability and an increasing number of covariates in a fixed sample of countries. Finally, our estimates are susceptible to potential cross-level bias as they rely on data aggregated at the national level. For example, per capita alcohol consumption, identified as a factor associated with suicide mortality, may vary significantly across different groups within countries. Studies that rely on more granular data are in a better position to mitigate this potential issue.
III. Method
Model averaging techniques are often used where the large number of potential determinants is confronted with the limited number of observations. This approach suits to the empirical research on suicide mortality where only 183 observations are available at the national level, whereas the literature proposed numerous factors affecting it. In the present study, we employ weighted-average least squares (WALS) to account for model uncertainty in the context of a Gaussian linear model.
Model-averaging methods generally fall into one of two categories: Bayesian (BMA) and frequentist (FMA). In contrast, WALS is a Bayesian combination of frequentist estimators that occupies an intermediate position between BMA and FMA (Magnus, Powell, and Prufer Citation2010). While the parameters of each model are estimated by constrained least squares under a frequentist perspective, the weighting scheme is based on a Bayesian perspective.
WALS has both theoretical and practical advantages over standard BMA and FMA estimators. Unlike BMA, the choice of prior in WALS is not ad hoc but theoretically based. In contrast to several BMA estimators that rely on normal priors leading to unbounded risk, WALS assumes priors based on considerations related to bounded risk in terms of MSE, admissibility, robustness, near-optimality in terms of minimax regret, and proper treatment of ignorance (see, e.g. Magnus et al. (Citation2010), and Magnus and De Luca (Citation2016)). Furthermore, compared to competing model-averaging estimators, WALS has been shown to have good performance in small-samples. For instance, based on a series of Monte-Carlo studies, De Luca et al. (Citation2023) demonstrate that compared to nine alternative estimators, the coverage errors for WALS are small, while confidence intervals are short.
In this study, we rely on three types of neutral priors with bounded risk, which belong to the class of reflected generalized gamma distributions. Our baseline results rely on WALS implementation using Laplace priors, which has the advantage of leading to reduced risk (Magnus, Powell, and Prufer Citation2010). Robustness checks in Section 4.5 rely on Subbotin and Weibull priors advocated by Magnus and De Luca (Citation2016) due to their robustness property.
The WALS approach also provides a practical advantage over both BMA and FMA. In the presence of N regressors, model-averaging estimators have 2N possible models to consider. To reduce this computational burden, BMA estimators tend to rely on approximation methods such as MCMC to explore sub-regions of the model space. Due to its preliminary semiorthogonal transformation of the regressors, WALS reduces its computational burden to the order N and provides exact model-average estimates in little time. This is important for the present study, as we consider a large number (N = 25) of potential suicide determinants.
Compared to BMA and FMA, WALS has certain limitations. Some of them stem from the ‘hybrid’ nature of the method, semiorthogonal transformation of regressors, and the fact that it assumes priors on the t-ratios rather than the model space. Unlike BMA, WALS (and FMA) delivers neither readily interpretable posterior inclusion probabilities for the explanatory variables nor model probabilities. The latter precludes using WALS for model selection (Steel Citation2020). WALS cannot address potential dependence between explanatory variables in the posterior distribution, also known as jointness. The measures of jointness proposed in the literature depend on the posterior inclusion probabilities of the regressors, whereas WALS and FMA cannot provide them (Magnus and De Luca Citation2016). In contract to FMA, both WALS and BMA estimates depend on prior assumptions. Even though the choice of priors in WALS is theoretically based, potential sensitivity of the results to the prior assumptions could be considered a limitation of both approaches.
Following the argument of Magnus et al. (Citation2010), we report unconditional estimates and standard errors rather than conditional on inclusion. A regressor is considered to be robustly correlated with a suicide rate if t−ratio on its coefficient exceeds one in absolute value (Luca and Magnus Citation2011). This robustness criterion approximately corresponds to posterior inclusion probability (PIP) being above 0.5 in classical BMA (Masanjala and Papageorgiou Citation2008; Raftery Citation1995).
IV. Results
Importance of suicide determinants in 2000 and 2019
In , we start by examining how the measures of robustness for each potential determinant changed between 2000 and 2019. The factors are ranked according to their importance for total suicide rates in 2000 as measured by WALS |t|− statistics.
Figure 1. Robust determinants of suicide in 2000 and 2019.
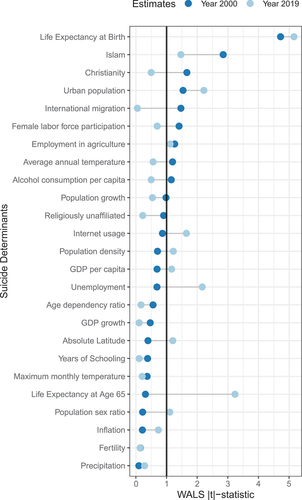
The five most important suicide factors in 2000 were life expectancy at birth, affiliations with Islam and Christianity, fraction of population living in urban areas, and extent of international migration. Only three of these factors, life expectancy at birth, affiliation with Islam, and urban population, remain robustly correlated with suicide rates in 2019. Several factors that showed no evidence of robustness in 2000 have substantially gained importance. These are life expectancy at age 65, unemployment rate, and internet usage.
extends the analysis by comparing the robustness of determinants of male and female suicide rates in 2000 and 2019. In addition to ranking the robust factor by their WALS |t|− statistics, it reports posterior mean coefficients.
Figure 2. Robust determinants of male and female suicide rates in 2000 and 2019.
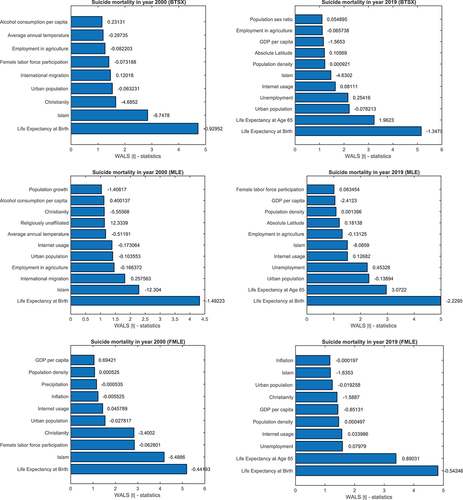
Some major changes among the set of robust factors are worth noting. Affiliation with Islam has diminished its relative importance for both suicide rates while still remaining statistically robust. On the other hand, affiliation with Christianity has lost its importance as a protective factor to the point of losing its statistical robustness for male but not female suicide mortality.
Some of the most important factors in 2000 are no longer among those in 2019. For instance, international migration and female labour force participation were among the three most important factors for male and female rates, respectively, in year 2000. Neither variable shows any evidence of robustness for the corresponding mortality measure in year 2019.
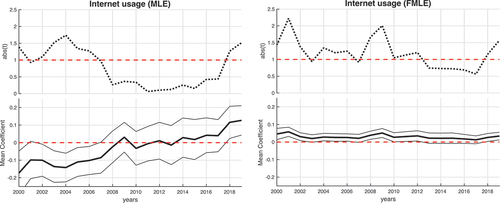
Internet usage remains a robust factor for male suicidality both in 2000 and 2019, but the sign of its mean coefficient has changed. While internet usage was a protective factor in 2000, it has become a risk factor in 2019.
We also observe some stability in inferences. First, the most robust determinant, life expectancy at birth, remains the same for both years and each level of disaggregation. Second, we observe no change in signs of the coefficient for all robust regressors. With a notable exception to internet usage, factors that were negatively correlated with suicide rates in 2000 remain to be protective in 2019. The next session will discuss the pattern of dynamics over entire 20 years in details.
How importance of suicide determinants evolved over 20 years
We examine the evolution of the key WALS statistics for 25 suicide factors over the 20 years period. The starkest results are reported in , whereas complete results for male, female and total suicide mortality are reported in the Supplementary Appendix. In this section, we briefly summarize the observed dynamics and later discuss the most important determinants in the wider context in Section 4.3.
Figure 3. Life expectancy at birth is the most important determinant.
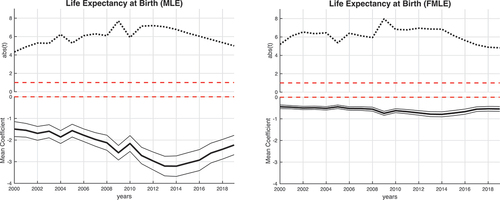
Figure 4. Increasing importance of life expectancy at age 65.
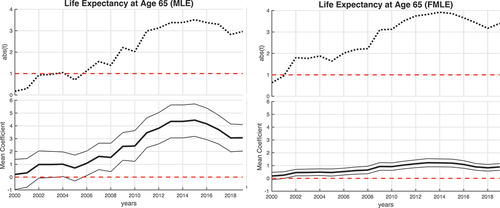
Figure 5. Evolving importance of labor market factors.
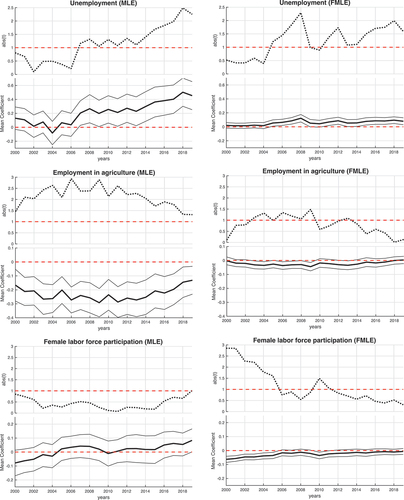
Figure 6. Evolving importance of religious factors.
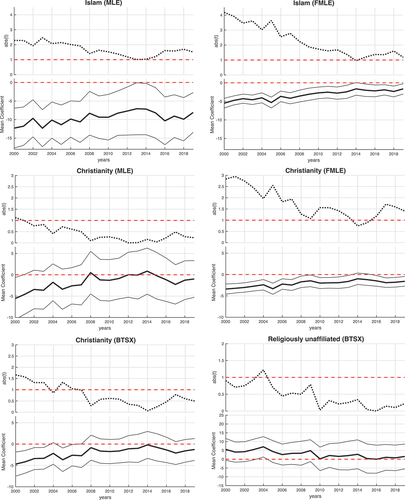
Figure 7. Evolving importance of environmental factors.
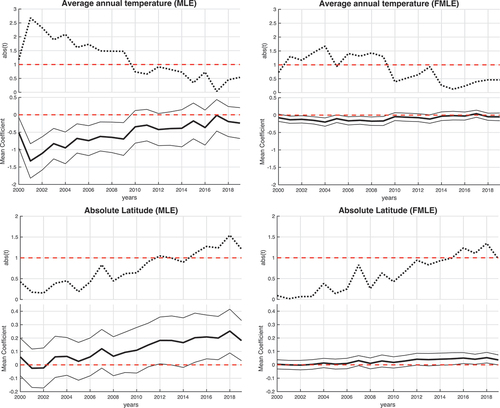
Figure 8. Evolution of most robust demographic factors.
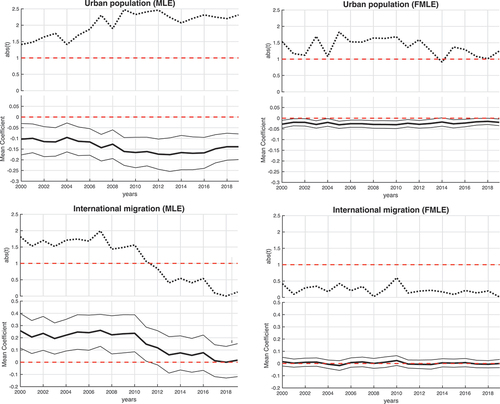
Figure 9. Changing association of suicidality with internet usage.
Life expectancy at birth remains the most important factor throughout the entire period (see ). It is negatively associated with all three measures of suicide mortality. Other protective factors that remain robust throughout the 20 years include fraction of urban population, employment in agriculture (for male and total mortality), affiliation with Islam or Christianity (female mortality). The life expectancy at age 65, which is positively correlated with all three suicide rates, remains robust throughout nearly all 20 years, steadily gaining importance in terms of WALS |t|−statistic.
A subset of variables robust during early 2000s has been losing their importance to the point of crossing significance threshold. Protective factors include average annual temperature and female labour force participation (female rates). Factors associated with higher suicide rates that gradually lost their importance include population density (female rates), international migration (male and total rates), and internet usage (female rate).
A few variables exhibit the opposite tendency in terms of their importance. While showing no evidence of robustness during the initial years, WALS |t|−statistics for several variables exhibited upward trends eventually crossing the significance barrier. These factors are absolute latitude, unemployment rate, and years of schooling (female rate). All of them are positively associated with suicide mortality.
The remaining variables show little or no evidence of statistical robustness for nearly all the years considered.
Evolution of key determinants as theoretical proxies
Variables that we adopt from the literature aim to proxy for more abstract constructs that underpin causal theories of suicide. For example, international migration and fertility might proxy for social isolation (Chen et al. Citation2012; Neumayer Citation2003), life expectancy proxies for human capital accumulation (Koo and Cox Citation2008), whereas latitude proxies for sunlight exposure and its seasonal variability (Helliwell Citation2007). This section discusses the evolution of our variables within these broader theoretical constructs.
Human capital variables
We examine the importance of three human capital variables potentially associated with suicidality. Mean years of schooling proxies for an educational dimension of human capital, life expectancy at birth and life expectancy at age 65 represent its non-educational dimensions. The two former measures form part of Human Development Index (HDI), which has also been used as a covariate in suicide regressions (Wu et al. Citation2022).
As shown in , life expectancy at birth is the most important suicide determinant throughout the period 2000–2019. It is negatively associated with suicide mortality, which is consistent with an ”economic theory of suicide” proposed by Hamermesh and Soss (Citation1974) and extended by Koo and Cox (Citation2008).
Life expectancy at age 65 has gained its importance to the point of becoming the second most robust factor for both male (MLE) and female (FMLE) age-standardized suicide rates. It is the most robust factor that is positively associated with suicide mortality (see ).
According to the economic theory of suicide, education should be negatively associated with suicidality because its level is an important predictor of future income and therefore lifetime utility (Hamermesh and Soss Citation1974; Koo and Cox Citation2008). On the other hand, higher education could be associated with higher suicidality as it may expose individuals to increasing competition with their peers, leading to frustration and stress (Chen et al. Citation2012). The empirical evidence seems to be mixed and ”appears to depend much on what other factors are included” (Helliwell Citation2007, 461). Using model averaging to address this point, we found no robust association between mean years of schooling and most measures of suicidality over 20 years. An exception is female suicide rate which is robustly positively correlated with education during 2012–18.
Labor market and macroeconomic variables
demonstrates that the role of unemployment rate as suicide determinant has increased during 2000–19. While it showed no evidence of robustness during the first 6 years of the twenty-first century (WALS |t| < 1), it has become a robust determinant of both male and female suicide rates in the later years. Since 2013, its mean coefficient and WALS |t|−statistic have been increasing, indicating both higher effect of unemployment on suicide rates and higher extent of its robustness. The unemployment rate is positively correlated with suicide mortality in line with multiple recent studies (Botha and Nguyen Citation2022; Breuer Citation2015; Meda et al. Citation2022).
The fraction of population employed in agriculture has been a highly robust determinant for male and total rates throughout 20 years. Its mean coefficient remained negative implying that a higher agricultural employment is associated with lower male and total suicide rates. These conclusions do not extend to female rates, especially in the second decade of the century. While some evidence of robustness was still present prior to 2010, WALS |t|−statistic fall below its significance threshold for later years.
Several studies show positive association of female labour force participation with both male and female suicide rates (Burr, McCall, and Powell-Griner Citation1997; Chen et al. Citation2017; Milner, McClure, and De Leo Citation2012). This association has been argued to be a result of weakening family ties and Durkheim’s notion of ”social regulation” (Milner, McClure, and De Leo Citation2012). On the other hand, female labour participation may be protective against the effects of male job loss (Phillips and Nugent Citation2014). In line with Burr et al. (Citation1997) who examined this link in the US context, our approach extends a dynamic perspective to the global setting. Our estimation suggests null association between female labour force participation and male suicide mortality. We observe its robust negative association with the female rate for 2000–2006 and 2010. A downwards trending behaviour of WALS |t|−statistic indicated that the protective effect of female labour force participation has been diminishing over time.
We find that many of the potential macroeconomic determinants, such as GDP per capita, GDP growth rate, or inflation, are not among the robust and important regressors for most of 20 years considered. This conclusion applied to all measures of suicide mortality that we considered.
Religious variables
To capture the potential effect of religions on suicide, we consider three variables: fraction of population affiliated with two major religions (Islam and Christianity) and fraction of population without religious affiliation (including agnostics and atheists). Most representative results from WALS estimation are presented in while complete results are reported in Figures A.12-A.13 of the Supplementary Appendix.
The estimation results can be summarized as follows. First, affiliation with Islam or Christianity is negatively correlated with male, female and total suicide rate. Second, religious affiliations are more robust determinant of female than male suicide rates. Third, the effects of religious affiliation and degrees of robustness have diminished over the period 2000–2019. Fourth, affiliation with Islam remains a robust determinant throughout 2000–2019. Finally, lack of religious affiliations is not a robust factor of suicide mortality.
Affiliation with Islam remains a robust determinant of suicide for the entire period 2000–2019. It negatively correlates with suicide rates at each level of disaggregation. This is consistent with the notion that Islam takes a strict view against suicide (see, e.g., Shoib et al. Citation2022). However, its measure of robustness, WALS |t|−statistic, and its protective effect have diminished over the 20 years, especially for female suicide rates.
Posterior mean coefficients for Christianity are negative for all three measures of suicide mortality. However, evidence of robustness is found for female but not male suicide rates. The degree of robustness has also diminished over the 20 years for all three measures.
The fraction of population without religious affiliation shows no evidence of robustness for every measure of suicide mortality considered. This result holds for every year between 2000 and 2019. Due to the sparsity of available data, we were unable to include affiliation with Hinduism as a potential determinant of suicide mortality. The literature suggests that Hinduism is positively associated with suicide risk at the population level, possibly due to its tolerant attitude towards suicides (Arya et al., Citation2018). However, our analysis was restricted to religions that prohibit suicide, which precluded us from investigating the relationship between religious tolerance towards suicide and observed suicide incidence at the national level. This is a limitation of our study.
Environmental variables
Only two out of four geo-climate variables show some evidence of robustness. As shown in , average annual temperature is an important factor during the first decade of the century but its WALS |t|−statistic exhibits a downward trend. The opposite conclusion applies to the population weighted latitude in absolute value. Its WALS |t|−statistic exhibits an upward trend crossing the significance threshold during the last 5 years considered. These effects are more pronounced for male and total rather than female rates.
Whenever robust, higher average annual temperature is negatively associated with suicide mortality, whereas higher absolute latitude is positively associated with it. Since proximity to the equator tends to be associated with higher average annual temperature, both variables might be imperfectly capturing the effects of unobserved factors such as exposure to sunlight or its seasonal cyclicality.
Precipitation and maximum monthly temperature show no evidence of robustness for any measure of suicide mortality that we considered.
Demographic variables
Our findings indicate that both urbanization and to a lesser extent international migration contribute to shaping global suicide mortality patterns. shows that the fraction of population living in urban areas is robustly negatively associated with suicide for the entire 20-year period. Its measure of robustness, WALS |t|−statistic, shows upward tendency for male and total rates while maintaining stability for female rates.
These findings are at odds with early empirical research (Burr, Mccall, and Powell-Griner Citation1994; Minoiu and Andres Citation2008), and Durkheim’s hypothesis linking urbanization with increased dissolution of society ties leading to higher suicide prevalence. However, our results are in line with more recent studies suggesting that urbanization is a protective factor (Cai et al. Citation2022).
During 2000–2010, international migration was a robust determinant, positively associated with male suicide mortality. This is consistent with the notion that migration diminishes the degree of social integration, which act as a protective mechanism. International migration seems to matter less for male suicidality in recent years and has no robust association with female suicide rates at any of the 20 years considered.
Multiple studies suggested that demographic variables are associated with differences in national suicide rates (Chen et al. Citation2012; Ilgun et al. Citation2020). Our model averaging approach indicates that many of the commonly used demographic variables show little or no evidence of robustness for years 2000–2019. These include, population growth rate, age dependence ratio, population sex ratio, fertility and population density (see Figures A.4-A.6 of the Supplementary Appendix).
Are robust determinants of suicide the same for male and female rates?
While estimation results presented in clearly indicate that the ranking of robust determinant of male and female suicide rates differ, some questions arise. Should these differences be attributed to sampling variation or do they point towards some tendencies? Do mean coefficients (both values and signs) remain stable over time for the potential determinants of male and female suicide mortality?
Our estimation results indicate that the dynamics of the statistical robustness and the signs of mean coefficients tend to coincide for most factors. However, there are several remarkable differences. These are most apparent in case of the following factors: international migration, employment in agriculture, female labour force participation, internet usage and affiliation with Christianity.
Employment in agriculture is one of the most robust protective factors for male suicidality for the both decades. However, it shows very weak, if any, evidence of robustness for female suicide rates. During 2000–2010, international migration was a robust determinant, positively associated with male suicide mortality (see ). This is consistent with the notion that migration diminishes the degree of social integration, which acts as a protective mechanism (J. Chen et al. Citation2012; Neumayer Citation2003). However, our estimation results show no evidence of statistical robustness for female rates for the entire 20 -year period.
Internet usage is a statistically robust factor for both male and female suicide rates during 2000–2007 but it has the opposite effects on the two. shows a negative association of internet usage with male suicide mortality but positive with female rates. We observe evidence of robustness once disaggregated by sex, but none at the national level except when the two signs coincide as in 2018–19 (Figure A.11 of the Supplementary Appendix).
Several variables show robust association with female suicide mortality but null association with male rates. Protective factors include affiliation with Christianity and female labour force participation. While both factors tend to lose their importance over time, they are robustly correlated with female suicidality for 18 and 7 years out of 20 years considered. Population density is a robust determinant positively associated with female suicide rates for most of the first decade of the century. Yet, it shows no evidence of robustness for male rates.
Robustness checks and limitations of this study
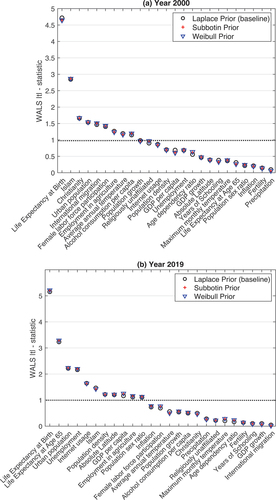
We examine the robustness of our results in the use of different priors in WALS estimation. As noted by Steel (Citation2020), it is a good practice to employ a range of priors and explore how outcome differ across them. Furthermore, as shown by Hans et al. (Citation2023), adjusting priors and their parameters might help dealing with potential influential observations in the context of Bayesian model averaging. compares our baseline WALS estimates under Laplace prior, with alternatives that employ reflected Weibull and Subbotin prior distributions advocated by Magnus and De Luca (Citation2016). Parameters of all three prior distributions are fixed to their minimax regret solutions under the neutrality condition as described in Magnus and De Luca (Citation2016). Our estimates differ little across the three selected priors. shows that the ranking of suicide determinants based on WALS |t|- statistic for year 2000 does not depend on our choice of priors. The same applies for year 2019.
Figure 10. WALS estimation results under alternative priors.
Our second robustness check concerns alternative estimates of real GDP. As shown by Ciccone and Jarocinksi (Citation2010), model-averaging estimates in cross-country growth regressions could be sensitive to small changes in real GDP measures. To mitigate this concern, we replicate our analysis using an alternative GDP measure. While our analysis relies on GDP estimates from the World Bank’s World Development Indicators (WDI), the sensitivity experiment employs Penn World Table (PWT) 10.1 estimates. WALS statistics summarized in Figure A.15 of the Supplementary Appendix show little sensitivity to the use of an alternative GDP measure.
Following Meda et al. (Citation2022), we rely on per capita GDP rather than gross national income (GNI) as a proxy for economic development. Unlike GDP, GNI takes into account net factor income from abroad and is therefore used by the UNDP to construct the Human Development Index (HDI). To examine the sensitivity of our estimates to this choice of income measure, we re-estimate all the specifications using real GNI per capita. Table A.3 and Figure A.14 in the Supplementary Appendix show that our results are robust to this change in the definition of the variable that proxies for real income per person.
Our final robustness check is concerned with alternative ways of measuring unemployment prevalence. The literature suggests that being unemployed is associated with a higher suicide risk (Chen et al. Citation2012). However, the suicide rates and unemployment rates that we use in our estimation have different reference levels. While the former measures the number of suicides in the total population, the latter reports the number of unemployed individuals relative to the labour force. To address this potential concern, we re-estimate all specifications after replacing the unemployment rate with the fraction of unemployed individuals in the total population. Our results are not sensitive to this change in the measure of unemployment prevalence (see Figure A.16 in the Supplementary Appendix for determinants of total suicide mortality in 2019).
Our analysis is subject to several limitations. First, we do not consider endogeneity problem which is common to empirical studies on suicidality (see Lepori et al., (Citation2024) and references therein). In line with other model averaging studies, our analysis reports robust associations between suicide mortality and its potential determinants. However, it does not control for the potential reverse causality. For instance, higher suicide prevalence in a country may lead to higher alcohol consumption among its residents. Furthermore, higher suicide mortality may lead to a deterioration of mental health in the community, with negative effects on socioeconomic measures.
Our results rely on a number of homogeneity assumptions imposed on the parameters of suicide determinants across countries and over time. These are related to i.i.d. disturbances in WALS regressions, a common intercept in cross-sectional regressions, and variation in measurement errors across countries and their evolution over time. First, there are several considerations regarding the heterogeneity in the data quality used in the present study. Along the cross-country dimension, the variation in measurement errors in suicide rates and their potential determinants likely depends on both included variables (e.g. GDP per capita) and omitted factors (e.g. legality of suicide, cultural norms). For example, suicide under-reporting or misclassification is more likely in countries where it is illegal (Wu et al. Citation2022). The problem of undercounting tends to be more severe for female suicides rather than male suicides, given the disproportionate use of poisons and drugs by females in their suicides (Rockett et al., Citation2020).
Second, our approach implicitly assumes that the quality of the data remains constant over the 20-year period considered. However, it is more plausible that the data quality has improved over time, thereby reducing the attenuation bias. While this might partially explain the increasing importance of certain factors over time (e.g. life expectancy at age 65), it also reinforces the results, indicating the decreased importance of other determinants (e.g. religious affiliations).
Third, for each estimated cross-section, we assume a common intercept for all countries. For instance, Bruns and Ioannidis (Citation2020) demonstrate that using continent-specific intercepts tends to improve the stability of inferences over time in BMA studies. To assess this cross-country parameter homogeneity, we follow the growth empirics literature and re-estimate all specifications after including six dummy variables corresponding to the WHO regional classification. While this approach decreases efficiency by increasing the parameter space, the results remain qualitatively similar to the baseline case (see Figure A.17 of the Supplementary Appendix).
Lastly, our choice of regressors is affected by the availability of comparable data. As a result, we cannot incorporate certain potentially important factors, such as income inequality or divorce prevalence, without significantly decreasing the sample size. Furthermore, in the interest of restricting the parameter space, we do not consider the effects of nonlinearities, interactions, or alternative lag structures.
V. Conclusion
Our application of the model averaging approach indicates that some inferences are unstable across time. Suicide determinants related to religious affiliation tend to become less important in recent years. The opposite is true for non-educational measures of human capital, such as life expectancy at age 65, and labour market variables, such as unemployment. On the other hand, many inferences exhibit a remarkable degree of stability. Life expectancy at birth remains the most robust protective factor for the entire 20-year period. Many variables, such as age dependency ratio or precipitation, show no statistical robustness at any time.
Extending our analysis to male and female suicide rates reveals the fact that importance of certain factors is clearly sex-dependent. For example, our estimation suggests a null association between female labour force participation and male suicide mortality. Yet, we observe its robust negative association with female rates for 2000–2006. Evolution of robustness over time is also sex-dependent for several suicide determinants. For instance, affiliation with Christianity is negatively associated with female suicide mortality. While its degree of statistical robustness is diminishing over time, it remains above the significance threshold. In contrast, affiliation with Christianity is not a robust determinant of male suicide rates for both decades.
Our results show that suicide rates are robustly associated with modifiable factors, which indicates some potential for policy intervention. However, our analysis is associational rather than causal, and the results should be interpreted with caution, especially when considering policy. The results provide some empirical support for causal theoretical mechanisms that connect suicidality with socioeconomic factors and therefore offer policy implications. For instance, the robustness of life expectancy at birth and its negative association with suicide prevalence lends some support to economic theories of suicide (Hamermesh and Soss Citation1974; Koo and Cox Citation2008). These mechanisms suggest that policies directed at extending life expectancy at birth should also reduce suicide mortality. On the other hand, the emergence of life expectancy at age 65 as a robust suicide risk factor might indicate increasing importance of the gap between lifespan and healthspan. For instance, Garmany et al. (Citation2021) indicate that the observed steady rise in lifespan has not been met with a proportionate increase in healthspan, i.e. the years lived free from disease. They discuss policies and initiatives that address the lifespan-healthspan gap across communal, clinical, and research dimensions. Our results tentatively suggest that such interventions might also lower suicide rates associated with age-related frailty.
Supplemental Material
Download PDF (1 MB)Disclosure statement
No potential conflict of interest was reported by the author(s).
Supplementary Material
Supplemental data for this article can be accessed online at https://doi.org/10.1080/00036846.2024.2372117
References
- An, S., S. Lim, H. W. Kim, H. S. Kim, D. Lee, E. Son, T. W. Kim, T. S. Goh, K. Kim, and Y. H. Kim. 2023. “Global Prevalence of Suicide by Latitude: A Systematic Review and Meta-Analysis.” Asian Journal of Psychiatry 81:103454. https://doi.org/10.1016/j.ajp.2023.103454.
- Arya, V., A. Page, J. River. 2018. “Trends and Socio-Economic Determinants of Suicide in India: 2001–2013.” Social Psychiatry & Psychiatric Epidemiology 53: 269–278. https://doi.org/10.1007/s00127-017-1466-x.
- Bayale, N. 2022. “Empirical Investigation into the Determinants of Foreign Aid in Sahel Countries: A Panel Bayesian Model Averaging Approach.” Defence and Peace Economics 33:306–326. https://doi.org/10.1080/10242694.2020.1827184.
- Botha, F., and V. H. Nguyen. 2022. “Opposite Nonlinear Effects of Unemployment and Sentiment on Male and Female Suicide Rates: Evidence from Australia.” Social Science & Medicine 292:114536. https://doi.org/10.1016/j.socscimed.2021.114536.
- Breuer, C. 2015. “Unemployment and Suicide Mortality: Evidence from Regional Panel Data in Europe.” Health Economics 24:936–950. https://doi.org/10.1002/hec.3073.
- Brock, W. A., and S. N. Durlauf. 2001. “Growth Empirics and Reality.” The World Bank Economic Review 15 (2): 229–272. https://doi.org/10.1093/wber/15.2.229.
- Bruns, S. B., and J. P. A. Ioannidis. 2020. “Determinants of Economic Growth: Different Time Different Answer?” Journal of Macroeconomics 63:103185. https://doi.org/10.1016/j.jmacro.2019.103185.
- Burr, J. A., P. L. Mccall, and E. Powell-Griner. 1994. “Catholic Religion and Suicide: The Mediating Effect of Divorce.” Social Science Quarterly 75 (2): 300–318.
- Burr, J. A., P. L. McCall, and E. Powell-Griner. 1997. “Female labor force participation and suicide.” Social Science & Medicine 44:1847–1859. https://doi.org/10.1016/S0277-9536(96)00294-8.
- Bussu, A., C. Detotto, and V. Sterzi. 2013. “Social Conformity and Suicide.” Journal of SocioEconomics 42:67–78. https://doi.org/10.1016/j.socec.2012.11.013.
- Cai, Z., M. Chen, P. Ye, and P. S. F. Yip. 2022. “Socio-Economic Determinants of Suicide Rates in Transforming China: A Spatial-Temporal Analysis from 1990 to 2015.” The Lancet Regional Health - Western Pacific 19:100341. https://doi.org/10.1016/j.lanwpc.2021.100341.
- Chen, J., Y. J. Choi, K. Mori, Y. Sawada, and S. Sugano. 2012. “Socio-Economic Studies on Suicide: A Survey.” Journal of Economic Surveys 26:271–306. https://doi.org/10.1111/j.1467-6419.2010.00645.x.
- Chen, Y. Y., M. Chen, C. S. M. Lui, and P. S. F. Yip. 2017. “Female Labour Force Participation and Suicide Rates in the World.” Social Science & Medicine 195:61–67. https://doi.org/10.1016/j.socscimed.2017.11.014.
- Ciccone, A., and M. Jarociński. 2010. “Determinants of Economic Growth: Will Data Tell?.” American Economic Journal Macroeconomics 2 (4): 222–246. 10.1257/mac.2.4.222.
- Clyde, M. 2000. “Model Uncertainty and Health Effect Studies for Particulate Matter.” Environmetrics 11:745–763. https://doi.org/10.1002/1099-095X(200011/12)11:6<745:AID-ENV431>3.0.CO;2-N.
- De Luca, G., J. R. Magnus, and F. Peracchi. 2018. “Weighted-Average Least Squares Estimation of Generalized Linear Models.” Journal of Econometrics 204:1–17. https://doi.org/10.1016/j.jeconom.2017.12.007.
- De Luca, G., J. R. Magnus, and F. Peracchi. 2023. “Weighted-Average Least Squares (WALS): Confidence and Prediction Intervals.” Computational Economics 61:1637–1664. https://doi.org/10.1007/s10614-022-10255-5.
- Fountoulakis, K. N., I. Chatzikosta, K. Pastiadis, P. Zanis, W. Kawohl, A. J. F. M. Kerkhof, A. Navickas, et al. 2016. “Relationship of Suicide Rates with Climate and Economic Variables in Europe During 2000–2012.” Annals of General Psychiatry 15 (1): 19. https://doi.org/10.1186/s12991-016-0106-2.
- Garmany, A., S. Yamada, and A. Terzic. 2021. “Longevity Leap: Mind the Healthspan Gap.” Npj Regenerative Medicine 6 (1): 57. https://doi.org/10.1038/s41536-021-00169-5.
- Grechyna, D. 2016. “On the Determinants of Political Polarization.” Economics Letters 144:10–14. https://doi.org/10.1016/j.econlet.2016.04.018.
- Hamermesh, D. S., and N. M. Soss. 1974. “An Economic Theory of Suicide.” Journal of Political Economy 82:83–98. https://doi.org/10.1086/260171.
- Hans, C. M., M. Peruggia, and J. Wang. 2023. “Empirical Bayes Model Averaging with Influential Observations: Tuning Zellner’s G Prior for Predictive Robustness.” Econometrics and Statistics 27:102–119. https://doi.org/10.1016/j.ecosta.2021.12.003.
- Helliwell, J. F. 2007. “Well- Being and Social Capital: Does Suicide Pose a Puzzle?” Social Indicators Research 81:455–496. https://doi.org/10.1007/s11205-006-0022-y.
- Hoeting, J. A., D. Madigan, A. E. Raftery, and C. T. Volinsky. 1999. “Bayesian Model Averaging: A Tutorial.” Statistical Science 14 (4): 382–401. https://doi.org/10.1214/ss/1009212519.
- Ilgun, G., B. Yetim, S. Demirci, and M. Konca. 2020. “Individual and Socio-Demographic Determinants of Suicide: An Examination on WHO Countries.” The International Journal of Social Psychiatry 66 (2): 124–128. https://doi.org/10.1177/0020764019888951.
- Jalles, J. T., and M. A. Andresen. 2015. “The Social and Economic Determinants of Suicide in Canadian Provinces.” Health Economics Review 5:1. https://doi.org/10.1186/s13561-015-0041-y.
- Kabaila, P., and R. Mainzer. 2018. “Two Sources of Poor Coverage of Confidence Intervals After Model Selection.” Statistics & Probability Letters 140:185–190. https://doi.org/10.1016/j.spl.2018.05.001.
- Koo, J., and W. M. Cox. 2008. “An Economic Interpretation of Suicide Cycles in Japan.” Contemporary Economic Policy 26:162–174. https://doi.org/10.1111/j.1465-7287.2007.00042.x.
- Lari, M., and S. Emamgholipour. 2023. “Socio-Economic, Health and Environmental Factors Influencing Suicide Rates: A Cross-Country Study in the Eastern Mediterranean Region.” Journal of Forensic and Legal Medicine 93:102463. https://doi.org/10.1016/j.jflm.2022.102463.
- Lepori, G. M., S. Morgan, B. A. Assarian, and T. Mishra. 2024. “Economic Activity and Suicides: Causal Evidence from Macroeconomic Shocks in England and Wales.” Social Science & Medicine 342:116538. https://doi.org/10.1016/j.socscimed.2023.116538.
- Luca, G. D., and J. R. Magnus. 2011. “Bayesian Model Averaging and Weighted-Average Least Squares: Equivariance, Stability, and Numerical Issues.” The Stata Journal 11 (4): 518–544. https://doi.org/10.1177/1536867X1201100402.
- Magnus, J. R., and G. De Luca. 2016. “Weighted-Average Least Squares (WALS): A Survey.” Journal of Economic Surveys 30:117–148. https://doi.org/10.1111/joes.12094.
- Magnus, J. R., O. Powell, and P. Prufer. 2010. “A Comparison of Two Model Averaging Techniques with an Application to Growth Empirics.” Journal of Econometrics 154:139–153. https://doi.org/10.1016/j.jeconom.2009.07.004.
- Masanjala, W. H., and C. Papageorgiou. 2008. “Rough and Lonely Road to Prosperity: A Reexamination of the Sources of Growth in Africa Using Bayesian Model Averaging.” Journal of Applied Econometrics 23:671–682. https://doi.org/10.1002/jae.1020.
- Matsubayashi, T., and M. Ueda. 2011. “The Effect of National Suicide Prevention Programs on Suicide Rates in 21 OECD Nations.” Social Science & Medicine 73:1395–1400. https://doi.org/10.1016/j.socscimed.2011.08.022.
- Meda, N., A. Miola, I. Slongo, M. A. Zordan, and F. Sambataro. 2022. “The Impact of Macroeconomic Factors on Suicide in 175 Countries Over 27 Years.” Suicide and Life-Threatening Behavior 52:49–58. https://doi.org/10.1111/sltb.12773.
- Milner, A., R. McClure, and D. De Leo. 2012. “Socio-Economic Determinants of Suicide: An Ecological Analysis of 35 Countries.” Social Psychiatry & Psychiatric Epidemiology 47:19–27. https://doi.org/10.1007/s00127-010-0316-x.
- Minoiu, C., and A. R. Andres. 2008. “The Effect of Public Spending on Suicide: Evidence from U.S. State Data.” The Journal of Socio-Economics 37:237–261. https://doi.org/10.1016/j.socec.2006.09.001.
- Mobley, K., and G. Taasoobshirazi. 2022. “Predicting Suicide in Counties: Creating a Quantitative Measure of Suicide Risk.” International Journal of Environmental Research and Public Health 19:8173. https://doi.org/10.3390/ijerph19138173.
- Moral-Benito, E. 2015. “Model Averaging in Economics: An Overview.” Journal of Economic Surveys 29:46–75. https://doi.org/10.1111/joes.12044.
- Neumayer, E. 2003. “Are Socioeconomic Factors Valid Determinants of Suicide? Controlling for National Cultures of Suicide with Fixed-Effects Estimation.” Cross-Cultural Research 37:307–329. https://doi.org/10.1177/1069397103253708.
- Oka, M., T. Kubota, H. Tsubaki, and K. Yamauchi. 2015. “Analysis of Impact of Geographic Characteristics on Suicide Rate and Visualization of Result with Geographic Information System.” Psychiatry and clinical neurosciences 69:375–382. https://doi.org/10.1111/pcn.12254.
- Okada, K., and S. Samreth. 2013. “A Study on the Socio-Economic Determinants of Suicide: Evidence from 13 European OECD Countries.” The Journal of Socio-Economics 45:78–85. https://doi.org/10.1016/j.socec.2013.04.009.
- Oliveira, C. R., E. D. Shapiro, and D. M. Weinberger. 2022. “Bayesian Model Averaging to Account for Model Uncertainty in Estimates of a Vaccine’s Effectiveness.” Clinical Epidemiology 14:1167–1175. https://doi.org/10.2147/CLEP.S378039.
- Osterloh, S. 2012. “Words Speak Louder Than Actions: The Impact of Politics on Economic Performance.” Journal of Comparative Economics 40:318–336. https://doi.org/10.1016/j.jce.2012.05.004.
- Phillips, J. A., and C. N. Nugent. 2014. “Suicide and the Great Recession of 2007–2009: The Role of Economic Factors in the 50 U.S. States.” Social Science & Medicine 116:22–31. https://doi.org/10.1016/j.socscimed.2014.06.015.
- Raftery, A. E. 1995. “Bayesian Model Selection in Social Research.” Sociological Methodology 25:111–163. https://doi.org/10.2307/271063.
- Rockett, I. R. H., E. D. Caine, H. S. Connery, K. B. Nolte, P. S. Nestadt, L. S. Nelson, and J. Haomiao. 2020. “Unrecognised Self-Injury Mortality (SIM) Trends Among Racial/Ethnic Minorities and Women in the USA.” Injury Prevention 26:439–447. https://doi.org/10.1136/injuryprev-2019-043371.
- Salman, K., A. Vajihe, N. Shahrzad, R. Shahab, and K. Somayeh. 2017. “Suicide Rate in Relation to the Human Development Index and Other Health Related Factors: A Global Ecological Study from 91 Countries.” Journal of Epidemiology and Global Health 7 (2): 131–134. https://doi.org/10.1016/j.jegh.2016.12.002.
- Shoib, S., A. Y. Armiya’u, M. Nahidi, N. Arif, and F. Saeed. 2022. “Suicide in Muslim World and Way Forward.” Health Science Reports 5 (4): e665. https://doi.org/10.1002/hsr2.665.
- Steel, M. F. J. 2020. “Model Averaging and Its Use in Economics.” Journal of Economic Literature 58 (3): 644–719. https://doi.org/10.1257/jel.20191385.
- World Health Organization. 2021. Suicide Worldwide in 2019: Global Health Estimates. Report. Geneva.
- Wu, K. C. C., Z. Cai, Q. Chang, S. S. Chang, P. S. F. Yip, and Y.-Y. Chen. 2022. “Criminalisation of Suicide and Suicide Rates: An Ecological Study of 171 Countries in the World.” British Medical Journal Open 12 (2): e049425. https://doi.org/10.1136/bmjopen-2021-049425.
- Wu, W. C. H., and M. H. Bond. 2006. “National Differences in Predictors of Suicide Among Young and Elderly Citizens: Linking Societal Predictors to Psychological Factors.” Archives of Suicide Research 10 (1): 45–60. https://doi.org/10.1080/13811110500318430.