
 ?Mathematical formulae have been encoded as MathML and are displayed in this HTML version using MathJax in order to improve their display. Uncheck the box to turn MathJax off. This feature requires Javascript. Click on a formula to zoom.
ABSTRACT
This paper models the financial risk associated with the cost of turbine failures over the lifetime of a wind farm. These failures cause significant variation in realized profit on wind generation projects. A model of the fault generating process is presented and industry data is used to parameterize the model. The model is then used to measure the financial risk associated with the wind project. Risks are measured using the financial metrics Value at Risk (VaR) and Conditional VaR (CVaR) metrics. The study shows that the 95% lifetime VaR of a turbine is equivalent to 52% of the initial capital expenditure. However, as the number of turbines in a farm increases, this risk diminishes. These findings have significant implications for small-scale projects, particularly community projects.
I. Introduction
There is a global effort to decarbonize power generation by using renewable energy in response to climate change (Balsalobre-Lorente et al. Citation2023), with wind energy becoming increasingly popular. Increased wind capacity lowers the mean and variance of production costs (Lynch and Curtis Citation2016), strengthening financial resilience and market stability. However, wind farms face significant risks from turbine component failures. Initially, wind energy profitability relied on government subsidies, but as the industry moves towards full commercialization, understanding failure risks’ impact on profitability is crucial, especially for new investors and community-based projects with smaller turbines which may not purchase a long-term guarantee from the manufacturer (Leaney et al. Citation2001). This paper aims to highlight the financial impact of failure risks, offering valuable insights for investors, insurers, and industry practitioners by developing a method to estimate and quantify these risks using investment finance measures.
The Chartered Institute of Management Accounts defines operational risks as those arising from an entity’s structure, systems, people, products, or processes (Collier Citation2005). In manufacturing, these risks involve physical asset damage, system failures, and employee safety. Financial losses from wind turbine failures include energy sales loss (opportunity cost) and replacement equipment costs (direct cost) (Rieger Citation2004). This study focuses on uncertainty in random failures that can cause significant financial losses. High-risk projects, like small-scale community projects, often struggle to secure institutional finance, hindering renewable energy investment growth (Gabriel Citation2016).
According to Modern Portfolio Theory, investors can reduce overall portfolio risk by diversifying their investments across uncorrelated assets (Mangram Citation2013). In the wind energy industry, this means having multiple turbines in a farm to ensure continued power generation if one turbine fails. Turbines operate independently, so a failure in one, such as from a lightning strike, does not affect others. This is the same for failures of components such as generators, blades, and gearboxes. Financial theory uses measures like standard deviation and value at risk to analyse the benefits of this diversification given the industry characteristics of market fluctuations and technical uncertainties (Du and Li Citation2019). Whilst, regulatory authorities are faced with the challenge of developing policy measures that can mitigate these risks and encourage diversification of investment portfolios in renewable energy infrastructure.
Many studies on wind turbine failures are limited by data quality and availability (Leahy et al. Citation2019; J. Li et al. Citation2016). This study addresses this problem by using Weibull distributions fitted to industry turbine failure data, enhancing precision over studies relying solely on average failure rates. It extends the analysis to include financial risk and farm size, developing a model that captures random failure processes. This model generates failure profiles, measuring the financial risk of a wind project over its typical 20-year life (Ziegler et al. Citation2018). Value at Risk (VaR) and Conditional VaR (CVaR) are adopted to measure risk consistently and effectively.
Results are normalized relative to initial CapEx to compare wind farm sizes. The total expected repair cost over a turbine’s lifetime is 22% of CapEx. In 5% of worst-case scenarios (95% VaR), this cost exceeds 52%, with CVaR at 63%. VaR and CVaR values decrease as the number of turbines increases, suggesting risk reduction through diversification. The study highlights the importance of deploying multiple turbines to mitigate financial risks from individual failures. Focusing on the onshore wind industry, a 2.5 MW turbine was analysed, reflecting typical capacities (Lantz Citation2013; Serrano‐González and Lacal‐Arántegui Citation2016; Tazi, Châtelet, and Bouzidi Citation2017).
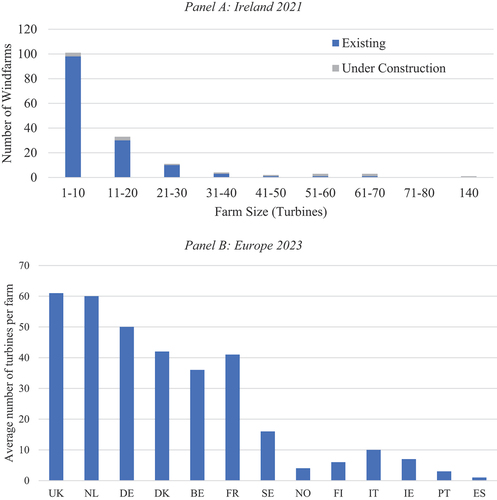
shows the number of turbines in European wind farms. Panel A details Ireland, where most farms have fewer than 15 turbines, but larger projects are emerging. Panel B gives an overview of Europe. The UK leads with an average of 61 turbines per farm, indicating significant investment. The Netherlands follows with 60, Germany with 50, and Denmark with 42 turbines per farm. These figures highlight a trend towards larger wind farms to meet renewable energy targets.
Figure 1. Turbines in European wind farms.
This study offers several contributions to the literature and wind energy industry. First, it provides a generic model for practitioners to assess risk profiles, applicable to any industry relying on complex equipment. Second, it scales standard financial metrics by CapEx, offering a common language for operators and investors to understand wind farm risks, aiding in better risk hedging strategies. Third, it highlights the relationship between risk and wind farm size, relevant for small-scale and community projects. Finally, it aids project planning by providing insights into the optimal number of turbines for efficient operations, particularly valuable for small community projects and wind energy initiatives in developing countries.
The rest of the paper is organized as follows: section two provides an extensive review of the existing literature. In section three, the data and method are detailed, explaining how the random processes and parameters are modelled and failures are transformed to financial risks. The results are presented in section four. The paper ends with discussion and conclusion in section five.
II. Literature review
This section reviews the literature to first explain how risks affect wind energy industry focusing on risks from turbines’ failures. Second, the effect of size in wind farms is reviewed to understand the studied relationship between size of the farm and the financial losses from operational risks.
Wind energy associated risks
The Global Wind Energy Council (GWEC) shows that wind energy industry is growing fast as nations pledge to meet 2030–2050 science-based targets for reducing greenhouse gas emissions (Lee and Zhao Citation2022). In 2021 Europe installed 19.8 GW of new wind power capacity which is 18% more than in 2020 (Wind Europe Citation2022). However, the technological advancement has shaped the wind energy industry resulting in more complex operational risks, requiring a more sophisticated approach to risk modelling. The wind energy sector requires substantial upfront investment (Pookpunt, Ongsakul, and Madhu Citation2020), expensive equipment, and long production cycles spanning up to 25 years (Zaoui et al. Citation2022). Operational and maintenance costs are uncertain, amidst political pressures for energy security and carbon emission reduction (Rashid Khan et al. Citation2021). These factors introduce risks challenging both investors and operators.
Previous studies have researched wind energy project risks. Sonnberger and Ruddat (Citation2017); Broughel and Wüstenhagen (Citation2022); and Lorente et al. (Citation2023) showed that political risks can impact wind energy projects but Krane and Idel (Citation2021) proved that wind energy can reduce political risks from other non-renewable sources. Other risks affecting wind energy are environmental risks as studied in (Kucukali Citation2016, Nazir et al. Citation2019), investment and financing risks (Erfani and Tavakolan Citation2023; Lei et al. Citation2020; Qiu et al. Citation2020; Zhou and Yang Citation2020), and risk from operations and maintenance as discussed in (C. B. Li, Li, and Feng Citation2014; Weaver Citation2012; Zhou and Yang Citation2020).
To provide a comprehensive view of the topic, studies analysing the cost structure of wind energy projects have demonstrated that, after project commissioning, most of the costs come from operation and maintenance (O&M) (Lau Citation2020; Wagner Citation2018). These costs which pose financial risks to projects account for 20%–25% of the total levelized cost of electricity (LCOE) of the current wind power systems (Costa et al. Citation2021). Unscheduled repairs due to random or unexpected failures is the biggest drivers of these costs (Kim et al. Citation2011). For a comprehensive review of operation issues in wind farms see Costa et al. (Citation2021) and Ren et al. (Citation2021).
Froger et al. (Citation2018) find that wind turbine repairs are typically outsourced to third parties by investor-owned farms, leading to operational challenges due to conflicting interests. Investors aim to minimize costs post-initial investment, while repair companies (often the original equipment manufacturer) seek higher spending to uphold product reputation. They propose condition-based maintenance strategies for turbine failures. However, Tazi et al. (Citation2016) argue that addressing reliability issues starts with meticulous project design, considering environmental constraints, manufacturing defects, costs, and the system’s global warming potential.
Nielsen and Sørensen (Citation2011) examined offshore wind turbine operations, finding that turbine failures significantly impact energy costs, necessitating risk mitigation planning. However, their analysis treated turbines as single components, overlooking their complex sub-assembly structure. Likewise, J. Li et al. (Citation2016) assessed operational risks focusing solely on converters and condition monitoring, using wind turbine outage probability as a risk measure. Our study addresses this gap by analysing multiple turbine components, emphasizing those most prone to failures.
Bezrukovs and Sauhats (Citation2017) evaluated economic and operational risks in wind projects, considering environmental (wind speed), economic (electricity market prices), and technical factors. Their study projected revenue and efficiency using stochastic models and Monte Carlo simulations. However, the study was limited to Latvia and only generators were considered. We fill this research gap by using a generic turbine structure and capacity and incorporate both financial and technical factors to assess risks posed by turbine failures.
Turbine failures in different wind farm sizes
The size of the farm is a crucial factor to considered when studying turbine failure risks in wind energy industry. Research has demonstrated the presence of economies of scale in various industries including power generation (Bejan, Almerbati, and Lorente Citation2017; Christensen and Greene Citation1976; Hisnanick and Kymn Citation1999; Triebs et al. Citation2016). As firms expand their scale of operations, they can often achieve lower average costs per unit of output, benefiting from factors such as bulk purchasing, specialization, and efficient use of resources. However, alongside these cost advantages, there can also be increased risks associated with larger-scale operations. These risks arise due to the complexity and interdependencies that come with larger operations, including supply chain disruptions, technological failures, and regulatory challenges. To balance the risk versus farm size paradigm, Altuntas, Berry-Stölzle, and Cummins (Citation2021) argued that economies of scale benefits are best obtained with proper risk management practices.
Failure-related risks are presented in (Lin et al. Citation2016), where the increase in capacity and turbine size is linked to increase in failures in turbine components. The findings showed that most wind turbine failures are due to failures of generators, gearboxes, or blades. The insurance market statistics listed that 85% of the failure claims come from these three components (Campbell Citation2015). Giglio, Friar, and Crittenden (Citation2018) show that management of assets including proper maintenance of infrastructure is essential for long-term economic viability of assets. Poorly maintained infrastructure causes risks of delays and damage in short run, while in the long run there is an increase in cost of disposal and reconstruction.
Nowakoski and Loomis (Citation2023) analyse how project size influences the success of the wind energy industry, illustrating through case studies how scalability impacts product design and technology. The cost of electricity production was reduced more than six-fold over time. They highlight the industry’s recognition of economies of scale, leading to the commercialization of larger wind turbines and a substantial reduction in electricity production costs over time. Yeter, Garbatov, and Soares (Citation2020) propose a risk-based maintenance strategy for offshore wind turbines, determining the optimal number of turbines for minimizing the levelized cost of energy. Their assessment accounts for various farm sizes, showing a significant decrease in electricity cost as the number of turbines increases, but costs begin to rise once the total exceeds 60 turbines.
Dismukes and Upton (Citation2015) presented a model to test for economies of scale and learning effects. Both country-specific and industry-wide learning effects were analysed using a European offshore wind project. Their findings showed that the costs did not exhibit economies of scale and there was no robust evidence of a learning effect. However, although the sample was rich, it was heterogeneous in nature. Hence, they used the overnight cost (the cost of each project estimated separately) to aid comparison. Ederer (Citation2015) evaluated the capital and operating cost-efficiency of offshore wind projects. Cost was related to the issues of distance to the shore and water depth.
In contrast to other wind energy risk studies, this study analyzes risks from wind turbine failures by using two risk metrics, VaR and CVaR. A combination of reliability analysis and financial analysis is presented by using Weibull distributions, Monte-Carlo simulations, and cost analysis. The paper investigates how the number of turbines in wind farms impacts the financial risk associated with turbine failures. The study approach involves assessing the risk profile of individual turbines and subsequently extending these findings to wind farms.
III. Data and method
Data
The analysis uses annual turbine failure rates data, cost of repair, and electricity market prices. Turbine failures are split into the three categories that dominate faults; generator, gearbox, and blades (Campbell Citation2015). This allows a specific failure process to be modelled for each category. The study first examines an individual wind turbine, followed by aggregation of turbines to understand the effect of size in wind farms. The failure rates of generators and direct repair cost of the turbine components are obtained from Lantz (Citation2013). Tazi, Châtelet, and Bouzidi (Citation2017) provide the failure rates of wind turbine gearboxes and blades, .
Table 1. Turbine component failures: 10 years since commissioning.
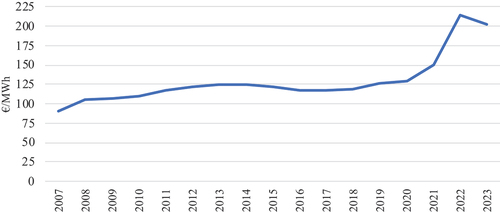
Electricity price data is taken from the Sustainable Energy Authority of Ireland (SEAI Citation2023). The analysis uses the European (EU 27) long term average price €125.11 per MWh, taken over the period 2007 to 2023 (). This price is used as a proxy to prices paid to wind farmers. The price is adjusted for inflation using the European average inflation rate of 2.05% (Eurostat Citation2023; Trading Economics Citation2023; Webster Citation2023).
Figure 2. Electricity prices (EU27).
Discount rates
This study uses a discount rate of 7% a typical representative value for discount rates in onshore wind projects, based on data collected for a wide range of EU countries. However, discount rates are specific to individual projects, as they can vary across countries (Steffen Citation2020; Roth et al. Citation2021) and within countries, due to idiosyncratic differences across projects or industry factors (Saługa et al. Citation2021), including variables such as the investing company’s age and size (Garcia et al. Citation2016).
Steffen (Citation2020) surveyed the literature for the cost of capital across a range of countries and renewable technologies over the period 2009–2017. He provided estimates for 23 EU countries for onshore wind. The results show significant differences across countries from 3.0% in Germany to 11.7% in Greece, with a mean value of 7.8%. However, most of the estimates are dated to 2014 and there is some evidence of a downward trend over time.
Roth et al. (Citation2021) present a more recent survey of renewable energy projects across Europe. The paper presents the average cost of capital for onshore wind projects in 19 countries, along with the maximum and minimum reported for each country, see , gathered from November 2019 to April 2020. The average cost of capital is 5.5%, but again there is considerable variation between countries which ranges from 1.9% to 9.1%.
Figure 3. EU cost of capital for onshore wind projects.
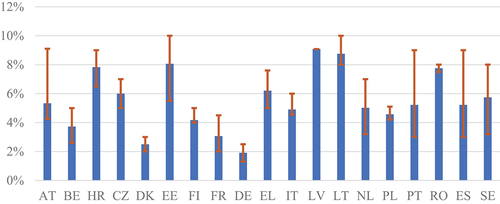
The representative rate of 7% selected for our analyses lies between the mean values of Roth et al. (Citation2021) and Steffen (Citation2020). It is also consistent with the generic 6.5% to 9% range noted by the International Energy Agency (IEA Citation2020) for renewable energy and their central estimate for commercial power generation of 7% (IEA Citation2020). The results of both Steffen (Citation2020) and Roth et al. (Citation2021) highlight the difficulty in defining a standard base rate. Both show significant cross-sectional variation across countries, while Roth et al. (Citation2021) also identifies differences within countries with 63% of the countries have a range above 2% between maximum and minimum cost of capital, with a maximum range of 6%. Stress testing demonstrates that results are robust for any reasonable discount rate.
Method
Turbine failure processes are modelled using Weibull processes, with unique parameters estimated for generators, gearboxes, and blades. An optimization process tailors the distributions using industry data. Monte Carlo simulation estimates fault distribution over a turbine’s lifetime, converting simulated failures into financial costs and risk distributions. VaR and CVaR metrics describe the outcomes, where failure is defined as damage requiring a complete component replacement and halting power generation.
Optimisation process
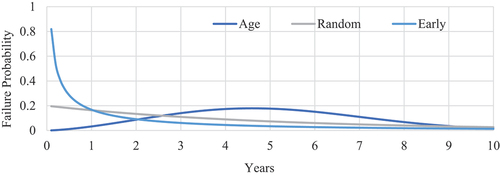
The use of a Weibull distribution is a standard statistical method used in modelling engineering failures (Hribar and Duka Citation2010) and has been used to model failures in power systems (dos Santos and de Barros Citation2015), electrical components and space craft (Imken et al. Citation2018). The Weibull distribution is defined by two parameters, k and , referred to as shape and scale, respectively. The value of
defines the dominant failure mode, with
indicating early failures and
indicating increasing failures from age. Random failures are indicated by
, see .
Figure 4. Weibull failure distributions.
The probability density function (pdf) of the Weibull distribution is-
where t is the time to failure, is the shape parameter, determining the shape of the distribution and
is the scale parameter, representing the characteristic life. The distribution is only defined for
and
and
are positive,
and
have the same units, in our case years, while
is a scalar. The cumulative distribution function (cdf) is-
An optimization process is used to find the combination shape and scale parameters that provide the closest fit between the expected failure rates generated by the Weibull distribution and the failure rates observed in commercial wind farms. The best fit is defined as the lowest sum of square errors (the difference between the estimated and observed failure rates) across the range of observed data. The expected failure rate in a year, , for a given pair of parameters
and
is-
The optimization process finds the values of and
that minimize the objective function
.-
is observed failure rate in year t and T is the sample size.
Cost of faults
The cost of a single failure is the sum of direct cost (the cost of repair) and opportunity cost, (the lost energy sales due to downtime). All cost are discounted to the commissioning date of the turbine, that is .-
is discounted cost of fault n,
is the time of the fault,
is the discount rate,
is the direct repair cost,
is the opportunity cost. The simulated faults are summed over the life-time of a turbine to get the total cost of failure-
The opportunity cost of a turbine failure is the lost revenue from energy sales that would have been made had the wind turbine remained operational. The opportunity cost is a function of the installed capacity, IC, utility factor, U, price, , and downtime,
.-
Installed capacity is the wind turbine’s maximum production in megawatts (MW); utility factor, set at 24% according to IEA (Citation2020), is the average power produced divided by installed capacity. Downtime is the loss of energy generation measured in hours from fault occurrence to repair completion. Price is in € per Megawatt-hour. Fault occurring until repair is complete. Price is expressed in € per Megawatt-hour.
Financial risk is assessed using VaR and CVaR (Hull Citation2014). VaR determines the maximum potential loss over a specified time and confidence level, commonly used by traders, fund managers, and financial institutions. It offers a single metric summarizing portfolio risk. This study adopts a 95% confidence level over a turbine’s 20-year lifespan. CVaR, also known as estimated tail loss, calculates the average potential loss exceeding the VaR threshold. While VaR measures potential loss at a certain probability level, CVaR estimates the expected loss in worst-case scenarios beyond the VaR level. VaR and CVaR are measured through a Monte Carlo simulation. The present value of the total cost of faults is repeatedly measured. The values are then ranked, the 95th percentile value is the VaR, and the average of all values above the 95th percentile is the CVaR.
Results are presented as a percentage of the initial CapEx to enable comparisons across wind farms of varying sizes. The CapEx of wind energy generation encompasses turbine, foundation, electric installation, grid connection, control systems, consultancy, land, financial costs, and roads. This approach facilitates the assessment of cost-effectiveness and efficiency over a wind project’s lifespan and allows for comparisons between wind farms of different scales. Wind Europe (Citation2022) offers data on investments in Europe, reporting 19.8GW installed capacity at €24.8 billion, resulting in an average CapEx of €1.25 million per megawatt installed.
IV. Results
The results are presented in three sections: the failure distributions that provide the basis of the Monte Carlo simulations, cost quantification of turbine component failures, and risk profiles of wind farms over their operational life. This final section presents the key findings of the paper, the distributions of costs due to random fault process, the quantification of the risk in terms of VaR and CVaR, and the relationship between windfarm size and investment risk.
Failure distributions
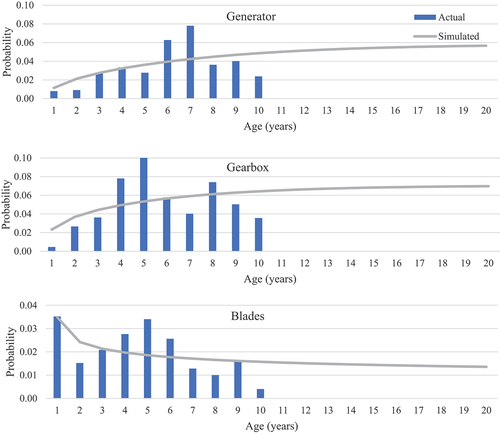
Weibull distribution parameters, derived from industry data through optimization (Section 3.3.1, ), reveal distinctions among turbine components. Gearboxes and generators exhibit scales close to the turbine’s typical lifetime, with shape values above one, suggesting wear as the primary failure cause. In contrast, blades have a shape parameter below one, indicating a longer lifespan, often surpassing other components. This corresponds with literature highlighting recycling challenges for used blades (Liu, Meng, and Barlow Citation2022; Nagle et al. Citation2022).
Table 2. The modelled failure parameters.
Industry data availability is limited to the first half of the turbines’ operational life and statistical processes are used to model failure distributions over the lifetime of a turbine. The simulation uses Weibull distributions to model the failure behaviour of wind turbine components over time. Industry and simulated annual failure rates are presented in .
Figure 5. Industry vs simulated failure probabilities.
Failure distributions of a single turbine are presented in , first showing failure probability in turbine components (Panel A) and then in total (Panel B). Gearboxes have the highest number of failures followed by generators and then blades. The probability of having one failure is 50% for generators and 43% for gearboxes. More failures are displayed in gearboxes compared to generators, with higher probability of multiple failures. There is an 83% probability that blades will not fail over the lifetime of a turbine.
Figure 6. Turbine failure distributions.
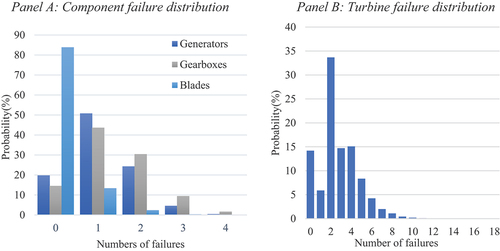
Panel B highlights the financial risk due to random faults in the components. While 15% of turbine have no faults over their lifetimes, another 15% is expected to have five or more faults. The costs associated with these faults will result in significantly different economic outcomes and emphasizes the importance of understanding and quantifying those risks.
Next, we group turbines into wind farms and analyse their fault profiles. Seven wind farms, with turbine counts ranging from 1 to 100, are modelled to estimate mean failure rates and standard deviations over their operational lives (). The average number of failures rises linearly with farm size, while the variability, depicted by the standard deviation, also increases but at a decreasing pace. This variability represents financial risk, quantifiable using VaR and CVaR metrics.
Table 3. Wind farm failure distribution.
Unsurprisingly, the average fault increases linearly with windfarm size, and with that the expected cost. Standard deviation also increases with windfarm size, but in this case, it increases more slowly, proportional to the square root of farm size. The standard deviation reflects the variability, and consequently financial risk, in reliability of wind farms. The increase in standard deviation with farm size, indicates a growth in risk in absolute terms but the slower growth rate indicates a fall in relative terms. Understanding the link between farm size and risk is essential in the planning and financing stages of a windfarm project.
Estimated failure costs
In this section, failures are converted to financial cost. The typical cost of failure of each of the three components is first examined. The costs, the aggregate of the direct cost (repair) and opportunity cost (lost energy sales), are specified and presented in . The repair cost dominates, with opportunity cost accounting for less than 3.5% of the total across all three components.
Table 4. Turbine repair cost.
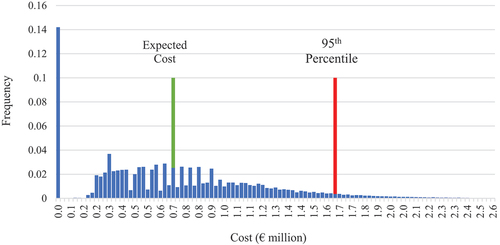
Repair costs are used to derive the cost of faults over the lifetime of a turbine, . Costs are broken down by the three components and express in present value terms. The average lifetime cost is €684,672. The main source of costs is faults in the gearbox, accounting for 73% of the total. This is followed by generators (21%) and blades (6%).
Table 5. Components discounted failure costs.
presents the discounted cost distribution. The average lifetime discounted failure cost is indicated by the green line and the red line identifies the 95% percentile of the distribution, that is the 95% VaR level. The distribution shows 14% of turbines do not have a single failure, highlighting the wide range of outcomes due to random failures.
Figure 7. Turbine cost distribution.
Risk metrics
The cost profiles allow quantification of the financial risk in a windfarm project due to random faults. The VaR and CVaR values for a single turbine are presented in , the results highlight the significant variation in realized profit due to random failures. The costs are scaled by the initial capital expenditure to allow comparison.
Table 6. Risk analysis for a single turbine.
The expected cost from failures is equivalent to 22% of CapEx. However, the 95% VaR from faults is equivalent to 52% of the CapEx. Significantly, in the worst 5% of cases, the average loss is equivalent to 63% of CapEx (the 95% CVaR), 41% above the expected value.
The final analysis is a study of the relationship between risk and wind farm size to understand the effect of diversification. The VaR and CVaR is calculated for a range of farm sizes, and then normalized relative to CapEx. The relationship between size and risk is presented in . Panel A provides across a range of farm sizes from 1 to 100 while Panel B provides more detailed information on seven specific sizes. The focus is on normalized VaR and CVaR to allow comparison across wind farm size.
Figure 8. Wind farms risk Metrics.
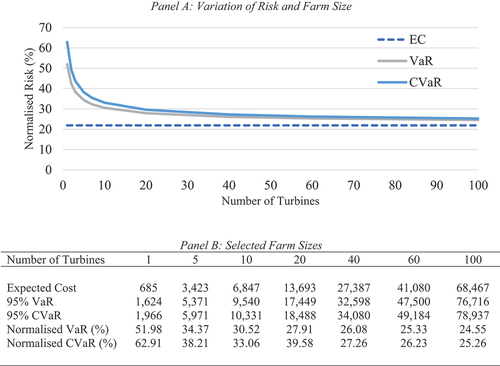
The general pattern is clear, as the number of turbines increases, the risk as a proportion of the investment declines, , Panel A. Over the full range, VaR falls from 51.92% for a single turbine farm to 24.55% for a hundred turbine farm, the corresponding values for CVaR are 62.91% and 25.26%, respectively. The lower limit is 22%, the expected cost of repair. This occurs in the theoretical situation where all turbines realize the average cost of repairs and is a zero-risk scenario. A single turbine has a VaR equivalent to 30% of CapEx above the minimum while this value falls to just 2.5% above the zero-risk level for 100 turbines.
The relationship between size and risk, and consequently the benefits of diversification, is presented in more detail in Panel B. Over half the available reduction in risk can be achieved by increasing the size of a wind farm from 1 to 5 turbines. VaR falls from 51.98% to 34.77%. This represents a drop from 30% above the minimum level to 13%. A further increase to size to 10 turbines brings the VaR down to 30.52%, only 8.5% above the minimum level, and capturing about three-quarters of the available benefit from diversification. Beyond this level, the benefit of increasing farm size falls steadily.
Sensitivity analysis
The choice of discount rate is central to the analysis and the results presented here. Consequently, we perform stress tests the sensitivity of VaR estimates to discount rates. The results for a seven-turbine farm are analysed here but the results are similar for other farm sizes.
VaR is calculated for a range of values using the range of values of values for discount rate (6.5% to 9%) presented by the International Energy Authority (IEA Citation2020). The results are presented in , along with the difference in value from the base case.
Table 7. Discount rate sensitivity analysis.
The change in Normalized VaR values ranges from 3.48% to −11.87% as a percentage of the central estimate as the discount rate moves from 6.5% to 9%. The results show the expected inverse relationship, VaR falls as the discount rate rises. More significantly, increasing the discount rate from 7% to 9% only decreases the VaR by 11.87%. This allows the conclusion that the findings presented are not sensitive to the selection of the discount rate, within a reasonable range.
V. Discussion and conclusion
Implication of the findings
This paper outlines wind farm risk profiles based on industry data, revealing substantial variability in project cost due to random turbine failures across different farm sizes. The average repair cost of a single turbine nearly amounts to a quarter of CapEx, while in the 5% worst-case scenario, both 95% VaR and CVaR exceed half of CapEx. Despite similar average repair costs relative to CapEx across all farm sizes, risk decreases as farm size increases. Results indicate that compared to single turbine farms, excess risk decreases by over half for five-turbine farms and by three-quarters for 10 turbines. However, beyond this point, VaR declines at a notably slower rate. The findings highlight substantial financial risk for wind farms with fewer turbines. Larger commercial farms can offset risk through diversification with numerous turbines. As governments promote energy communities, they need to ensure robust risk mitigation measures are in place for these projects.
The findings have several economic policy implications for the wind energy sector.
Risk management policies. The wide fluctuations in costs caused by wind turbine failures highlight the need for strong risk management policies in wind farm projects. We suggest policymakers create regulations or guidelines to address these risks, like mandating developers to maintain repair reserves or promoting advanced maintenance methods to reduce downtime.
Project Financing and Investment Decisions. Larger wind farms may entail comparatively lower risk than smaller ones, benefiting from economies of scale in maintenance and operation. Policymakers may need to ease financing access for larger projects to promote their growth and expansion.
Incentives for Scale. As wind farm size grows, the decreasing risk trend suggests potential economies of scale in managing turbine failure risks. Policymakers might incentivize project scaling to reduce sector-wide risk and enhance wind energy’s viability as a renewable source.
Insurance and Risk Transfer Mechanisms. The findings highlight the potential financial impact of wind turbine failures, especially in worst-case scenarios. Policymakers might need to facilitate access to affordable insurance customized for wind farm developers and explore risk transfer methods like catastrophe bonds or public–private partnerships to manage risks efficiently.
Research and Development Support. Policymakers could allocate funding to research and development to enhance wind turbine reliability, performance, and maintenance technologies. These innovations could decrease failure rates, lowering overall risk and boosting wind energy’s economic competitiveness.
Overall, these findings emphasize the need for proactive policy interventions to manage risks in wind farm development and operation, ensuring the sector’s growth and sustainability. The study also informs end-of-life decisions for wind farms, such as repowering, life-extension, and decommissioning. When repowering involves deploying fewer turbines after permits expire, the increased risk from reduced turbine numbers must be quantified and addressed. The developed model can be expanded to assess risks beyond the normal lifetime, aiding in evaluating each end-of-life decision.
VI. Conclusion
This study introduces a generic approach for modelling faults and quantifying financial risk arising from mechanical failure, using familiar metrics like VaR and CVaR. These methods aren’t limited to wind energy but applicable across industries. When applied to wind projects using proprietary data, they offer investor insights into financial risks early on. The study also underscores the higher relative investment risk for small-scale projects responsible for their own repairs, pertinent for policymakers considering community or developing country schemes often of smaller scale.
There are limitations to the results. Failure data are commercially sensitive; consequently, a limited amount is publicly available. More data, and finer grained data would allow better estimates of the parameters of the failure processes. Similarly, the modelling could be improved by further subdivision of the failures beyond the three broad classes of generator, gearbox, and blades. This would allow improved allocation of costs beyond the averages used in this paper. Developing a comprehensive public database for reliability, availability, and maintainability is a significant challenge, but could bring far great reliability to planning and risk analysis in this area, encouraging investment.
Highlights
Financial risk metrics of VaR and CVaR are adopted to quantify risks from mechanical failure.
VaR and CVaR are applied to measure the relationship between financial risk and wind farm size.
Wind farms with small numbers of turbines carry significant risk relative to investment from mechanical failures.
Failure processes are modelled directly from annual data rather than lifetime averages.
Supplemental Material
Download MS Word (80.3 KB)Acknowledgements
This work is funded by an Irish Research Council Pathway Award: IRC * 21/PATH-A/9348 Peter Deeney SFI-IRC Pathway/
Disclosure statement
There are no interests to declare.
Supplementary material
Supplemental data for this article can be accessed online at https://doi.org/10.1080/00036846.2024.2380542.
Additional information
Funding
References
- Altuntas, M., T. R. Berry-Stölzle, and J. D. Cummins. 2021. “Enterprise Risk Management and Economies of Scale and Scope: Evidence from the German Insurance Industry.” Annals of Operations Research 299 (1–2): 811–845. https://doi.org/10.1007/s10479-019-03393-x.
- Balsalobre-Lorente, D., C. C. dos Santos Parente, N. C. Leitão, and J. M. Cantos-Cantos. 2023. “The Influence of Economic Complexity Processes and Renewable Energy on CO2 Emissions of BRICS. What About Industry 4.0?” Resources Policy 82:103547. https://doi.org/10.1016/j.resourpol.2023.103547.
- Bejan, A., A. Almerbati, and S. Lorente. 2017. “Economies of Scale: The Physics Basis.” Journal of Applied Physics 121 (4). https://doi.org/10.1063/1.4974962.
- Bezrukovs, D., and A. Sauhats. 2017. “Economic and Operational Risks in Wind Energy Projects in Latvia.” Renewable Energy and Power Quality Journal 1 (15): 377–382. https://doi.org/10.24084/repqj15.326.
- Broughel, A., and R. Wüstenhagen. 2022. “The Influence of Policy Risk on Swiss Wind Power investment.” Swiss Energy Governance: Political, Economic and Legal Challenges and Opportunities in the Energy Transition: 345–368.
- Campbell, S. 2015. “Annual Blade Failures Estimated at Around 3800.” Wind Power Monthly :14 663–676.
- Christensen, L. R., and W. H. Greene. 1976. “Economies of Scale in US Electric Power Generation.” Journal of Political Economy 84 (4, Part 1): 655–676. https://doi.org/10.1086/260470.
- Collier, P. 2005. Management Accounting-Risk and Control Strategy, 126. Oxford: Elsevier.
- Costa, Á. M., J. A. Orosa, D. Vergara, and P. Fernández-Arias. 2021. “New Tendencies in Wind Energy Operation and Maintenance.” Applied Sciences 11(4): 1386.
- Dismukes, D. E., and G. B. Upton Jr. 2015. “Economies of Scale, Learning Effects and Offshore Wind Development Costs.” Renewable Energy 83:61–66. https://doi.org/10.1016/j.renene.2015.04.002.
- dos Santos, A., and M. C. de Barros. 2015. “Stochastic Modeling of Power System Faults.” Electric Power Systems Research 126:29–37. https://doi.org/10.1016/j.epsr.2015.04.015.
- Du, W., and M. Li. 2019. “Government Support and Innovation for New Energy Firms in China.” Applied Economics 51 (25): 2754–2763. https://doi.org/10.1080/00036846.2018.1558356.
- Ederer, N. 2015. “Evaluating Capital and Operating Cost Efficiency of Offshore Wind Farms: A DEA Approach.” Renewable and Sustainable Energy Reviews 42:1034–1046. https://doi.org/10.1016/j.rser.2014.10.071.
- Erfani, A., and M. Tavakolan. 2023. “Risk Evaluation Model of Wind Energy Investment Projects Using Modified Fuzzy Group Decision-Making and Monte Carlo Simulation.” Arthaniti: Journal of Economic Theory and Practice 22 (1): 7–33. https://doi.org/10.1177/0976747920963222.
- Eurostat. 2023. “Euro Indicators. Annual Inflation Down to 5.2% in the Euro Area.” Accessed January 30, 2024. https://ec.europa.eu/eurostat/web/products-euro-indicators/w/2-19092023-.
- Froger, A., M. Gendreau, J. E. Mendoza, E. Pinson, and L. M. Rousseau. 2018. “Solving a Wind Turbine Maintenance Scheduling Problem.” Journal of Scheduling 21 (1): 53–76. https://doi.org/10.1007/s10951-017-0513-5.
- Gabriel, C.-A. 2016. “What is Challenging Renewable Energy Entrepreneurs in Developing Countries?” Renewable and Sustainable Energy Reviews 64:362–371. https://doi.org/10.1016/j.rser.2016.06.025.
- Garcia, C., J. Saravia, and D. Yepes. 2016. “The Weighted Average Cost of Capital Over Life-Cycle of the Firm; is the Overinvestment Problem of Mature Firms Intensified by a Higher WACC?” Cenre for Research in Economics and Finance. Working papers, 15–21.
- Giglio, J. M., J. H. Friar, and W. F. Crittenden. 2018. “Integrating Lifecycle Asset Management in the Public Sector.” Business Horizons 61 (4): 511–519. https://doi.org/10.1016/j.bushor.2018.03.005.
- Hisnanick, J. J., and K. O. Kymn. 1999. “Modeling Economies of Scale: The Case of US Electric Power Companies.” Energy Economics 21 (3): 225–237. https://doi.org/10.1016/S0140-9883(98)00019-X.
- Hribar, L., and D. Duka. 2010. “Weibull Distribution in Modeling Component Faults.” Proceedings ELMAR-2010, Zadar, Croatia, 183–186. IEEE. September.
- Hull, J. 2014. Fundamentals of Futures and Options Markets. Frenchs Forest, Australia: Pearson Education.
- IEA. 2020. “Renewables 2020: Analysis and Forecast to 2025.” International Energy Agency IEA. Accessed July 3, 2023. https://doi.org/10.1787/c74616c1-en.
- Imken, T., T. Randolph, M. DiNicola, and A. Nicholas. 2018. “Modeling Spacecraft Safe Mode Events.” Presented at the 2018 IEEE Aerospace Conference, Big Sky, MT, USA, 1–13. IEEE.
- Kim, K., G. Parthasarathy, O. Uluyol, W. Foslien, S. Sheng, and P. Fleming. 2011, January. “Use of SCADA Data for Failure Detection in Wind Turbines.” Energy Sustainability (54686): 2071–2079.
- Krane, J., and R. Idel. 2021. “More Transitions, Less Risk: How Renewable Energy Reduces Risks from Mining, Trade and Political Dependence.” Energy Research & Social Science 82:102311. https://doi.org/10.1016/j.erss.2021.102311.
- Kucukali, S. 2016. “Risk Scorecard Concept in Wind Energy Projects: An Integrated Approach.” Renewable and Sustainable Energy Reviews 56:975–987. https://doi.org/10.1016/j.rser.2015.12.017.
- Lantz, E. 2013. Operations Expenditures: Historical Trends and Continuing Challenges (Presentation) (No. Nrel/PR-6A20-58606). Golden, CO (United States): National Renewable Energy Lab (NREL).
- Lau, H. C. 2020, October. “Offshore Wind Energy in Asia: Technical Challenges and Opportunities.” Offshore Technology Conference Asia, Kuala Lumpur, Malaysia, D012S001R077. OTC.
- Leahy, K., C. Gallagher, P. O’Donovan, and D. T. O’Sullivan. 2019. “Issues with Data Quality for Wind Turbine Condition Monitoring and Reliability Analyses.” Energies 12 (2): 201. https://doi.org/10.3390/en12020201.
- Leaney, V., D. Jenkins, A. Rowlands, R. Gwilliam, and D. Smih. 2001. “Local and Communiy Ownership of Renewable Energy Power Producion: Examples of Wind Turbine Projecs.” Wind Engineering 25: 215–216.
- Lee, J., and F. Zhao. 2022. Global Wind Report. Global Wind Energy council (GWEC).
- Lei, X., T. Shiyun, D. Yanfei, and Y. Yuan. 2020. “Sustainable Operation-Oriented Investment Risk Evaluation and Optimization for Renewable Energy Project: A Case Study of Wind Power in China.” Annals of Operations Research 290 (1–2): 223–241. https://doi.org/10.1007/s10479-018-2878-z.
- Li, C. B., P. Li, and X. Feng. 2014. “Analysis of Wind Power Generation Operation Management Risk in China.” Renewable Energy 64:266–275. https://doi.org/10.1016/j.renene.2013.11.055.
- Li, J., J. Chen, P. Sun, H. Li, K. Xie, and L. Ran. 2016, September. “Operational Risk Assessment of Wind Turbines.” 2016 International Conference on Condition Monitoring and Diagnosis (CMD), Xi’an, China, 14–19. IEEE.
- Lin, Y., L. Tu, H. Liu, and W. Li. 2016. “Fault Analysis of Wind Turbines in China.” Renewable and Sustainable Energy Reviews 55:482–490. https://doi.org/10.1016/j.rser.2015.10.149.
- Liu, P., F. Meng, and C. Y. Barlow. 2022. “Wind Turbine Blade End-Of-Life Options: An Economic Comparison.” Resources, Conservation & Recycling 180:106202. https://doi.org/10.1016/J.RESCONREC.2022.106202.
- Lorente, D. B., K. S. Mohammed, J. Cifuentes-Faura, and U. Shahzad. 2023. “Dynamic Connectedness Among Climate Change Index, Green Financial Assets and Renewable Energy Markets: Novel Evidence from Sustainable Development Perspective.” Renewable Energy 204:94–105. https://doi.org/10.1016/j.renene.2022.12.085.
- Lynch, M. Á., and J. Curtis. 2016. “The Effects of Wind Generation Capacity on Electricity Prices and Generation Costs: A Monte Carlo Analysis.” Applied Economics 48 (2): 133–151. https://doi.org/10.1080/00036846.2015.1076145.
- Mangram, M. E. 2013. “A Simplified Perspective of the Markowitz Portfolio Theory.” Global Journal of Business Research (7): 59–70.
- Nagle, A. J., G. Mullally, P. G. Leahy, and N. P. Dunphy. 2022. “Life Cycle Assessment of the Use of Decommissioned Wind Blades in Second Life Applications.” Journal of Environmental Management 302:113994. https://doi.org/10.1016/j.jenvman.2021.113994.
- Nazir, M. S., A. J. Mahdi, M. Bilal, H. M. Sohail, N. Ali, and H. M. Iqbal. 2019. “Environmental Impact and Pollution-Related Challenges of Renewable Wind Energy Paradigm–A Review.” Science of the Total Environment 683:436–444. https://doi.org/10.1016/j.scitotenv.2019.05.274.
- Nielsen, J. J., and J. D. Sørensen. 2011. “On Risk-Based Operation and Maintenance of Offshore Wind Turbine Components.” Reliability Engineering and System Safety 96 (1): 218–229. https://doi.org/10.1016/j.ress.2010.07.007.
- Nowakoski, G. A., and D. G. Loomis. 2023. “The Power of Economies of Scale: A Wind Industry Case Study.” Strategic Planning for Energy and the Environment 491–528. https://doi.org/10.13052/spee1048-5236.4234.
- Pookpunt, S., W. Ongsakul, and N. Madhu. 2020. “A Comprehensive Techno-Economic Analysis for Optimally Spaced Wind Farms.” Electrical Engineering 102 (4): 2161–2179. https://doi.org/10.1007/s00202-020-01014-6.
- Qiu, D., H. Dinçer, S. Yüksel, and G. G. Ubay. 2020. “Multi-Faceted Analysis of Systematic Risk-Based Wind Energy Investment Decisions in E7 Economies Using Modified Hybrid Modeling with IT2 Fuzzy Sets.” Energies 13 (6): 1423. https://doi.org/10.3390/en13061423.
- Rashid Khan, H. U., U. Awan, K. Zaman, A. A. Nassani, M. Haffar, and M. M. Q. Abro. 2021. “Assessing Hybrid Solar-Wind Potential for Industrial Decarbonization Strategies: Global Shift to Green Development.” Energies 14 (22): 7620. https://doi.org/10.3390/en14227620.
- Ren, Z., A. S. Verma, Y. Li, J. J. Teuwen, and Z. Jiang. 2021. “Offshore Wind Turbine Operations and Maintenance: A State-Of-The-Art Review.” Renewable and Sustainable Energy Reviews 144:110886. https://doi.org/10.1016/j.rser.2021.110886.
- Rieger, N. F. 2004. “High Cost of Failure of Rotating Equipment.” Proceeding of the 2004 the Eleventh World Congress in Mechanism and Machine Science, China, 45–52. Presented at the Eleventh World Congress in Mechanism and Machine Science.
- Roth, A., M. Đukan, V. Anatolitis, M. Jimeno, J. Banasiak, R. Brückmann, and L. Kitzing. 2021. “Financing Conditions of Renewable Energy Projects–Results from an EU Wide Survey.” Open Research Europe 1:136. https://doi.org/10.12688/openreseurope.13969.2.
- Saługa, P. W., K. Zamasz, Z. Dacko-Pikiewicz, K. Szczepańska-Woszczyna, and M. Malec. 2021. “Risk Adjusted Discount Rate and Its Components for Onshore Wind Farms at the Feasibility Stage.” Energies 14 (20): 6840. https://doi.org/10.3390/en14206840.
- Serrano‐González, J., and R. Lacal‐Arántegui. 2016. “Technological Evolution of Onshore Wind Turbines—A Market-Based Analysis.” Procedia - Social and Behavioral Sciences Elsevier BV 19 (12): 2171–2187. https://doi.org/10.1002/we.1974.
- Sonnberger, M., and M. Ruddat. 2017. “Local and Socio-Political Acceptance of Wind Farms in Germany.” Technology in Society 51:56–65. https://doi.org/10.1016/j.techsoc.2017.07.005.
- Steffen, B. 2020. “Estimating the Cost of Capital for Renewable Energy Projects.” Energy Economics.88,104783.
- Susainable Energy Authority Ireland. 2023. Prices. Accessed 30th January 2024. https://www.seai.ie/daa-and-insights/seai-satistics/key-satistics/prices/.
- Tazi, N., E. Châtelet, and Y. Bouzidi. 2017. “Using a Hybrid Cost-FMEA Analysis for Wind Turbine Reliability Analysis.” Energies 10 (3): 276. https://doi.org/10.3390/en10030276.
- Tazi, N., E. Châtelet, R. Meziane, and Y. Bouzidi. 2016. “Reliability Optimization of Wind Farms Considering Constraints and Regulations.” Presented at the 2016 IEEE International Conference on Renewable Energy Research and Applications (ICRERA), Birmingham, UK, 130–136. IEEE.
- Trading Economics. 2023. “Euro Area Inflation Rate. September 2023 Data - 1991–2022 Historical.” https://tradingeconomics.com/euro-area/inflation.
- Triebs, T. P., D. S. Saal, P. Arocena, and S. C. Kumbhakar. 2016. “Estimating Economies of Scale and Scope with Flexible Technology.” Journal of Productivity Analysis 45 (2): 173–186. https://doi.org/10.1007/s11123-016-0467-1.
- Wagner, H. J. 2018. “Introduction to Wind Energy Systems.” EPJ web of conferences, Bochum, Germany, 00005. Vol. 189. EDP Sciences.
- Weaver, T. 2012. “Financial Appraisal of Operational Offshore Wind Energy Projects.” Renewable and Sustainable Energy Reviews 16 (7): 5110–5120. https://doi.org/10.1016/j.rser.2012.05.003.
- Webster, I. 2023. “In 2013 – 2023 | Euro Inflation Calculator.” Alioth Finance. Off. Data Found. https://www.officialdata.org/europe/inflation/2013?amount=189908.
- Wind Europe. 2022. Wind Energy in Europe Outlook to 2023. https://windeurope.org/about-wind/reports/wind-energy-in-europe-outlook-to-2023/.
- Wind Europe. 2023. Wind Farms in Europe. Accessed January 30, 2024. https://windeurope.org/about-wind/reports/wind-energy-in-europe-outlook-to-2023/.
- Yeter, B., Y. Garbatov, and C. G. Soares. 2020. “Risk-Based Maintenance Planning of Offshore Wind Turbine Farms.” Reliability Engineering and System Safety 202:107062. https://doi.org/10.1016/j.ress.2020.107062.
- Zaoui, A., R. Meziane, E. Chatelet, and F. Lakdja. 2022. “Economic Evaluation of the Life Cycle of a Wind Farm and Improving the Levelized Cost of Energy in Region Champagne-Ardenne, France.” International Journal of Energy & Environmental Engineering 13 (1): 1–11. https://doi.org/10.1007/s40095-021-00425-w.
- Zhou, S., and P. Yang. 2020. “Risk Management in Distributed Wind Energy Implementing Analytic Hierarchy Process.” Renewable Energy 150:616–623. https://doi.org/10.1016/j.renene.2019.12.125.
- Ziegler, L., E. Gonzalez, T. Rubert, U. Smolka, and J. J. Melero. 2018. “Lifetime Extension of Onshore Wind Turbines: A Review Covering Germany, Spain, Denmark, and the UK.” Renewable and Sustainable Energy Reviews 82:1261–1271. https://doi.org/10.1016/j.rser.2017.09.100.