
Abstract
This study investigated the impact of various energy conservation measures (ECMs) on total annual electricity consumption on a single level, two-bedroom residential building in an arid climate and in a very remote area of Australia. Base case scenario of annual energy consumption profiles of the building and its existing systems were modelled and simulated using DesignBuilder software, and the results were validated by on-site measured electricity data. Two categories of ECMs (major intervention and minor intervention) were investigated and analysed. The findings show that the total annual energy consumption of the case study building can be reduced by up to 44% (2 kWh/m2·yr) when compared against the base model and measured data if selected ECMs are implemented. Significant savings from implementing selected ECMs can help alleviate the cost-of-living pressure and stress currently experienced by many households on low incomes especially for residents of very remote communities in Australia.
1. Introduction
Energy consumption in buildings is subject to several factors such as climatic conditions, building design and orientation, building envelope, occupant behaviour, building systems and controls, maintenance, etc. (Qian et al. Citation2019). Between 1994 and 2014, worldwide energy consumption increased by about 92% with current research indicating an increase in global demand for oil, coal and natural gas by 30% and 50%, respectively, between 2007 and 2035 (Berardi Citation2015). This implies an annual increase of carbon emissions by more than 2% (Qian et al. Citation2019). In Australia, the energy consumption rose by 0.6% to reach 6196 petajoules in 2019, representing an average annual growth of 0.7% over the past 10 years. Heavily dependent on fossil fuels (Coal, Oil and Gas), these accounted for 94% of Australia’s primary energy mix, where oil took the largest share at 39%, coal at 29% and natural gas at 29%, while renewable energy accounted for the remaining 6% (Department of the Environment and Energy Citation2019). In 2017, Australia’s energy supply was more carbon intensive (‘dirtier’) than China’s, and the rest of the world (WED Citation2020a; Citation2020b; Citation2020c).
The residential sector in Australia is a big consumer of energy and a significant carbon emitter recording 57% of emissions in the sector (Energy Consult Pty Ltd Citation2015). It remains the fourth largest consumer of energy after transport, electricity supply and manufacturing (Department of Industry Citation2020). Typical building energy consumption goes towards space heating, space cooling, lighting, water heating and ventilation (McGee Citation2017). Based on the above, it is evident that reducing energy consumption in the residential sector is an effective and practical way to reduce energy consumption and carbon emissions domestically and globally.
The Nationwide Housing Energy Rating Scheme (NatHERS) in Australia is a direct response to the need for an energy-efficient residential sector and specifies minimum energy requirements for residential buildings in Australia. While this initiative has greatly benefited the housing sector in Australia, the impact has been minimal in remote communities due to the peculiar characteristics associated with remote communities.
Spanning 90% of Australia’s land mass and between 6% and 23% of the entire population, the characteristics of remote Australia differ from other parts of Australia. These remote regions present with common systemic properties including a history of persistent social and economic disadvantage that also manifest in poor health statistics and weak infrastructure. These systemic remote region characteristics when interfaced with changing climates and different energy futures, results in impacts, opportunities and vulnerabilities that differ from those applicable to coastal and urban regions of Australia (Maru, Chewings, and Sparrow Citation2012). The challenges buildings and their occupants in remote regions of Australia face when compared with urban areas include generally harsher climates with greater temperature extremes and much higher electricity costs ($5/kWh versus $0.2/kWh). This is due to the higher cost of electricity infrastructure design, installation, operation and maintenance in remote areas compared to metropolitan areas, as such cost of electricity supply to the consumer is therefore much higher in remote areas; ‘for example, $2 per kilowatt hour (for the full life-cycle cost of electricity generation), compared to about 14 cents per kilowatt hour in town’ (CAT Citation2021).
Approximately 100,000 Aboriginal and Torres Strait Islander people live in remote communities (Buergelt et al. Citation2017) and it is projected to reach 145,000 by 2021 (ABS Citation2017). Extreme climatic conditions and overcrowding, combined with significantly lower incomes and significantly greater health problems means that their energy needs take on particular importance. Therefore, the supply of affordable energy to these communities is critical to their daily survival and their longer-term opportunities, including improving their life expectancy and overall wellbeing (Energy Consumers Australia Citation2019). It is estimated that an additional 5500 homes will be required to address overcrowding in remote communities by 2028 after accounting for population growth (Towart et al. Citation2017). This expected increase in the supply of housing also means increased energy demand, consumption and emissions. In 2012 alone, total power consumption in remote communities was 5739 kWh (Foran et al. Citation2015) and given the significant investment in housing targeted towards remote communities by the Australian government, opportunities continue to abound to reduce energy demand, consumption and carbon emissions via the identification and implementation of energy conservation measures. Building Energy Simulation (BES) is a popular approach towards achieving this outcome as it facilitates the exploration of climate-responsive design and the testing of alternatives for building energy efficiency and thermal performance without compromising occupant comfort. However, most of such studies in Australia and beyond have been representative of urban and coastal areas and do not capture the systemic properties associated with remote and very remote regions which are largely Indigenous. Consequently, baseline data from the findings may not necessarily produce accurate results when directly applied in the remote context/settings. While the number of projects looking into the issue of energy in Indigenous communities continues to grow, it remains a very new field of research and focus in Australia. This paper attempts to augment this growing field of study using an evidence-based approach.
This research, therefore, presents a pilot analysis using a case study approach to explore the effectiveness of several energy conservation measures aimed at improving the energy performance of residential buildings in very remote communities without compromising thermal performance to produce the following outcomes:
Generate data that will allow sustainability gaps in existing remote housing to be identified so that appropriate solutions can be proffered.
Generate data that will aid evaluation and prioritization when implementing strategies for achieving energy efficiency.
Generate results that will form a basis for management and decision making.
Provide workable and reliable data that will inform the planning, design, construction, operation and maintenance of sustainable housing in remote communities.
Establish key performance indicators for future use, potential benchmarking and measuring improvements.
Identify the utility of environmental and IEQ data as inputs into evidence-based design via building performance quantification techniques (monitoring and simulations) for generating new housing concept designs for different climatic zones in remote communities.
2. Literature review
2.1. Overview
Electricity is an essential service that building occupants rely on to maintain good health and comfort. According to the world bank overview on energy, about 789 million people live without electricity with hundreds of millions more living with insufficient or unreliable access to it (Bank Citation2021).
Since 2007, Australian residential retail electricity prices have increased faster than those of any other OECD country and in the last decade, Australia has moved from being a low-price electricity market to around the OECD average (Queensland Productivity Commission Citation2016). Increasing tariffs and growing consumption have seen the cost of household electricity in Australia continue to rise resulting in undue pressure on household budgets and further stresses for those on low incomes across the country (McKenzie Citation2013). In Queensland (QLD), a total of 29,692 households in the state were disconnected for not paying an electricity bill, and as of June 2015, it was reported that over 15,000 households were managing their bills under a hardship programme arrangement with their retailer (Bright Actions Citation2016). In Victoria (VIC), the proportion of households participating in retailer hardship programmes grew by 35% (Strempel, Nicholls, and Strengers Citation2015). Data across the different states and territories highlight similar trends with Western Australia (WA) recording the highest number of disconnection rates in comparison to states like New South Wales (NSW), Victoria (VIC) and South Australia (SA) (Economic Regulation Authority Citation2019).
For remote and very remote communities in Australia, these stresses take a far greater dimension due to the peculiar characteristics associated with the region. It is well documented that residents of remote communities currently experience disadvantage across a range of social and economic indicators including health, housing, income and education which makes such households vulnerable to relative poverty. Median household incomes are significantly less than their city counterparts thus, are at particular risk of the negative health and social effects of high-energy costs and poor reliability of supply caused by frequent disconnections (Queensland Council of Social Service Citation2014). While low household income does not directly cause an increase in high-energy consumption, it is a factor which directly impacts one’s ability to cope with energy cost. This is because most remote and very remote communities in Australia are not serviced by an electricity grid but employ the extensive use of diesel as a means of power generation through diesel generators. These communities are isolated by hundreds of kilometres of untarred (dirt road) which can be cut off by flooding especially during the rainy seasons, which makes reliable supply of diesel difficult around certain times of the year (Green, Jackson, and Morrison Citation2009). The majority of Indigenous people residing in remote and very remote areas are in receipt of Commonwealth income support payments hence, are considered to be low income since individuals in these communities live on an average median income between $209 and $237 per week (Statistics Citation2006). The median personal income in 2018–2019 was around $489 per week for Aboriginal and Torres Strait Islander adults and $767 per week for non-Indigenous adults (Provision Citation2020). This disparity in the median equivalized gross weekly household (EGWH) income between residents of remote communities and their city counterparts generally decreases as remoteness increases. For instance, in 2018–2019, the median EGWH income ranged from $719 in major cities to $400 in very remote areas (see Figure for remote classification according to the Australian Statistical Geography Standard (ASGS)). The lack of employment opportunities also means that the individuals in receipt of Commonwealth income support payments typically tend to spend more time at home during the daytime thus, driving up relative energy costs (Urmee, Thoo, and Killick Citation2012). Going by the statistics above, it is not surprising that households on low and fixed incomes spend a greater proportion of their income on such an essential service when compared with households with higher income (Fagan and Australia Citation2008). Statistically, low-income households spend approximately 10% of their disposable income on household energy costs, compared to the national average of 5%, which means that even the slightest increase in utility bills can have a significant impact on already stretched household budgets (GHW Citation2016).
Figure 1. 2016 Australian Statistical Geography Standard: Remoteness Structure Remoteness Area Boundaries.
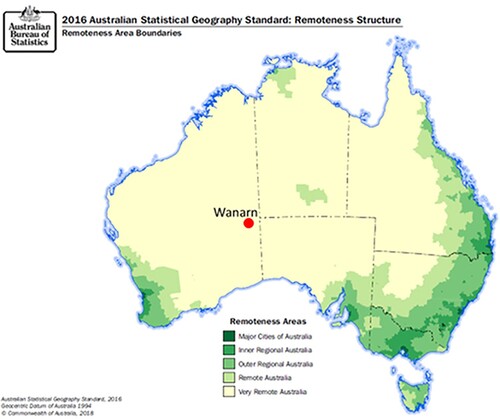
The growing concern about how rising costs and consumption of electricity impacts households in remote and very remote communities in Australia, especially those on low income, disadvantaged or otherwise marginalized, means it remains critical that more effort is channelled towards alleviating the pressures faced by such communities in accessing this service. Wanarn Community, WA, the case study for this paper rates as very remote which implies that residents of this community experience great difficulty in accessing the services they need and the products they wish to purchase (Trewin Citation2001). Hence, the need for a targeted approach to reduce energy need, demand and consumption through the design and delivery of energy-efficient housing that not only minimizes ongoing operational and maintenance cost but also provides greater opportunities for the occupants to adopt energy-efficient practices through behavioural changes.
2.2. Cost of remoteness
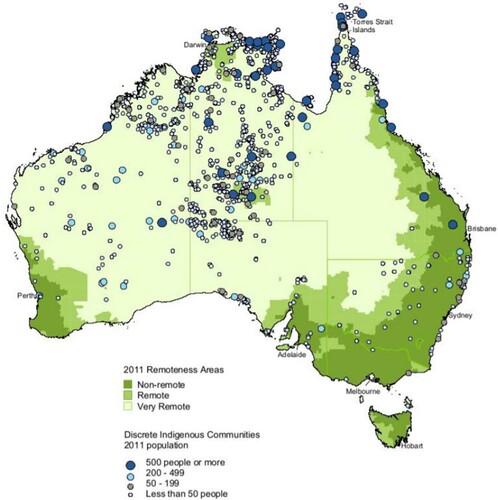
The disadvantage associated with remote communities when it comes to the cost-of-service delivery due to remoteness is visible in various sectors such as health (Welfare Citation2011), housing (Fien et al. Citation2007), education (Stokes, Holdsworth, and Stafford Citation1999), transportation (Spandonide Citation2014) and energy (AECOM Citation2014; Nous Group Citation2017). Remoteness significantly impacts the cost of building materials and construction due to high fuel and transportation costs (Szava et al. Citation2007). The effect of this is further pronounced in maintenance costs which are around 8.5 times higher in very remote communities than in remote communities, with emergency repair activities costing around 75% higher, and planned repairs costing about 50% higher than in remote communities due to travel cost per job (Nous Group Citation2017). For remote communities, vast distances often correlate with decrease in population (Figure ). The more remote a community is, the more reduced the population will be as such, some communities could have a population of less than 50 people resulting in a higher cost per unit per capita towards service delivery (Australian Government Productivity Commission Citation2017). In terms of energy service provision, the cost of setting up the necessary infrastructure including maintaining poles and wires and the management of power distribution alone remains significant and ongoing. For instance, the price of diesel fuel to run power generators is one factor particularly in the NT and in northern WA where, in some Aboriginal communities, those costs can account for as much as $2000 per quarter, translating to $0.25–$2.00/kWh (Ding et al. Citation2015)
Figure 2. Discrete Indigenous communities by size and remoteness, 2011. Source: ABS (Census of Population and Housing, unpublished).
From a cultural point of view, connections to family and community, to the land, to culture and traditions, are all fundamental to how indigenous people in remote communities feel about themselves, and their sense of a good life (Australian Government Productivity Commission Citation2017). Certain cultural practices when overlooked, create significant spikes in energy costs for Aboriginal and Torres Strait Islander households for instance, it is not unusual for Aboriginal and Torres Strait Islander households to have large numbers of people living in a single house at any one time. The reason being that many households have large families, as well as cultural expectations that Aboriginal and Torres Strait Islander communities generally have an ‘open door’ to relatives and a cultural responsibility to take in relatives in times of need. This also includes distant relatives (Queensland Council of Social Service Citation2014) as such these socio-cultural characteristics contribute to high electricity consumption and costs.
To address this problem, the federal government as part of their climate change strategy introduced the Low-Income Energy Efficiency Program (LIEEP) in 2011(Yang et al. Citation2020b). Aimed at improving the energy efficiency of low-income households and facilitate better management of energy use by these households, the LIEEP programme had two main objectives:
To assist low-income and disadvantaged households overcome identified barriers to energy efficiency to better manage their energy use and,
To capture and analyse data and information to inform future energy efficiency policy and programmes.
A summary of the findings from the LIEEP programme is provided below:
Table 1. Overview of LIEEP programmes and key elements.
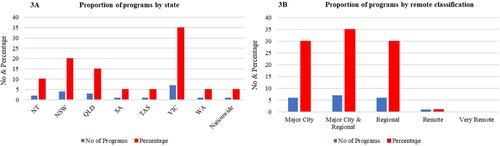
Location: Following a review of available reports on each of the projects conducted in the LIEEP, the state of Victoria was the state with the highest number of projects around 35% (7) of the projects, NSW a distant second at 20% (4) (Figure (A)). From 20 projects executed, 95% (19) of the projects were carried out in major cities and regional areas, and 5% (1) in remote communities (and this was in the Norther Territory, specifically targeted towards indigenous Australians). No programmes were carried out in very remote communities which is the location of the case study project in this study (Figure (B)). This finding underscores the importance of the contribution of this study.
Figure 3. Proportion distribution of programmes. (A) Proportion distribution by state, (B) proportion distribution by remote structure/classification.
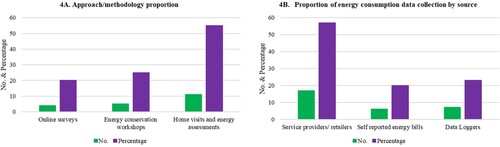
Approach/methodology: The approach to data collection has been classified into three categories: surveys, energy conservation workshops, and home visits and energy assessments. By proportion, surveys accounted for 20% (4), energy conservation workshops accounted for 25% (5) and home visits and energy assessments accounted for 55% (11) (Figure (A)). The energy consumption data was via self-reported energy bills by households, metre readings from energy providers and monitoring using data loggers, however, energy data was predominantly obtained from energy providers/retailers (Figure (B)).
Figure 4. Approach/methodology proportion by type. (A) Approach/methodology proportion, (B) proportion of energy consumption data collection by source.
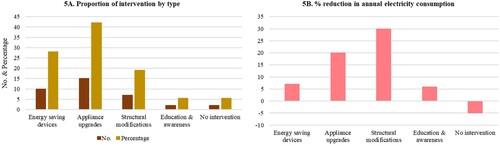
Interventions: The LIEEP saw the implementation of energy conservation measures in most of the programmes (18 out of a total of 20 programmes had interventions). These interventions in the form of energy conservation measures consisted of the supply and installation of energy-saving devices such as standby power controllers (Alliance Citation2016), appliance upgrades such as air-conditioners (Byrne et al. Citation2016; O’Mullane and Hoch Citation2016; Sullivan Citation2016; Ward and Brent Citation2016), structural modifications such as ceiling and floor insulations (Steinborner et al. Citation2016), education and awareness via personalized feedback and energy conservation tips via SMS (Australian Government – Department of Industry Citation2016). The impacts of these interventions led to reductions in annual household electricity consumption between 3% and 30% depending on the type of intervention implemented where structural modifications had the greatest impact on energy consumption by 30%. It is noted, however, that one programme with no interventions saw an annual increase in energy by 5% (Lynch et al. Citation2016). Figure (A,B) provides some insights on the interventions implemented including impact on annual household energy consumption.
Figure 5. Interventions by type and impacts on annual electricity consumption. (A) Proportion of intervention by type, (B) percentage reduction in annual electricity consumption.
Challenges: Many challenges were also highlighted in the reports predominantly around the lack of available historical building and energy consumption data including difficulty obtaining such data. Even when these data were made available, cases of missing and inaccurate data were also reported particularly around the electricity consumption data. Challenges relating to remoteness were also reported with respect to logistics, climatic conditions, and cultural complexities. Further, cases on the reluctance of landlords to grant consent for households to implement energy conservation measures (ECMs) in the rented homes as well as low participation rates, faulty installations and failed equipment were also reported. Table summarizes the magnitude of the challenges faced in terms of dominance.
Table 2. A snapshot on the challenges reported during the implementation of the LIEEP.
The findings above highlight the need to continue to grow the body of knowledge on energy management to support low-income households in Australia, particularly in very remote communities to enable them better manage their energy needs. The peculiarities and limitations in undertaking energy efficiency and conservation projects in remote communities means that access to reliable data at the very local level is needed to inform better decision making across regions and local levels. Reliable data that is easily accessible and understood can go a long way to empower communities in advocating for the local needs of their communities. This will also aid governments and other service providers in making better-informed decisions, improve efficiency and accountability and measure outcomes (SCRGSP Citation2020).
2.4. Residential energy efficiency and building energy simulation
The energy efficiency of residential buildings denotes the required amount of energy to facilitate the useful services of everyday practices in households. NatHERS remains the most popular pathway to meet the National Construction Code (NCC) energy efficiency requirements in Australia (Willand, Maller, and Ridley Citation2019). Dynamic energy simulation is one method for quantifying energy performance of buildings via the use of energy simulation tools thus, an accredited method for NatHERS and NCC energy efficiency compliance in Australia. Currently, there are over 400 tools applicable to the evaluation of energy efficiency, renewable energy and sustainability in buildings (IBPSA Citation2020). From this number, approximately 120 tools are just for whole building energy simulations. The reliability of such simulations, however, is dependent on several factors such as the quality and detail of inputs into the energy model, underlying uncertainties linked to available weather databases, the in-field measured parameters, and the data obtained from existing documentation (Ding et al. Citation2015; Erba, Causone, and Armani Citation2017; Littlewood et al. Citation2017). Further, the selected software tool and knowledge of the user also impact the outcome of simulation results. The use of computational software as a calculation method provides a standard and repeatable methodology and output values for selected criteria. This standardization is a benefit to designers, checkers and approvers as it provides familiarization, expediency, confidence and accuracy benefits (Australian Building Codes Board Citation2018). To demonstrate compliance, the NCC requires that the choice of simulation engines used for energy modelling meet the requirements of ANSI/ASHRAE Standard 140 (2007) and allow using a time-step of not more than one hour throughout an entire year from which to assess building performance, using representative local weather data as an input to calculations (Board Citation2019).
2.5. Climate of Wanarn and selected weather file
Wanarn is situated on the Indigenous lands of Ngaanyatjarra in WA. The climate is classified as arid to semi-arid (Desert), with hot summers. Temperatures are often above 40°C with moderately cool winters and often very cold nights. The meteorological view of the Aboriginal and Torres Strait Islander people is one of great diversity that cannot be meaningfully simplified to a rigid European seasonal calendar for the entire continent. Because of all this, seasonal cycles as described by the various Aboriginal cultures differ substantially according to location. In WA, climate is described according to the Nyoongar calendar which consists of six seasons namely: Kambarang, Birak Bunuru (Dry and hot season – October to March) and Djeran, Makuru, Djilba (cool and wet season – April to September; MacFarlane Citation2016). This classification splits the weather into two main seasons of hot and cool, where the hot season spans October to March and the cool season spans April to September. Typical Meteorological Year (TMY) and the Actual Meteorological Year (AMY) are the two common types of weather files used in building energy simulation studies (Bianchi and Smith Citation2019; Burleyson et al. Citation2018; Chan Citation2011; Hong et al. Citation2013; Hong, Chang, and Lin Citation2013; Lin and Hong Citation2013; Pyrgou et al. Citation2017; Tsoka et al. Citation2018). TMY’s contain statistically derived weather data from the past 10–30 years of historic data depending on availability, presents in 8760-hour format for use in simulation engines and do not capture extreme periods. AMY’s on the other hand, represent actual hourly observations for a given year and capture any extremes observed within the given year or any given timeframe. The choice of weather data for the simulation for this study was influenced by the need to account for seasonal variations and temperature extremes as this is reflective of the micro-climate. As such, the AMY data set was deemed appropriate over the TMY data set for this purpose.
The AMY data set for the 2018 calendar year representing 8760 h of weather data in .epw format, based on data obtained from Giles weather station 94461 from the Australian Bureau of Meteorology (ABOM) was used to perform the simulations. Prepared by Exemplary Energy in partnership with ABOM and the Commonwealth Scientific and Industrial Research Organisation (CSIRO), Satellite-derived solar Global Horizontal (GHI) and Direct Normal Irradiance (DNI) estimates are based on images from the Geostationary Meteorological Satellite GMS-5, Geostationary Operational Environmental Satellite (GOES-9) and MTSAT-1R satellites, which are provided with permission of the Japan Meteorological Agency (JMA) and the United States National Oceanic & Atmospheric Administration (NOAA) (Energy Citation2019). Data quality is assured via routine application of a capping algorithm to reduce over or under estimation impacts in line with the time convention of the applicable climate data. For solar data, each hourly value was calculated based on the minute-by-minute interpolated value for 60 min before the hour stated (1–24 h) in keeping with the convention of the TMY2 and EPW formats. Cloud cover data was inferred from solar data with the same time convention by relating it to coincident Clear Sky values. This was based on the total satellite-derived global irradiance over ∼5 km square pixels nearest to the target site, expressed as a fraction of the equivalent clear sky irradiance, to give a measure of fractional cloud cover that correlated well with observations (Maleny and Island Citation2017). For temperature, atmospheric Pressure and Humidity, all values were instantaneous on the hour as measured by ABOM, while wind was on the basis of averages for the 10 min preceding the stated hour as measured by ABOM (Lee Citation2011; Partners Citation2014). On-site measurements hourly measurements for temperature and humidity for 8760 h were then imported to replace corresponding ABOM data for simulation in DB and EP. A brief analysis of the weather data including the corresponding heating degree days (HDD) and cooling degree days (CDD) is presented in Table and Figure . The base values for HDD and CDD calculations were 15 and 21°C heating and cooling, respectively. These fall within the ABOM recommended basepoints of 12 and 18°C for heating and 18 and 24°C for cooling (Australian Bureau of Meteorology Citation2022).
Figure 6. (A) Monthly radiation. (B) Monthly heating and cooling degree days.
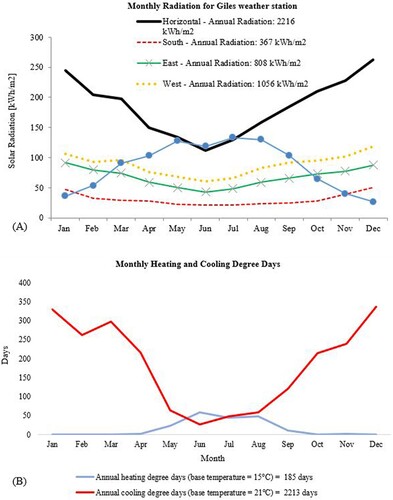
Table 3. Brief analysis of selected weather file.
2.6. Energy conservation
Energy conservation can be defined as the practice of reducing the amount of energy required for a building to operate in a manner that maintains the needed functionality for the occupants with respect to occupant comfort and wellbeing (Rahman, Rasul, and Khan Citation2010). Energy consumption in buildings is impacted by several factors such as climatic zones, building envelope, building materials, building occupants’ characteristics and behaviours, ventilation systems, artificial lighting and appliances and building design (Ochedi and Taki Citation2019). Energy efficiency interventions designed for implementation in households vary widely and include activities such as engineering retrofits to the home, undertaking home energy audits, the use of in-home displays, energy workshops and several behaviour-change activities (Geller et al. Citation2006). The key question for decision makers then becomes which of these intervention approaches should be adopted with respect to their effectiveness and impact while considering household comfort and wellbeing as well as cost implications. The link between accessibility and affordability of electricity to housing, education, health and social welfare outcomes discussed in the previous sections of this paper further suggests that benefits of an energy-efficient home go beyond reducing a household’s energy bill. In addition, there are also valuable societal benefits such as reduced hospitalizations due to improved health outcomes (Howden-Chapman and Preval Citation2014), a decrease in temperature-related mortality (Taylor et al. Citation2018), higher level of energy security and stability (Ayres, Turton, and Casten Citation2007; Selvakkumaran and Limmeechokchai Citation2013), as well as improved economic productivity (Anderson et al. Citation2014), which is highly beneficial to very remote communities. Energy conservation measures (ECMs) can be classified into two groups: Major intervention ECMs and minor intervention ECMs. The former are typically those interventions that relate to structural modifications or engineering retrofits on the building envelope such as wall and floor insulation upgrades, HVAC upgrades, window/glazing upgrades and external shading devices. These types of interventions typically attract a higher cost implication to implement. The latter, however, constitute those interventions that have minimal or no structural impact to the buildings as such lower cost implications to implement hence considered as minor investment ECMs (Rahman, Rasul, and Khan Citation2010). Examples include interventions like lighting upgrades, draft proofing using door and window seals, blinds for internal shading, energy-saving devices such as remote-control sockets, stove timers, and so on. Other measures/approaches to energy conservation related to behavioural change such as adjustments to indoor temperature setpoints are generally classified as no intervention/no investment ECM’s and may be considered however, studies have shown that energy conservation via the behavioural change approach has typically resulted in minimal impact towards reducing electricity consumption (Bird and Legault Citation2018; Delmas, Fischlein, and Asensio Citation2013; James and Ambrose Citation2017). Building energy simulations provide an effective means for the evaluation of the energy-saving potential of ECMs enabling informed decisions towards the selection of the most appropriate measure for implementation to be made especially in desert climates. For instance, Al-Tamimi (Citation2022) used simulations to investigate the impact of different building envelope modifications on energy consumption of residential buildings in hot and arid climates in Qatar and found that thermal insulation can reduce energy consumption by 23% while an effective combination of shading, glazing and green roofs can reduce total energy consumption by 35%. Similarly, findings from studies on improving thermal behaviour of glazed windows in hot tropical regions show potential reduction in annual cooling loads by 7.2% and reduction in peak cooling loads by around 36% (Aboulnaga and Moustafa Citation2016; Al-Tamimi and Fadzil Citation2012; Sbar et al. Citation2012; Yu et al. Citation2020). Using thermal calculations and simulations, Goussous, Siam, and Alzoubi (Citation2015) investigated the impact of green roof technology on HVAC energy consumption on a residential building in Jordan and the results showed that up to 17% of HVAC energy consumption could be saved with the simplest application of the green roof system. In terms of whole building energy conservation, Rahman (Citation2010) investigated the various ECMs by optimizing HVAC systems, lighting, glazing, heating and cooling setpoints in an institutional building in Queensland, Australia and the results show a 41% energy saving without compromise to occupant thermal comfort. Other similar studies conclude that optimization of the building envelopes using energy simulations is an effective approach to energy conservation and can reduce annual energy consumption by up to 39% (Al-Sanea et al. Citation2016; Alaidroos and Krarti Citation2015; Alayed, O'hegarty, and Kinnane Citation2021; Çomaklı and Yüksel Citation2003; Dababt and Awad Citation2017; Hasan Citation2018). This study employs the method of building energy simulations to quantify the impact of energy conservation measures across the three mentioned categories to aid the decision process towards implementation in buildings in very remote communities. In this study, the interventions are categorized into major and minor intervention ECMs.
2.7. Overheating criteria and thermal comfort
Fanger’s predicted mean vote (PMV) and predicted percent dissatisfied (PPD) model is the widely accepted thermal comfort model (Fanger Citation1970). The PMV/PPD method reduces thermal comfort to a steady-state heat balance equation. Overheating criteria such as the Chartered Institution of Building Services Engineers (CIBSE) Guide A: Environmental design 2006 (Guide Citation2006) sets static design maximum thresholds at 28°C for living areas and 26°C for bedrooms is based on the PMV/PPD thermal comfort model, and requires that PPD should not be more than 10%. This means a maximum of not more than 876 h out of 8760 h in a year of discomfort hours or unmet heating and cooling loads is acceptable. This study applies the same approach when considering the balance between energy conservation measures and thermal comfort in the selection of optimal solutions from the simulation exercise.
3. Methodology
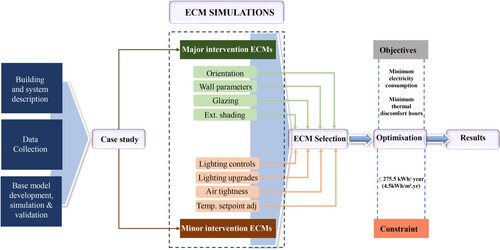
The methodology for this study adopts a case study approach using a residential building and stems from a practical applications point of view, consistent with existing building simulation and energy conservation studies. The objective of quantifying the impact of various ECMs for implementation in a remote Australian context was undertaken via optimization analysis in Design Builder (DB) and EnergyPlus (EP), based on genetic algorithm that investigates the interventions that offer the best performance solutions regarding energy consumption and thermal comfort.
3.1. Building and system description
The analysis focuses on a single-storey two-bedroom case study located in the Indigenous community of Wanarn, Western Australia which is classified as very remote. Ngaanyatjarra Lands where Wanarn is located is one of the most remote parts of Australia and arguably the world’s most remote community (McCafferty Citation2016). The selection of this case study stems from its suitability to generate unavailable performance data that is reflective of very remote communities that complement existing studies, which to date are primarily in remote or regional areas such as Alice springs and Laverton (Duell et al. Citation2006). The location of the case study building contains within it the key elements of the social, cultural, economic, environmental and geographic attributes responsible for the challenges associated high cost of electricity resulting in poorer outcomes for very remote communities. The selected case study is relevant to the practice of a new paradigm in sustainable design based on evidence from field studies on energy performance of households in very remote communities towards the design, construction, maintenance and operation of remote clinics in Australia. The degree of remoteness means that climatic conditions are harsher, infrastructure provision and maintenance costs are higher and the ease of transport and assembly makes the lightweight construction the dominant building material typology, which differs from the other remote area classifications. Further, limitations with respect to financial, time and logistical constraints made it impossible to monitor more than one building type/design at a time. Access with respect to obtaining necessary permits and the willingness of households to participate also limited the selection of buildings to be investigated at the time of the research. It is however expected that findings from this pilot study will provide useful insights to trigger further work on a broader scale specifically targeting very remote communities to grow the energy performance database. The reference model occupies a net floor area which is 67.1 m2 with one occupant and the net area of unoccupied roof space is 71.8 m2. The building is characterized by lightweight steel-framed metal cladded walls on the exterior with plasterboard lining on the internal walls. Roof and walls are insulated, windows are single glazed, heating and cooling are achieved by mechanical means through unitary split AC systems (Figure ).
3.2. Data collection
Actual annual electricity consumption was measured for a period of 12 months from January 2018 to December 2018 using the WattNode ModBus Wattmeter which recorded an annual electricity consumption of 275.5 kWh (4.5 kWh/m2·yr). The input values for the simulation exercise with respect to the thermo-physical characteristics of construction elements, environmental control parameters and schedules including lighting and occupancy were obtained from as-built documentation, site visit/building survey and casual conversations with the occupant. Other inputs such as lighting and equipment power density have been calculated based on site information with guidance from the provisions of the Building Code of Australia (BCA) for class 1 buildings (Table ).
Figure 7. Floor plan, 3D model and Section of case study building using DB.
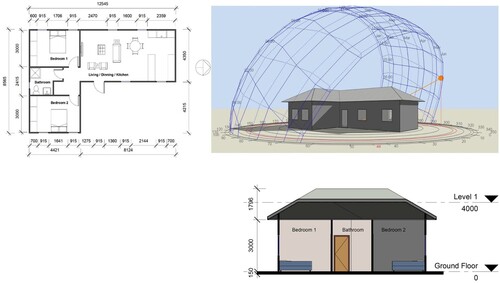
Table 4. Building simulation input data for base case energy simulation.
3.3. Base model development, simulation, calibration and validation
The base model was developed using DB and EP software. DB happens to be one of the most comprehensive user interfaces for EP and maintains the standards of the European Parliament Board of Directive (EPBD). The EP solution is based on the heat and mass balance technique referred to as the Predictor–Corrector Method and assumes that the room air is well stirred, providing a uniform temperature throughout. It also assumes that room surfaces such as walls, windows, ceilings and floors have uniform surface temperatures, uniform long and short wave irradiation and diffuse radiating and reflecting surfaces (Crawley et al. Citation2000). In the modelling, building blocks were considered as composed of building elements such as walls, floor slab and roof, with internal partitions forming four thermal zones to reflect the accommodation schedule. These zones, i.e. bedroom 1, bathroom, bedroom 2 and living/dining/kitchen were partitioned and modelled according to the HVAC drawing. The building is occupied by a single fulltime health care worker hence occupation is estimated at 13 and 24 h on weekdays and weekends, respectively. The air conditioning units operate for approximately 2 h per day in winter and 4 h per day in summer. Table provides details of the base model inputs used to simulate the base model results. The subsequent base model energy simulation resulted in total annual electricity consumption of 339 kWh (5.5 kWh/m2·yr), an overestimation by 63 kWh (1 kWh/m2·yr), hence the model was calibrated for validation against actual data to ensure its suitability for optimization. To calibrate the model, dynamic parameters based on assumptions on operational schedules and user behaviour of the occupant profile were adjusted including lighting power density. Occupancy hours on weekdays and weekends were reduced to 16 and 18 h per day respectively, HVAC operation was reduced from 6 h per day to 4.5 h per day, while lighting power density was reduced from 3.62 W/m2 to 2.95 W/m2 as shown in Table . This is to account for the possibility that not all spaces are occupied at the same time for a sole occupant health care worker, working fulltime.
Table 5. Adjusted parameters for calibrating the base model.
Calibration results and validation with actual data is shown in Figure . Monthly electricity consumption data was used for validation in line with the provisions of International Performance Measurement and Verification Protocol (IPMVP) (IPMVP Citation2002). Three parameters considered for base model validation were annual (January to December), hot season (October to March) and cool season (April to September) energy consumption in the computational simulation process and results compared against acceptable tolerances. For instance, ASHRAE-209 Guideline 14 defines acceptable limits for variances between measured and simulated energy consumption results at 15% Coefficient Variance of Root Mean Square Error (CV-RMSE) and ± 5% Mean Bias Error (MBE), respectively, for energy simulation results (ANSI/ASHRAE Citation2018). Other studies recommend that the annual simulated energy use should be within 10% of metered data, while a difference of less than 25% is acceptable on a seasonal basis (Kaplan and Caner Citation1992; Rahman 2010). The calibration results show that annual and seasonal electricity consumption fall within acceptable tolerances, thus, validates the model as shown in Table .
Figure 8. Simulation results showing fuel breakdown by end use.

Table 6. Annual and seasonal energy consumption showing CV-RMSE & MBE metric comparison between measured and calibrated simulated data.
3.4. Evaluation of ECMs
The retrofit options were investigated and discussed according to the classifications of major intervention ECMs and minor intervention ECMs. The major intervention ECMs were analysed based on changes to the properties of external walls, glazing, shading devices and orientation while the minor intervention ECMs analysed the impacts of lighting upgrades and controls, air tightness and adjustments to indoor temperature setpoints. The interventions are analysed and evaluated based on the annual energy use pattern of the building without compromising occupant thermal comfort. Figure provides a graphical representation of the analysis methodological framework.
Figure 9. Graphical representation of analysis methodological framework.
3.5. Optimization
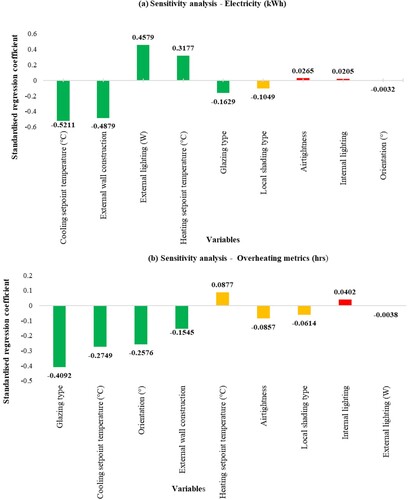
Prior to commencing the optimization process, a sensitivity analysis was conducted based on the multiple regression method to understand the input variables with the potential to have the greatest impact on electricity consumption and overheating metric (unmet cooling hours) (Figure ). This is deemed useful to save time and effort by eliminating variables with minimal impact during the optimization process. Figure (A,B) shows the results from the sensitivity analysis for electricity and overheating metric, respectively. The variables are ranked in order of importance where green, yellow and red indicate high, medium and low importance of the variables, respectively.
Figure 10. Sensitivity analysis. (a) Electricity consumption (kWh/m2 yr). (b) Overheating metric (hrs).
The multi-objective optimization process was employed to assess the impact of the various interventions as such, optimization objectives, constraints and variables were used to guide the simulation process in identifying the best measures/combinations of measures that meet the objectives. The preferred optimal solution is highlighted by the red box in each table. The goal of this phase was to investigate the option(s) that reduce total electricity consumption with minimal unmet cooling hours. Based on this approach, optimal solutions were those deemed to best balance the trade-off between energy consumption and this overheating metric. The constraint set was for the annual energy consumption to be less than 4.5 kWh/m2·yr.
4. Results
4.1. Major intervention ECMs
Orientation: The optimization run for orientation involved 100 generations that resulted in a total number of 2428 iterations when the orientation is adjusted between 0° and 360°. The results show four iterations highlighted in red in Figure . They offer the best performance since they are closer to the overall Pareto front, that is, the contour of solutions that are not surpassed by other solutions regarding minimum total annual electricity consumption and overheating metric. The results show that appropriate orientation of the building can reduce annual electricity consumption by 14% (0.62 kWh/m2·yr) per year and reduce overheating metric by 55% (21.5 h) per year when compared with the base case, depending on the optimal solution considered. Iteration 54 is selected as the optimal design as highlighted in Table .
Figure 11. Pareto front of orientation showing selected optimal solutions.
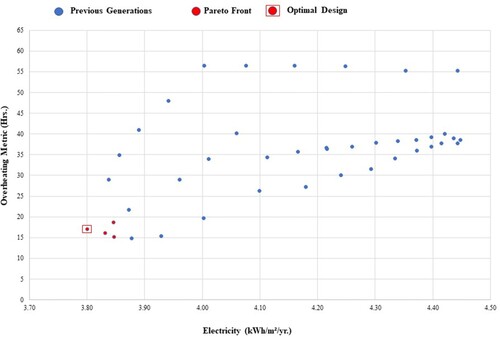
Table 7. Simulation results for orientation optimization parameter.
Wall parameters: For the wall parameters, two wall assembly options were simulated and targeted external walls only; state-of-the-art lightweight and medium/heavy weight wall construction. Figure and Table provide representation of wall assembly types and properties in comparison to the base model including the results.
Figure 12. External wall assembly options considered in the optimization process.
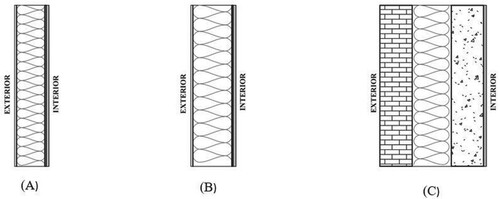
Table 8. Simulation results for wall construction optimization parameters.
For the lightweight optimized wall construction (Figure (B)), the U and R values were slightly improved which increased the overall thickness of the wall by 40 mm when compared to the base model. The medium/heavyweight wall construction had a significantly improved wall construction type to include brickwork to replace the metal cladding on the outer layer and an additional layer of concrete block (Figure (C)). This increased the overall wall thickness by 235 mm including corresponding U and R values for the wall assembly when compared against the base model. A total of 2232 iterations were completed during the optimization process and the results from Table show that using medium/heavyweight wall construction can reduce the annual electricity consumption by 21% (0.96 kWh/m2·yr), also minimizing overheating metric by 35% (13.6 hrs). Similarly, the optimized lightweight wall construction can reduce the annual electricity consumption by 5% (0.2 kWh/m2·yr) while minimizing overheating metric by 11% (4.6 hrs) annually. This finding underscores the importance of a high thermal mass towards energy conservation within this climate for a residential building.
Glazing: This energy conservation measure evaluates the impact of upgrading the existing external glazing with more efficient options. Three types of glazing were compared as described in Table . Low-emission clear single glazing, clear double glazing and low-emission double glazing options were simulated. After simulating a combined total of 2227 iterations for the three glazing types, the results show a reduction in annual total electricity consumption by 7% (0.31 kWh/m2·yr), 10% (0.47 kWh/m2·yr) and 17% (0.79 kWh/m2·yr) for low-emission clear single glazing, clear double glazing and clear low-emission double glazing options, respectively. Similarly, overheating metric was reduced by 23% (9.4 hrs), 34% (13.5 hrs), and 57% (22.7 hrs), respectively. The low-emission double glazing option was applied to the eastern and western-facing facades in isolation and results showed that applying this option had a greater positive impact on the eastern façade than on the western façade indicating that more attention is needed in the façade treatment for the west facing walls with respect to reducing energy consumption. The preferred optimized solution is highlighted in Table .
Table 9. Simulation results for glazing optimization parameters.
Shading devices: Given that the glazing on the building is concentrated on the eastern and western facades, shading devices were introduced to all external glazing in these areas to manage heat gains (Figure ). The eastern and western facades of a building receive large amounts of sunlight in the early morning and late afternoon, respectively. In this instance, four shading types were explored on these facades as follows: 0.5 m overhang (Figure (A)), 0.5 m projection louvres (Figure (B)), 0.5 m projection overhang + side fins (Figure (C)), and a combination of 0.5 m projection louvre + overhang + side fins (Figure (D)).
Figure 13. (A) 0.5 m overhang, (B) 0.5 m projection louvres, (C) 0.5 m projection overhang + side fins, (D) 0.5 m projection louvre + overhang + side fins.
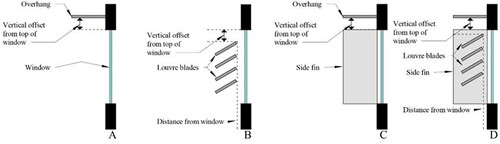
From the results as presented in Table , optimal design 4 has the lowest energy consumption and overheating metric. The results show that combining the three options can reduce electricity consumption by up to 6.9% (0.29 kWh/m2·yr) in comparison to a single option. Further, this option reduces electricity consumption by 12% (0.54 kWh/m2·yr), while minimizing overheating metric by 44% (17.4 hrs) when compared with base case.
Table 10. Simulation results for shading options on eastern and western façade glazing.
An optimization simulation process combining all four major intervention ECMs was also performed to understand overall impact on annual energy consumption and overheating metric when combining all four variables. A total of 4638 iterations for multiple combinations were performed to determine optimal design solutions. From this exercise, two optimal designs emerged as shown in Table . The results showed the variables with the best balance between minimizing annual electricity consumption and overheating metric. For the shading variable, options C and D (Figure ) featured in all optimal solutions while orientation angles ranged from 185° to 200° for best outcomes. For the external wall construction variable, it is observed that 140 mm lightweight construction yields high performance when in combination with other variables as it occurred in 6 options out of 17 while the medium/heavy weight wall construction type occurred in 11. For glazing type variable, only double clear glazing and double low-emission clear glazing featured in the optimal solution when in combination with the other variables (Table ). Iteration 17 provides the best outcome as it reduces electricity consumption by 33.5% (1.49 kWh/m2·yr) with overheating metric reduced by 100% (0 hrs).
Table 11. Simulation results for combination of all major intervention ECMs.
4.2. Minor intervention ECMs
Lighting upgrade and controls: lighting controls were introduced to internal lighting only given the building already had efficient LED lighting with a power density of 2.95 W/m2. For external lighting, the optimization included upgrading the external lights to lighting with an absolute power of between 1 W and 5 W. The results show a decrease in annual electricity consumption by 6.7% (0.3 kWh/m2·yr), 1.7% (0.08 kWh/m2·yr) and 8.1% (0.36 kWh/m2·yr) when external lighting absolute power density is at 1 W, when lighting controls are introduced to internal lighting and a combination of both options are implemented respectively (Table ). No significant difference in discomfort hours was observed between the options.
Table 12. Simulation results for lighting controls and upgrade options.
Air tightness: In Australia, there is also no requirement for whole building air tightness testing as such there have only been a handful of relatively small buildings tested in Australia to date (GBCA Citation2015). The energy efficiency provisions of the National Construction Code (NCC) require the air permeability rate of the building envelope to be about 10 m3/hr·m2 at 50 Pascals. NatHERS considers a rate of 15 air changes per hour (ACH) when the house is pressurized to 50 Pascals a rough acceptable average (Ambrose and Syme Citation2017). Given no testing was undertaken in this research, the optimization parameters looked at options for ACH values between 0 and 20.
After 4912 iterations, the results show no change between the baseline ACH of 0.3 and adjustments between 0.3 and 20 ACH in minimum energy or discomfort metric (Table ).
Table 13. Simulation results for air tightness options.
Adjusting heating and cooling setpoint temperatures: Heating and cooling temperature setpoints were adjusted by ±1° each and results on the impact on energy consumption and overheating metric compared with the base model. Table shows a reduction in electricity consumption by 17.8% (0.8 kWh/m2·yr) and minimized overheating metric by 21% (8.6 hrs) when heating and cooling setpoint temperatures change from 24°C to 23°C and 25°C, respectively.
Table 14. Optimization results for heating and cooling setpoint temperature.
Similar to the major intervention ECMs, optimization was also done when all minor intervention ECMs are considered together to determine the impact on annual electricity consumption and overheating metric. The resultant optimal design minimized electricity consumption by 25% (1.16 kWh/m2·yr) and overheating metric by 21% (8.6 hrs) as shown in Table .
Table 15. Simulation results for combination of all minor intervention ECMs.
Ranking ECMs based on performance indicators: Following the optimization process for the various ECMs, the results facilitated an understanding of the key performance indicators based on the impact of individual ECMs and combining all major and minor intervention ECMs on energy consumption and overheating metric. These options were ranked in the order of performance from highest impact (1) to lowest impact (9) on the building’s energy consumption using total annual energy consumption as the primary basis for comparison, secondary to the corresponding overheating metric in hours (Table and Figure ). It is noted that the HVAC system was not considered as an ECM measure because the existing HVAC system is a highly efficient system with heating and cooling coefficient of performance of 5.81 and 5.95, respectively. Rather, the impact of ECMs is based on percentage variance against the reference model based on known inputs from site building and site survey investigations and compared with actual monitored electricity data.
Figure 14. Graphical representation of various ECMs and impact on energy consumption and occupant thermal comfort.
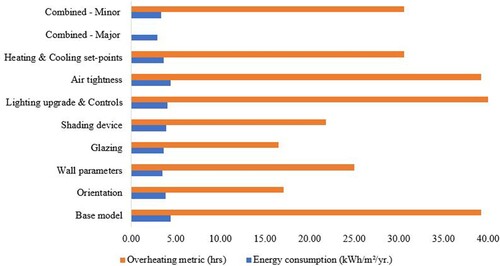
Table 16. Rankings of ECMs based on minimum annual energy consumption.
A summary of the results from Table and Figure shows that overall, combining all minor intervention ECMs provides the best performance by reducing energy consumption by 33.5% (1.49 kWh/m2·yr) when compared against the base model and measured data. For individual ECMs, increased thermal mass by upgrading external walls to 330 mm with insulation performs best by reducing energy consumption by 21% (0.96 kWh/m2·yr) when compared against the base model and measured data. Adjusting heating and cooling setpoint temperatures ranked 4th, decreases electricity consumption by 17.8% (0.8 kWh/m2·yr.) which suggests that minimal investment measures can also significantly reduce energy need and subsequent energy cost for households in remote communities.
The findings provide insights on retrofit options aimed at reducing energy consumption while maintaining thermally acceptable indoor environments for existing buildings however, it is also useful towards the design of new buildings when setting performance targets. To this effect, cumulative energy saving percentages are presented in Table and Figure . The results show the cumulative impact on energy reduction when intervention measures are added one after the other based on their initial performance ranking.
Figure 15. Graphical representation showing cumulative energy saving percentages from retrofit interventions.
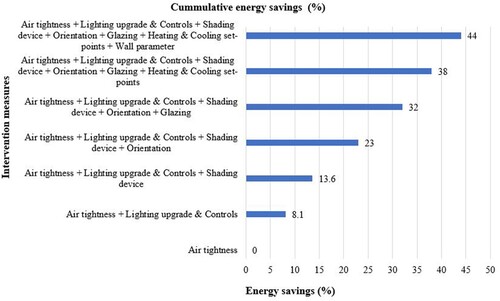
Table 17. Cumulative energy saving percentages from retrofit interventions.
The results from Table show that implementing ECMs can reduce electricity consumption by up to 44%. This percentage can further be reduced when renewable energy systems such as PV solar power are considered (Industry and Science Citation2015). For very remote communities there is great enthusiasm towards this form of energy generation (Byrnes et al. Citation2016). However, the geographical remoteness, dispersed consumers, off-grid electricity supply reliance, low consumption, high supply and maintenance costs and limited ability to pay remain barriers to implementation (Byrnes et al. Citation2016; Reiche, Covarrubias, and Martinot Citation2000; Yadoo and Cruickshank Citation2010). The high upfront and subsequent maintenance cost does not make it economically viable to implement as such, has been excluded this study at this time.
5. Conclusion
Electricity costs remain a significant cost-of-living pressure and stress for many households on low incomes, with greater impact on residents of remote and very remote communities in Australia. Energy conservation measures in buildings have been known to be an effective measure in reducing energy need in households which in turn reduce the cost of electricity bills. This paper adopts an evidence-based approach on a pilot study to explore the impact of various ECMs on an existing residential building within a remote context with the objective of identifying suitable options for interventions that can minimize energy requirements and subsequent costs in very remote households if implemented. It also sought to provide a base for future similar studies in the region based on the findings.
Building performance quantification methods of physical measurements and simulations were used to monitor actual annual electricity consumption in the case study building for 12 months, and the resultant data was used for comparison and validation purposes with simulated results respectively. Further, a systematic evaluation was done for various ECMs on the basis of the relationship between their energy savings and occupant thermal comfort and ranked in order of performance following a sensitivity analysis and optimization process. The ECMs were categorized into major intervention and minor intervention where the minor intervention ECMs requiring minimal financial investment could directly apply to existing buildings while the major intervention ECMs such as orientation and wall parameters could typically apply to the design of new buildings.
The results show that implementing all the major ECMs provides the greatest impact in reducing energy consumption by up to 44% therefore has the highest ranking as shown in Table . Other performance indicators such as adjusting the heating and cooling setpoint temperatures of the HVAC system by ±1°C, lighting upgrades and controls, and the application of shading devices to all external windows can save up to 17.8%, 8.1% and 12% of annual electricity consumption, respectively. However, as a major outcome, it was observed that lightweight construction performs poorly (5% reduction) in this climate compared to medium/heavy weight (21% reduction) wall type when considered as a standalone intervention measure. This result is of particular significance given that the dominant wall construction type in very remote communities is lightweight steel construction due to the ease of assembly, transportation and delivery in response to logistical and economic challenges faced in this region. Therefore, careful consideration should be given to this element of the building envelope in terms of trade-offs during decision making. The study revealed that ECMs can be successfully applied to buildings located in desert like climates which is hot and arid where high-energy use of air conditioning systems is required to maintain thermal comfort. In very remote communities with extreme weather conditions such as in Wanarn, the implementation of minor intervention energy conservation measures as demonstrated in the results of this study is strongly recommended when considering any renovation or refurbishment works due to the economic viability. This study, while limited to a single building typology and occupancy profile does not lend itself to make generalizations, but rather speaks to the unique characteristics of very remote communities where the one size fits all approach is seldom successful in the region. Rather, the findings are deemed useful towards the gradual application across the differing typologies and occupancy profiles that characterize these communities, further expanding this body of work. This in turn will go a long way in alleviating the cost pressures on everyday living and hardship faced by households due to high-energy costs.
Disclosure statement
No potential conflict of interest was reported by the author(s).
Data availability statement
The data that support the findings of this study are available from the corresponding author, [S.U.], upon reasonable request.
References
- Aboulnaga, Mohsen, and Mohamed Moustafa. 2016. “Sustainability of Higher Educational Buildings-Retrofitting Approach to Improve Energy Performance and Mitigate CO2 Emissions in hot Climates.” Renewable Energy and Environmental Sustainability 1:28. https://doi.org/10.1051/rees/2016016.
- ABS (Australian Bureau of Statistics). 2017. Census of Population and Housing – Counts of Aboriginal and Torres Strait Islander Australians. Australian Bureau of Statistics. Accessed 31 January 2021. https://www.abs.gov.au/statistics/people/aboriginal-and-torres-strait-islander-peoples/census-population-and-housing-counts-aboriginal-and-torres-strait-islander-australians/latest-release#counts-by-remoteness-area.
- AECOM. 2014. Australia’s Off-Grid Clean Energy Market Research Paper. Canberra: Australian Renewable Energy Agency.
- Al-Sanea, Sami A, M.F. Zedan, A.M. Al-Mujahid, and Z.A. Al-Suhaibani. 2016. “Optimum R-Values of Building Walls Under Different Climatic Conditions in the Kingdom of Saudi Arabia.” Applied Thermal Engineering 96:92–106. https://doi.org/10.1016/j.applthermaleng.2015.11.072.
- Al-Tamimi, Nedhal. 2022. “Passive Design Strategies for Energy Efficient Buildings in the Arabian Desert.” Frontiers in Built Environment 177. https://doi.org/10.3389/fbuil.2021.805603
- Al-Tamimi, Nedhal, and Sharifah Fairuz Syed Fadzil. 2012. “Energy-efficient Envelope Design for High-Rise Residential Buildings in Malaysia.” Architectural Science Review 55 (2): 119–127. https://doi.org/10.1080/00038628.2012.667938.
- Alaidroos, Alaa, and Moncef Krarti. 2015. “Optimal Design of Residential Building Envelope Systems in the Kingdom of Saudi Arabia.” Energy and Buildings 86:104–117. https://doi.org/10.1016/j.enbuild.2014.09.083.
- Alayed, Essam, Richard O'hegarty, and Oliver Kinnane. 2021. “Thermal Envelope Analysis for New Code Compliance of Saudi Arabian Dwellings.” Energy and Buildings 243:110997. https://doi.org/10.1016/j.enbuild.2021.110997.
- Alexander, J., M. Gabrielle, T. Houstein, M. Rooney, P. Watson, S. Watson, and A. Vikstrom. 2016. Get Bill Smart Final Report. Hobart: Sustainable Living Tasmania and the University of Tasmania.
- Alliance, South East Councils Climate Change. 2016. Final Report: Low Income Energy Saver Direct Care and Motivators Project, Victoria, Australia.
- Ambrose, Michael, and Mike Syme. 2017. “Air Tightness of New Australian Residential Buildings.” Procedia Engineering 180:33–40. https://doi.org/10.1016/j.proeng.2017.04.162.
- Anderson, David M, David B Belzer, Olga V Livingston, and Michael J Scott. 2014. “Assessing National Employment Impacts of Investment in Residential and Commercial Sector Energy Efficiency: Review and Example Analysis.” https://doi.org/10.13140/RG.2.1.3211.3124.
- ANSI/ASHRAE, Standard 209-2018. 2018. ANSI/ASHRAE Standard 209-2018 Energy Simulation Aided Design For Buildings Except Low-Rise Residential Buildings.
- Australian Building Codes Board. 2018. JV3–Energy Efficiency Handbook, edited by ABCB. Canberra: ACT: Australian Building Codes Board.
- Australian Bureau of Meteorology, ABOM. . 2022. “Annual and Monthly Heating and Cooling Degree Days.” http://www.bom.gov.au/climate/map/heating-cooling-degree-days/documentation.shtml#:~:text=The%20BASE%20values%20used%20are,24%20degrees%20Celsius%20for%20cooling.
- Australian Government – Department of Industry, Innovation and Science. 2016. Switched on Homes Final Report, Gosnells, WA.
- Australian Government Productivity Commission. 2017. Introducing Competition and Informed User Choice Into Human Services: Reforms to Human Services-Draft Report. Canberra: Commonwealth Government of Australia.
- Ayres, Robert U, Hal Turton, and Tom Casten. 2007. “Energy Efficiency, Sustainability and Economic Growth.” Energy 32 (5): 634–648. https://doi.org/10.1016/j.energy.2006.06.005.
- Bank, World. 2021. “Energy Overview.” Accessed 23 February 2021. https://www.worldbank.org/en/topic/energy/overview.
- Bedggood, Rowan, Karen Farquharson, Denny Meyer, Aron Perenyi, Phillip Bedggood, Clare Johansson, Gina Milgate, Joanna Leece, Jim Downey, and Ian Bloomfield. 2016. KEEP Koorie Energy Efficiency Project. Melbourne: Swinburne University of Technology.
- Berardi, Umberto. 2015. “Building Energy Consumption in US, EU, and BRIC Countries.” Procedia Engineering 118:128–136. https://doi.org/10.1016/j.proeng.2015.08.411.
- BEST Employment Ltd. 2016. New England/North West Energy Efficiency Campaign. Glen Innes: Department of Industry, Innovation and Science.
- Bianchi, Carlo, and Amanda D Smith. 2019. “Localized Actual Meteorological Year File Creator (LAF): A Tool for Using Locally Observed Weather Data in Building Energy Simulations.” SoftwareX 10:100299. https://doi.org/10.1016/j.softx.2019.100299.
- Bird, Stephen, and Lisa Legault. 2018. “Feedback and Behavioral Intervention in Residential Energy and Resource Use: A Review.” Current Sustainable/Renewable Energy Reports 5 (1): 116–126. https://doi.org/10.1007/s40518-018-0106-8.
- Board, Australian Building Codes. 2019. NCC Volume One: Energy Efficiency Provisions. Canberra: Australian Building Codes Board.
- Bright Actions. 2016. Energy to Save: Delivering an Energy Efficiency Service to People from a Refugee Background: Final Report of the Bright Actions Project. Queensland: Commonwealth Government of Australia.
- Buergelt, Petra T., Elaine L. Maypilama, Julia McPhee, Galathi Dhurrkay, Shirley Nirrpuranydji, Sylvia Mänydjurrpuy, Marrayurra Wunungmurra, Timophy Skinner, Anne Lowell, and Simon Moss. 2017. “Working Together with Remote Indigenous Communities to Facilitate Adapting to Using Energy Wisely: Barriers and Enablers.” Energy Procedia 121:262–269. https://doi.org/10.1016/j.egypro.2017.08.026.
- Buergelt, Petra, Elaine Maypilama, Julia McPhee, Anne Lowell, and Simon Moss. 2016. Manymak Energy Efficiency Project, Darwin, NT.
- Burleyson, Casey D., Nathalie Voisin, Z. Todd Taylor, Yulong Xie, and Ian Kraucunas. 2018. “Simulated Building Energy Demand Biases Resulting from the Use of Representative Weather Stations.” Applied Energy 209:516–528. https://doi.org/10.1016/j.apenergy.2017.08.244.
- Button, Leeane, Geoff Lodge, and Dawn Taylor. 2016. Power Down Project: GV Community Energy. Murchison: Department of Industry, Innovation & Science.
- Byrne, Graeme, Bradley Jorgensen, Lena Jungbluth, and Liam Smith. 2016. Home Energy Efficiency Upgrade Program Final Report Section 2, Melbourne, VIC.
- Byrnes, Liam, Colin Brown, Liam Wagner, and John Foster. 2016. “Reviewing the Viability of Renewable Energy in Community Electrification: The Case of Remote Western Australian Communities.” Renewable and Sustainable Energy Reviews 59:470–481. https://doi.org/10.1016/j.rser.2015.12.273.
- CAT (Centre for Appropriate Technologies). 2021. “B5 Energy.” Accessed 20 February 2021. https://cfat.org.au/national-indigenous-infrastructure-guide.
- Chan, A.L.S. 2011. “Developing a Modified Typical Meteorological Year Weather File for Hong Kong Taking Into Account the Urban Heat Island Effect.” Building and Environment 46 (12): 2434–2441. https://doi.org/10.1016/j.buildenv.2011.04.038.
- Çomaklı, Kemal, and Bedri Yüksel. 2003. “Optimum Insulation Thickness of External Walls for Energy Saving.” Applied Thermal Engineering 23 (4): 473–479. https://doi.org/10.1016/S1359-4311(02)00209-0.
- Cooper, Paul, Ross Gordon, Gordon Waitt, Deborah Petkovic, Natalie Burroughs, Michael Tibbs, Katherine Butler, Kate Roggeveen, Clayton McDowell, and Georgios Kokogiannakis. 2016. EE3A: Pathways and Initiatives for Low-income Older People to Manage Energy, Illawara, NSW.
- Crawley, Drury B, Linda K Lawrie, Curtis O Pedersen, and Frederick C Winkelmann. 2000. “Energy Plus: Energy Simulation Program.” ASHRAE Journal 42 (4): 49–56.
- Dababt, Aman, and Haneen Awad. 2017. “Optimum Insulation Thickness of External Walls for Energy Saving”.
- Delmas, Magali A, Miriam Fischlein, and Omar I Asensio. 2013. “Information Strategies and Energy Conservation Behavior: A Meta-Analysis of Experimental Studies from 1975 to 2012.” Energy Policy 61:729–739. https://doi.org/10.1016/j.enpol.2013.05.109.
- Department of Industry, Science, Energy and Resources. 2016. Low Income Energy Efficiency Program (LIEEP). Department of Industry, Innovation and Science. https://www.energy.gov.au/publications/low-income-energy-efficiency-program-lieep.
- Department of Industry, Science, Energy and Resources. 2020. Australian Energy Update 2020, Australian Energy Statistics. Canberra.
- Department of the Environment and Energy. 2019. Australian Energy Update 2019, Australian Energy Statistics. Canberra.
- Ding, Yinchun, Yang Shen, Jianguo Wang, and Xing Shi. 2015. “Uncertainty Sources and Calculation Approaches for Building Energy Simulation Models.” Energy Procedia 78: 2566–2571. https://doi.org/10.1016/j.egypro.2015.11.283.
- Duell, M., F. De Boer, C. Enthaler, M. Anda, G. James, L. Zappavigna, G. Bibra, Z. Hughes, and G. Boyle. 2006. “Scoping Study of Design and Thermal Performance in the Desert Built Environment.” Research Report 14, Desert Knowledge Cooperative Research Centre, Alice Springs.
- Economic Regulation Authority. 2019. Annual Performance Report – Energy Retailers 2017/18, Perth.
- Energy Consult Pty Ltd. 2015. Residential Energy Baseline Study: Australia, 2000–2030. Jindivick: Department of Industry & Science.
- Energy Consumers Australia. 2019. “Energy in Remote Indigenous Communities: Resources to Support Further Research, Behaviour Change and Practice Improvements”.
- Energy, Exemplary. 2019. “Weather, Climate and Solar Data for Australian Locations. 5.” Accessed August 2020.
- Erba, Silvia, Francesco Causone, and Roberto Armani. 2017. “The Effect of Weather Datasets on Building Energy Simulation Outputs.” In 9th International Conference on Sustainability in Energy and Buildings, SEB-17.
- Fagan, Kate, and Housing Australia. 2008. “A National Energy Efficiency Program to Assist Low-income Households.” Collections 68:68.
- Fanger, Poul O. 1970. Thermal Comfort. Analysis and Applications in Environmental Engineering.
- Fien, John, Esther Charlesworth, Gini Lee, David Morris, Douglas Baker, and Tammy Grice. 2007. “Flexible Guidelines for the Design of Remote Indigenous Community Housing.” In Australian Housing and Urban Research Institute Positioning Paper Series.
- Foran, T., R. Williams, B. Spandonide, D. Fleming, D. Race, and A.M. Dowd. 2015. “A Conversation About Energy Futures for Remote Australian Communities–Theory and Detailed Workshop Findings.” In CRC-REP Working Paper. Alice Springs: Ninti One.
- GBCA (Green Building Council Australia). 2015. “Innovation Challenges Handbook.” In Building Air Tightness, edited by Umow Lai, 19–22. Sydney: Green Building Council of Australia.
- Geller, Howard, Philip Harrington, Arthur H Rosenfeld, Satoshi Tanishima, and Fridtjof Unander. 2006. “Polices for Increasing Energy Efficiency: Thirty Years of Experience in OECD Countries.” Energy Policy 34 (5): 556–573. https://doi.org/10.1016/j.enpol.2005.11.010.
- GHW (Green Heart Wisdom). 2016. Supporting Low-income Senior Households to Reduce Energy use. Brisbane: Brisbane City Council.
- Goussous, Jawdat, Hadi Siam, and Hussain Alzoubi. 2015. “Prospects of Green Roof Technology for Energy and Thermal Benefits in Buildings: Case of Jordan.” Sustainable Cities and Society 14:425–440. https://doi.org/10.1016/j.scs.2014.05.012.
- Green, Donna, Sue Jackson, and Joe Morrison. 2009. Risks from Climate Change to Indigenous Communities in the Tropical North of Australia. Canberra: ACT: Department of Climate Change, Commonwealth of Australia.
- Guide, A. 2006. Environmental Design. Chartered Institute of Building Services Engineers (CIBSE).
- Hasan, Susan Abed. 2018. “The Impact of Residential Building's Design on the Energy Consumption in hot Desert Climate (Baghdad City as an Example).” Journal of Urban and Environmental Engineering 12 (1): 88–92. https://doi.org/10.4090/juee.2018.v12n1.088092.
- Hong, Tianzhen, Wen-Kuei Chang, and Hung-Wen Lin. 2013. “A Fresh Look at Weather Impact on Peak Electricity Demand and Energy use of Buildings Using 30-Year Actual Weather Data.” Applied Energy 111:333–350. https://doi.org/10.1016/j.apenergy.2013.05.019.
- Hong, Tianzhen, Hung-Wen Lin, Wen-Kuei Chang, Liping Wang, Da Yan William Turner, Dandan Zhu, Xin Zhou, Chuang Wang, and Chen Peng. 2013. Building Performance Simulation. Berkeley, CA: Lawrence Berkeley National Lab.
- Howden-Chapman, Philippa, and Nicholas Preval. 2014. “Cobenefits of Insulating Houses: Research Evidence and Policy Implications.” Wellbeing: A Complete Reference Guide, 1–20. https://doi.org/10.1002/9781118539415.wbwell076.
- IBPSA, USA. 2020. “Building Energy Software Tools.” Last Modified 9 August 2020. https://www.buildingenergysoftwaretools.com/software-listing?keywords=&field_catagory_tid%5B%5D=201&field_platform_tid=All&field_price_tid=All&field_last_updated_value%5Bvalue%5D%5Byear%5D=2010&field_language_tid=All&keys=&sort_by=field_rating_rating&sort_order=DESC&items_per_page=40.
- Industry, Department of the, and Science. 2015. Residential Energy Baseline Study. Australia: Department of the Industry and Science Canberra, Australia Capital Territory, ACT.
- IPMVP. 2002. “Concepts and Options for Determining Energy and Water Savings.” In International Performance Measurement and Verification Protocol Committee. TN, USA: U.S. Department of Energy. Volume I.
- James, Melissa, and Michael Ambrose. 2017. “Retrofit or Behaviour Change? Which has the Greater Impact on Energy Consumption in Low Income Households?” Procedia Engineering 180:1558–1567. https://doi.org/10.1016/j.proeng.2017.04.318.
- Kaplan, Michael, and Phoebe Caner. 1992. Guidelines for Energy Simulation of Commercial Buildings: Final. Portland, OR: Kaplan Engineering.
- Lee, Trevor. 2011. “Climate Data for Building Optimisation in Design and Operation in Australia.” In Proceedings of Building Simulation.
- Lin, Hung-Wen, and Tianzhen Hong. 2013. “On Variations of Space-Heating Energy Use in Office Buildings.” Applied Energy 111:515–528. https://doi.org/10.1016/j.apenergy.2013.05.040.
- Littlewood, John, Catalina Spataru, Robert J Howlett, and Lakhmi C Jain. 2017. Smart Energy Control Systems for Sustainable Buildings. Vol. 67. Cham: Springer.
- Lynch, David, Jackie Tuck, Craig Hurley, Penny Fraser, and Joanne Brown. 2016. Final Report: Glenelg SAVES Consortium. Hamilton: Federation Business School, Southern Grampians Glenelg Primary Care Partnership, Department of Industry, Innovation and Science.
- MacFarlane, Donna. 2016. “The Six Seasons of WA.” Last Modified 2016, accessed 14 April 2019. https://www.newintown.com.au/latest-news-blog/2015/6/19/the-six-seasons-of-wa.
- Maleny, Including, and Christmas Island. 2017. “Creation of NatHERS 2016 Reference Meteorological Years”.
- Maru, Yiheyis Taddele, Vanessa Chewings, and Ashley Sparrow. 2012. “Climate Change Adaptation, Energy Futures and Carbon Economies in Remote Australia: A Review of the Current Literature, Research and Policy.” In CRC-REP Working Paper CW005, Alice Springs, NT.
- McCafferty, Georgia. 2016. “The world's most remote community?”, accessed June 14, 2017. https://edition.cnn.com/style/article/wanarn-clinic-australia/index.html.
- McGee, Caitlin. 2017. Department of the Environment and Energy. 2017. In Your Home: Australia’s Guide to Environmentally Sustainable Homes. 5th ed.
- McKenzie, M. 2013. Prepayment Meters and Energy Efficiency in Indigenous Households. NT, Australia: BushLight, Center for Appropriate Technology.
- Northern Grampians Shire Council. 2016. Low Income Energy Efficiency Project Final Report: Innovation and Opportunities in Energy Efficiency for Disadvantaged Members of Our Community. Stawell: Department of Industry, Innovation and Science.
- Nous Group. 2017. Efficient system costs of Remote Indigenous housing: Input into the Review of the National Partnership Agreement on Remote Indigenous Housing.
- Ochedi, Ekele, and A.H. Taki. 2019. “Energy Efficient Building Design in Nigeria: An Assessment of the Effect of the Sun on Energy Consumption in Residential Buildings.” https://doi.org/10.15640/jea.v7n1a6.
- O’Mullane, Linda, and Lance Hoch. 2016. Home Energy Efficiency Upgrade Program Final Report Chapter 6, Fitzroy.
- Partners, Exemplary Energy. 2014. “Australian Solar and Weather and Climate and Microclimate Data for Building Energy Simulation.” Accessed 29 March 2021. http://exemplary.com.au/information/FAQ.php.
- Provision, Steering Committee for the Review of Government Service. 2020. Overcoming Indigenous Disadvantage: Key Indicators 2007: Report: The Committee.
- Pyrgou, Andri, Veronica Lucia Castaldo, Anna Laura Pisello, Franco Cotana, and Mattheos Santamouris. 2017. “Differentiating Responses of Weather Files and Local Climate Change to Explain Variations in Building Thermal-Energy Performance Simulations.” Solar Energy 153:224–237. https://doi.org/10.1016/j.solener.2017.05.040.
- QCOSS (Queensland Council of Social Service). 2014. Empowering Remote Communities: Experiences of Aboriginal and Torres Strait Islander Customers Using Electricity Pre-payment Meters in Queensland. Brisbane: Ninti One.
- Qian, Defeng, Yanfei Li, Fuxin Niu, and Zheng O'Neill. 2019. “Nationwide Savings Analysis of Energy Conservation Measures in Buildings.” Energy Conversion and Management 188:1–18. https://doi.org/10.1016/j.enconman.2019.03.035.
- Queensland Productivity Commission. 2016. Electricity Pricing Inquiry – Final Report, Brisbane.
- Rahman, Md Mustafizur, M.G. Rasul, and Mohammad Masud Kamal Khan. 2010. “Energy Conservation Measures in an Institutional Building in sub-Tropical Climate in Australia.” Applied Energy 87 (10): 2994–3004. https://doi.org/10.1016/j.apenergy.2010.04.005.
- Reiche, Kilian, Alvaro Covarrubias, and Eric Martinot. 2000. “Expanding Electricity Access to Remote Areas: Off-Grid Rural Electrification in Developing Countries.” Fuel 1 (1.2): 1–4.
- Romanach, L., S. Meikle, N. Hall, and J. Gardner. 2016. “Green Heart Wisdom: Supporting Low-income Senior Households to Reduce Energy Use.” In Final Report from CSIRO. Commonwealth Scientific and Industrial Research Organisation, Australia. Brisbane City Council.
- Sbar, Neil L, Lou Podbelski, Hong Mo Yang, and Brad Pease. 2012. “Electrochromic Dynamic Windows for Office Buildings.” International Journal of Sustainable Built Environment 1 (1): 125–139. https://doi.org/10.1016/j.ijsbe.2012.09.001.
- SCRGSP (Steering Committee for the Review of Government Service Provision). 2020. Overcoming Indigenous Disadvantage: Key Indicators 2020.
- Selvakkumaran, Sujeetha, and Bundit Limmeechokchai. 2013. “Energy Security and co-Benefits of Energy Efficiency Improvement in Three Asian Countries.” Renewable and Sustainable Energy Reviews 20:491–503. https://doi.org/10.1016/j.rser.2012.12.004.
- Skillset Environment. 2016. Overcoming Motivation as a Barrier to Energy Efficiency amongst Low Income Apprentices and Trainees in Regional NSW. Bathurst, NSW: Department of Industry, Innovation and Science.
- Spandonide, Bruno. 2014. “Transport Systems in Remote Australia: Transport Costs in Remote Communities.” In CRC-REP Working Paper CW0017. Alice Springs: Ninti One.
- Statistics, Australian Bureau of. 2006. Population Characteristics, Aboriginal and Torres Strait Islander Australians.
- Steinborner, J.L., C. Michael, J.B. Trombley, and E. Halawa. 2016. Smart Cooling in the Tropics Report. Canberra: Department of Industry, Innovation and Science.
- Stokes, Helen, Roger Holdsworth, and John Stafford. 1999. Rural and Remote School Education: A Survey for the Human Rights and Equal Opportunity Commission. Melbourne: Youth Research Centre, University of Melbourne.
- Strempel, Anna, Larissa Nicholls, and Yolande Strengers. 2015. Disconnections Case Studies: Understanding the Householder Experience. RMIT University.
- Sullivan, Damian. 2016. ‘Discrete Choice Experiment, Results and Analysis for Home Energy Efficiency Upgrade Program (HEEUP) in Home Energy Efficiency Upgrade Program: Final Report. Fitzroy: Monash University, Department of Economics.
- Sustainable Business Australia. 2016. Low Income Energy Efficiency Program (LIEEP), Sustainable Business Australia, Our Green Home – Final Report. Sustainable Business Australia (SBA) Limited, Apex Australia Charitable Fund Inc., Object Consulting Pty Ltd, Connection Research Services Pty Ltd.
- Swinton, Tim, Jo-Anne Little, Rebekah Russell-Bennett, Rory Mulcahy, Ryan McAndrew, and Cherie Passion. 2016. Reduce Your Juice Digital Social Marketing Program (LIEEP). Brisbane: USC Business School – Legacy, University of the Sunshine Coast, Queensland.
- Szava, Anna, Mark Moran, Bruce Walker, and Gerry West. 2007. The Cost of Housing in Remote Indigenous Communities: Views from the Northern Territory Construction Industry. Alice Springs: Ninti One.
- Taylor, Jonathon, Phil Symonds, Paul Wilkinson, Clare Heaviside, Helen Macintyre, Michael Davies, Anna Mavrogianni, and Emma Hutchinson. 2018. “Estimating the Influence of Housing Energy Efficiency and Overheating Adaptations on Heat-Related Mortality in the West Midlands, UK.” Atmosphere 9 (5): 190. https://doi.org/10.3390/atmos9050190.
- Towart, R., R. Griew, S. Murphy, and F. Pascoe. 2017. Remote Housing Review: A Review of the National Partnership Agreement on Remote Indigenous Housing and the Remote Housing Strategy (2008–2018). Canberra: Commonwealth of Australia.
- Trewin, D. 2001. Information Paper: ABS Views on Remoteness. Canberra: Australian Bureau of Statistics (ABS).
- Tsoka, Stella, K. Tolika, T. Theodosiou, K. Tsikaloudaki, and Dimitrios Bikas. 2018. “A Method to Account for the Urban Microclimate on the Creation of ‘Typical Weather Year’ datasets for Building Energy Simulation, Using Stochastically Generated Data.” Energy and Buildings 165:270–283. https://doi.org/10.1016/j.enbuild.2018.01.016.
- Uniting Communities. 2016. Beat the Heat! Final Report. Adelaide: Department of Industry, Innovation & Science.
- Urmee, Tania, Sid Thoo, and Winnie Killick. 2012. “Energy Efficiency Status of the Community Housing in Australia.” Renewable and Sustainable Energy Reviews 16 (4): 1916–1925. https://doi.org/10.1016/j.rser.2012.01.034.
- Ward, Michael, and Daniel Brent. 2016. Home Energy Efficiency Upgrade Program Final Report Appendix G, Fitzroy.
- WED (World Energy Data). 2020a. “The Energy System of Australia.” Accessed 16 Novemeber 2020. https://www.worldenergydata.org/australia/#identifier_15_3213.
- WED (World Energy Data). 2020b. “The Energy System of the People’s Republic of China.” Accessed 16 November 2020. https://www.worldenergydata.org/china/.
- WED (World Energy Data). 2020c. “World Energy Supply.” Accessed 16 November 2020. https://www.worldenergydata.org/world-energy-supply/.
- Welfare, Australian Institute of Health. 2011. “Australian Health Expenditure by Remoteness: A Comparison of Remote, Regional and City Health Expenditure.” In Cat. no. HWE 50. Canberra: AIHW Canberra.
- Willand, Nicola, Cecily Maller, and Ian Ridley. 2019. “Addressing Health and Equity in Residential low Carbon Transitions–Insights from a Pragmatic Retrofit Evaluation in Australia.” Energy Research & Social Science 53:68–84. https://doi.org/10.1016/j.erss.2019.02.017.
- Yadoo, Annabel, and Heather Cruickshank. 2010. “The Value of Cooperatives in Rural Electrification.” Energy Policy 38 (6): 2941–2947. https://doi.org/10.1016/j.enpol.2010.01.031.
- Yang, Amy, Anne Martinelli, D. Settle, R. Erwin, and N. Crawley. 2020a. The Future Powered Families Report. Carlton: Department of Industry, Innovation and Science.
- Yang, Amy, Anne Martinelli, D. Settle, R. Erwin, and N. Crawley. 2020b. “The Future Powered Families Report.” In Final Report for LIEEP, Environment Australia.
- Yu, Chuan-Rui, Han-Sen Guo, Qian-Cheng Wang, and Rui-Dong Chang. 2020. “Revealing the Impacts of Passive Cooling Techniques on Building Energy Performance: A Residential Case in Hong Kong.” Applied Sciences 10 (12): 4188. https://doi.org/10.3390/app10124188.