
 ?Mathematical formulae have been encoded as MathML and are displayed in this HTML version using MathJax in order to improve their display. Uncheck the box to turn MathJax off. This feature requires Javascript. Click on a formula to zoom.
Abstract
From 1990 to 2016, , air conditioning usage in the UAE increased from 25 to 125 terawatt hours, making up 70% of the country's electricity consumption. Overcooling to 18°C in homes is common, leading to health issues and reduced learning efficiency during the Covid-19 pandemic. This study uses Electroencephalograms (EEG) to examine indoor thermal environments' impact on learning efficiency. An artificial climate chamber set at 24°C or 20.5°C monitored 64 healthy males aged 21–29 during a 70-minute EEG session. Participants took a Visual Continuous Performance test and had their academic performance evaluated. Seven brain areas were analyzed for attention and power frequency. Results showed lower temperatures (20.5°C) increased EEG frequency, indicating better attention than 24°C. Statistical analysis revealed that concentration was achieved faster at lower temperatures. This study highlights the importance of optimizing indoor temperatures for improved learning efficiency and well-being.
1. Introduction
As global temperatures continue to rise, nations grapple with adapting to a changing climate. Urban centres, with their dense populations and expansive infrastructures, are on the frontline of this transformation. These metropolises are not only witnessing an escalation in temperatures due to global warming but are also contending with the urban heat island effect, which exacerbates heat levels due to human activities and construction. As a result, residents of these urban locales have increasingly sought refuge in controlled indoor environments, relying heavily on artificial cooling methods (Tamasiga et al. Citation2022).
Dubai, one of the most iconic cities in the Middle East, is a prime example of this trend. Characterized by its towering skyscrapers and rapid urban expansion, Dubai endures a scorching summer that extends from May to October. The month of August, in particular, is especially unforgiving, with temperatures frequently soaring past the 50 °C mark. Even the nighttime offers scant relief, as the mercury seldom dips below 30 °C (Awad and Jung Citation2021; Jung and Qassimi Citation2022). This relentless heat, combined with Dubai's urban architecture, has led its residents to spend over 90% of their time indoors (Arar and Jung Citation2021). This indoor retreat, however, comes with its own challenges and implications, as the increasing reliance on air conditioning and overcooling practices amplifies energy consumption and has significant ramifications for health and learning efficiency, topics this study seeks to delve into.
The challenge arises when one considers the dynamics of indoor temperature regulation. From 1990 to 2016, there was a staggering increase in air conditioning use in the UAE, from 25 to 125 terawatt hours. This accounted for a massive 70% of the country's electricity consumption. The trend towards overcooling, with homes chilled to as low as 18°C, has become a concerning norm. This practice, far removed from Dubai Electricity & Water Authority (DEWA)'s recommended thermostat setting of 24 °C, not only amplifies energy consumption but has health ramifications and potentially affects student learning efficiency, especially in the backdrop of the Covid-19 pandemic (Jung et al. Citation2021; Jung and Awad Citation2021).
This shift towards subdivided housing and variable indoor environments presents a multifaceted challenge. Global research on optimizing indoor environments, especially in support of learning, has typically focused on measuring productivity outcomes (Frontczak and Wargocki Citation2011). However, these measurements often miss the nuanced processes, like attention, integral to learning (Al Horr et al. Citation2016; Kapoor et al. Citation2021). A comprehensive understanding of how indoor environments physiologically and psychologically impact human beings and their productivity remains elusive (Salamone et al. Citation2021).
Considering the cognitive processes, our capacity to process information is bounded. Attention, an early and pivotal stage in the learning journey, dictates how we perceive and process information (Kadri et al. Citation2019; Yao and Hsieh Citation2019). Neurologically anchored, attentional deficits can severely hinder behaviour and learning, a fact underscored by studies employing brain imaging techniques like Functional Magnetic Resonance Imaging (FMRI) (Lim, Yeo, and Yoon Citation2019; Paszkiel et al. Citation2021; Petersen and Posner Citation2012).
Recent publications span disciplines from education to ergonomics and highlight the importance of concentration, often assessed through brainwave studies (Xu and Zhong Citation2018). However, there is a gap. Most research linking concentration to the physical indoor environment relies on psychological tests that offer a macro view but miss the intricate details of attentional processes (Bergomi, Tschacher, and Kupper Citation2013; Dichev and Dicheva Citation2017; Gray et al. Citation2012; Sun Citation2014). In contrast, electroencephalograms (EEG) provide dynamic, time-sensitive insights into brain activity, making them a potent tool for understanding concentration nuances (Arana-Llanes et al. Citation2018; Nguyen, Nguyen, and Zeng Citation2018; Sawai et al. Citation2022).
Building upon this rich tapestry of research, the present study introduces several novel elements:
Interdisciplinary Approach: We bridge diverse fields by using EEG to delve deep into the physiological effects of indoor thermal environments on attention.
Precision with EEG: Unlike many prior studies, our use of EEG allows for a nuanced, real-time understanding of attentional processes under different thermal conditions.
Focus on Indoor Thermal Environment: Our exploration of indoor thermal environments and their effects on attention is especially relevant given the increasing urban heat challenges and the growing reliance on artificial cooling.
Contextual Relevance: As cities like Dubai grapple with rising temperatures and the urban heat island effect, our study's findings could have profound implications for energy consumption, health, and learning efficiency.
Holistic Examination: Beyond measuring attention levels, we aim to holistically understand the interplay between temperature, cognitive processes, and subjective thermal comfort.
With this context established, our study explores the indoor thermal environment's effects on occupants’ attention, employing the precision of EEG. We aim to discern variations in attention-related EEG across different room temperatures, understand temporal changes in attention metrics, and uncover the intricate relationships between reported thermal comfort and attention focus.
2. Materials and methods
Table encapsulates the methods and procedures detailed in the provided section, organizing the research process into a structured and logical sequence. Each step represents a phase in the research where specific methodologies are applied to achieve the objectives of the study.
Table 1. Sequential Outline of the Research Process and Methods.
2.1. Brain waves and attention
EEG amplifies and records the microscopic electrical activity of the brain on the scalp (Biasiucci, Franceschiello, and Murray Citation2019). According to the frequency characteristics, it can be classified into Delta waves (δ), Theta waves (θ), Alpha (α), Beta waves (β), and Gamma waves (γ) in the order of low frequency to high-frequency range (Choi et al. Citation2021). Each frequency band has different characteristics, as shown in Table , reflecting brain function and nervous system activity.
Table 2. EEG Frequency Band Classification and Related Brain Activity.
Theta wave (θ) is a band that appears mainly in regular sleep or when tired or meditating (Chen, Wang, and Yu Citation2017). If theta waves are generated a lot in awakening, the brain is in a sleep state, and a decrease in brain function may be suspected.
In particular, the relatively high ratio of theta waves compared to low beta waves is also associated with symptoms of Attention Deficit and Hyperactive Disorders (ADHD) or Attention Deficit Disorder (ADD) (Markovska-Simoska and Pop-Jordanova Citation2017). The beta (β) wave is a frequency band mainly occurring in awakening with active mental activity with open eyes (Simor et al. Citation2020). Low beta waves (13 Hz – 20 Hz) are generated during operational mental activities such as learning, memorizing, and calculating, so they are a criterion for judging attention and learning ability (Rosen et al. Citation2020). High beta waves (20 Hz – 30 Hz) appear predominantly under tension or stress. Gamma (γ) waves appear in high-level information processing or complex mental activity (Choi, Kim, and Chun Citation2015). In this study, based on this understanding of EEG, ‘Attention Level’ was defined as measuring the degree of attention and a relative ratio of EEG frequencies representing attention (Han and Chun Citation2021).
Sensory-motor rhythm wave (SMR) of 12–15 Hz, which is an intermediate process between the alpha wave band and the low beta wave band among brain waves, is a process of changing the consciousness from a resting state to an active state and is expressed when arousal and concentration are maintained in an appropriately stable condition (Kim and Choi Citation2017). In other words, it appears to concentrate and solve problems without tension or stress (Kang, Kim, and Baek Citation2021). Therefore, it has been widely used as a measurement scale reflecting attention in studies on alleviating symptoms of ADHD and ADD. In addition, the low beta wave of 13–20 Hz is mainly expressed during active mental activities such as learning, memorization, and calculation (Cabrerizo et al. Citation2012). Among them, 15–20 Hz, excluding the SMR wave region, is subdivided into medium beta waves.
In the current attention concentration study through EEG measurement, attention was analyzed by the ratio of the activity of the Theta (θ) wave of 4–8 Hz, indicating the state of drowsiness and the movement of the SMR wave of 12–15 Hz indicating the concentration of attention (Marlats et al. Citation2020). In many cases, attention was analyzed with the ratio of theta wave activity and the sum of the SMR wave indicating attention and the mid-beta action displaying the arousal state ((SMR+M.beta)/Theta) (Lim, Yeo, and Yoon Citation2019). This study uses ((SMR+M.beta)/Theta) to measure attention level.
The human brain can be broadly divided into four lobes: the frontal lobe, the temporal lobe, the parietal lobe, and the occipital lobe, according to their location and function (Papinutto et al. Citation2016). Among them, the frontal lobe, located in the front of the brain, functions as a part of thinking, cognition, and problem-solving (De Souza et al. Citation2014). The Dorsolateral Prefrontal Cortex (DPFC) plays a vital role in attention, working memory, and goal-directed behaviour (Oemisch et al. Citation2015). Therefore, the increase in the EEG frequency, which represents the concentration of attention in the prefrontal (Fp1, Fp2) and frontal (Fz) regions, indicates that the concentration of attention was good as the arousal of the frontal part, which is highly related to human thinking, cognition, and problem-solving. The parietal lobe has a somatosensory area and a primary motor area, so it plays a role in synthesizing sensory information from each body part and sending it to each part (Gu et al. Citation2022). The temporal lobe near the ruler has the auditory cortex, and the occipital lobe at the back of the brain has the visual cortex. In this respect, it can be said that other regions other than the frontal lobe are not directly related to attention (Xu et al. Citation2014).
2.2. Power spectrum and relative power analysis
EEG signals appear in a mixture of the delta, theta, alpha, beta, and gamma regions (Hillebrand et al. Citation2012). Therefore, each frequency component is decomposed and classified to analyze its size, which is ‘power spectrum analysis’ (Roy, Kumar, and Chang Citation2020). In this study, power spectrum analysis of EEG data was also performed to determine how much weight each frequency region occupies in the EEG. Each frequency obtained through the power spectrum was analyzed as a relative power representing the power ratio in which the frequency of the corresponding region appeared, as shown in Equation Equation1(1)
(1) (Duque-Muñoz, Espinosa-Oviedo, and Castellanos-Dominguez Citation2014; Ieracitano et al. Citation2019). In addition, the concentration of attention was analyzed as the ratio of theta wave, SMR wave, and mid-beta wave related to attention (Mutanen et al. Citation2018). As shown in Equation Equation2
(2)
(2) , it can be obtained as the ratio of the power of one domain to another.
(1)
(1)
: Brain Wave
,
,
,
(Hz)
= Alpha Wave (Hz)
= Theta Wave (Hz)
= Beta Wave (Hz)
=Gamma Wave (Hz)
(2)
(2) SMR: SMR (Sensory Motor Rhythm) Wave (Hz) M.
: Medium Beta Wave (Hz)
2.3. Experimental conditions
The experiment of this study was conducted in an artificial climate room with a size of 3.7 m × 4.0 m × 3.5 m (W×D×H) located at OOO. Table shows some specifications of the artificial climate room. The artificial climate room was meticulously designed to control various environmental parameters vital for the experiments. Additionally, as typical building components in UAE, the walls of the artificial climate room are finished with water-based paint. An off-white roll screen is also installed on the walls to refine the room's conditions further. The floor is finished with tiles, providing a consistent and neutral thermal response during our experiments. As previously mentioned, the room does not have windows. This was a deliberate choice to ensure a consistent environment devoid of external natural light and heat influences. The artificial climate room does not have windows, so its orientation does not influence the internal environment. This design choice was made to maintain a consistent environment free from the variability introduced by external factors like sunlight and heat. This deliberate design choice eliminated the thermal and lighting influences windows might introduce, allowing for a controlled experimental setup. Apart from the main entrance subjects use to enter and exit the room, there are no additional openings. This ensures minimal interference with the controlled conditions set for the experiments. The design of the artificial climate room was specifically chosen to provide a consistent and controllable environment for our experiments.
Table 3. Artificial Climate Room Specifications.
The environmental conditions of the anterior chamber and the artificial climate chamber are shown in Table .
Table 4. Experimental Conditions in the Anterior Chamber and Artificial Climatic Chamber.
Figure shows the floor plan of the artificial climate room, the subject's seating position (A), the monitor position for presenting visual stimulation (B), and the location of the EEG equipment (C) (Choi, Kim, and Chun Citation2015).
Figure 1. Artificial Climate Room.
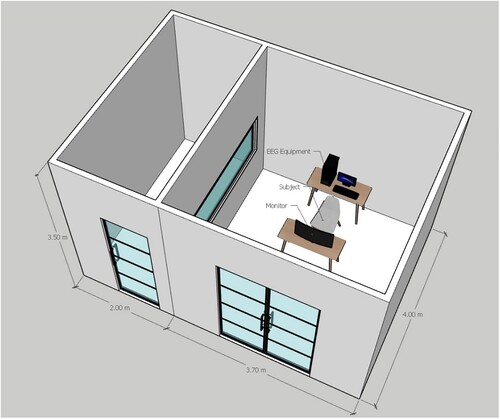
The Anterior Chamber was set as a neutral environment with a predicted sense of warmth – Predicted Mean Vote (PMV) of neutral (0) so that the occupants were in a comfortable temperature range that was neither cold nor hot as a waiting area to stabilize the subject's physical condition equally (Zander et al. Citation2017). When the subject moved to the artificial climate room, he was seated in an office chair, turned toward the monitor, and connected to the EEG equipment at the back of the subject with an electrode wire (Wang et al. Citation2019). During the experiment, the artificial climate room's relative humidity and airflow velocity were constant at 50% and 0.1 m/s, respectively (Valenzi et al. Citation2014). It can be inferred that the researchers likely predetermined the thermal environment and were not subject to adjustment by the participants during the study.
To check the difference in the attention of occupants according to the indoor temperature, the conditions were medium temperature (24.0 °C) and low temperature (20.5 °C) near the neutral region (Son and Chun Citation2018; Zhu, Liu, and Wargocki Citation2020). This temperature is the air temperature felt by a subject wearing a uniform of 0.71 clo (the thermal resistance value of the lab coat in this experiment) under the environmental conditions of the artificial climatic room, as shown in Table as a ‘neutral’ state with a shared sense of warmth (PMV) of 0. Phosphorus 24.0 °C was set as a medium temperature, and 20.5 °C, the air temperature that felt ‘slightly cool’ with an expected feeling of heat −1, was selected as the low temperature (Shan et al. Citation2018). Since the artificial climate room is installed in the building, has no windows, and the airflow velocity is less than 0.1 m/s, the average radiant temperature was calculated to be the same as the room temperature (Kim et al. Citation2020).
The selection of subjects to participate in the experiment was conducted with the approval of the OOO Research Ethics Committee, and 64 males aged 21–27 were chosen. Participants were required to provide recent and comprehensive health reports from a certified medical office, confirming their physical and mental well-being. These reports ensured that all participants were physically fit and had no history of neuropsychiatric disorders. Specifically, none had prior conditions like attention deficit disorder, brain trauma, epilepsy, or alcoholism, and their visual acuity (including corrected visual acuity) was within the normal range (Zhu, Liu, and Wargocki Citation2020). In addition, on the day of the experiment, the subject's health and fatigue status were checked. If it was judged that there was an abnormality compared to usual, it was excluded from the experiment to reduce the effect of the physical condition related to attention (Lv et al. Citation2017). To minimize the difference in a cognitive system according to education among subjects, the experiment was conducted only with those with an academic background of a college student or higher (Shan and Yang Citation2020). Subjects were prohibited from taking other drugs that could affect cognitive function, such as tobacco, caffeine, and alcohol, for 12 h before the experiment (Lan et al. Citation2014). The general characteristics of the subjects are shown in Table .
Table 5. General Characteristics of the Subject.
2.4. Biometric system
In this study, EEG was measured using 7 EEG channels of MP150 (Biopac System Inc., Santa Barbara, CA, USA), a biometric system, to understand the attention process of occupants (Choi, Kim, and Chun Citation2015). For the measurement, the unipolar induction method based on the experiment participant’s ear cheek (A1) was used, and the measurement site is shown in Figure .
Figure 2. International 10–20 Electrode Arrangement Method and Measuring Area.
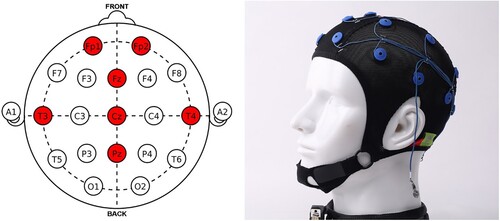
In Figure , Ag-AgCl EEG electrodes (model name: CAP100C) with Lycra caps are placed in the frontal, temporal, and parietal lobes, Fp1, Fp2, T3, T4, Fz, Cz, Pz, according to the International 10–20 Electrode Arrangement Method. EEG signals were stored in a computer through a 1,000 Hz sampling frequency and a pass filter of 0.1–35 Hz. Eye movement was measured by attaching an Ag/AgCl disposable surface electrode (Tyco Healthcare Group LP, Norwalk, CT, USA) (Khosla, Khandnor, and Chand Citation2020). The EOG 1 channel was used for EEG analysis to remove artifacts caused by eye movement. To conclude, the following are the study measurements:
EEG Equipment Used: MP150 (Biopac System Inc., Santa Barbara, CA, USA) is mentioned as the biometric system.
Type of Electrodes: Ag-AgCl EEG electrodes with Lycra caps.
Electrode Placement: Frontal, temporal, and parietal lobes, using the International 10–20 Electrode Arrangement Method.
Sampling Frequency and Filter: A 1,000 Hz sampling frequency with a pass filter of 0.1–35 Hz.
Eye Movement Measurement: Through Ag/AgCl disposable surface electrode, which helps to control for artifacts caused by eye movements.
2.5. Continuous performance test (CPT) for visual stimuli
In this study, a continuous performance test (Visual CPT) was conducted five times to see the concentration of visual stimuli, and EEG was measured (Kim et al. Citation2015). The constant performance test is a kind of vigilance task. It focuses on stimulants such as numbers, letters, and figures and selectively responds to rare target stimuli (Lasee and Choi Citation2013). In addition, the ‘Oddball paradigm’ is to familiarize the subject with the experimental situation in which they have been stimulated and then focus on distinguishing the frequent standard stimuli from the intermittent target stimuli. In this case, an 8:2 ratio is mainly used for the number of presentations of the standard and target stimuli (Rothlein et al. Citation2018). In this experiment, the stimulus was presented to the computer monitor in front of the subject through the SuperLab 4.0 (Cedrus, San Pedro, CA, USA) programme. The stimulus presentation followed the ‘Oddball paradigm’ (Karamacoska et al. Citation2019). Measurements and assessments were conducted at a 5-minute EEG baseline, 5-minute intervals for the Continuous Performance Test (CPT), and 10-minute intervals for the learning sessions.
A total of 150 stimuli were presented for 5 min, and the standard stimulus consisted of 120 times (p = 0.8) and the target stimulus 30 times (p = 0.2) (Díaz-Orueta et al. Citation2014). The subject sat comfortably in a chair, stared at the front of the monitor 60 cm away, and was instructed to press the space bar on the keyboard only when a target stimulus was presented. The presented stimulus is six figures consisting of a combination of square, equilateral triangle, and circle (Figure ). Among them, the target stimulus is a figure with an equilateral triangle; the first figure and the rest are presented as standard stimuli (Neguț, Jurma, and David Citation2017). The stimulus presentation protocol is shown in Figure .
Figure 3. Type of Stimulus.

Figure 4. Stimulus Presentation Protocol.
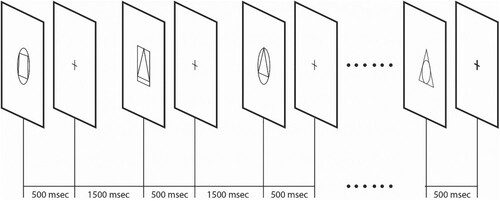
Each figure appeared randomly in the centre of the white screen of the computer monitor; the size was 60×60 mm, and the stimulus presentation time was 500 msec (Eom et al. Citation2019). In addition, a time interval of 1500 msec was set until the next stimulus was presented, and at this time, a ‘+’ shape with a size of 10 mm appeared in the centre of the screen to induce concentration (Nazari et al. Citation2011). In addition to EEG, performance result items such as the number of correct responses, omission errors, false alarm errors, and correct response time of the continuous performance test were saved and analyzed in a computer when the experiment was finished. Overall, participants’ structured 90-minute session comprised a 20-minute acclimatization, a 5-minute EEG baseline measurement, five iterations of a 5-minute Visual CPT with six stimuli, and four 10-minute studying sessions.
2.6. Thermal comfort survey and method
The thermal comfort survey was conducted to investigate the relationship between the change in attention over time. The warmth evaluation was performed using a continuous scale based on the ASHRAE (American Society of Heating, Refrigerating, and Air-Conditioning Engineers) scale, often called the ASHRAE 7-point psycho-physical scale for thermal sensation. (Table ) (Djamila Citation2017). Of the initial 64 participants who completed the thermal comfort survey, 58 provided valid and complete questionnaire data in the final analysis. Six questionnaires were excluded due to incomplete responses or discrepancies.
Table 6. Thermal Comfort Survey Scale.
After putting on the lab coat prepared for 20 min in the front room controlled at 24 °C, the subject waited and was acclimatized to the warm environment in the neutral (PMV = 0) state. This is to make the condition of the different subjects the same. EEG and eye movement electrodes were pre-attached while each subject waited in the anterior chamber. The subject entered the artificial climate room, sat comfortably in a chair, and rested. After connecting the electrodes to the equipment, the EEG was in the baseline state before the concentration activity was measured for 5 min (Min et al. Citation2011). After that, a visual continuous performance test (Visual CPT) was performed for visual stimulation for 5 min, and each prepared learning material was studied for 10 min (Karamacoska et al. Citation2019). The two performances were repeated, and five consecutive performance tests and four learning activities were performed. The EEG data of this study were analyzed after removing artifacts caused by eye movement (EOG) and filtering each. EEG analysis, continuous performance test results, and thermal comfort questionnaire were all statistically analyzed using IBM SPSS Statistics 27.0.1.0.
3. Results
3.1. EEG characteristics related to attention according to room temperature
In this study, to see the difference in EEG characteristics related to ‘Selective Attention’ according to room temperature, the average difference between the prefrontal and frontal lobes measured in the same sample was tested for each temperature through the paired-sample T-test.
As a result, it was found that the change in concentration according to temperature in the prefrontal cortex and frontal lobe was not statistically significant in the reference state measured within 5 min of entering the artificial climate room. It was determined that the elapsed time of exposure to the artificial climate room conditions after adapting to the same all-room situation of 24 °C was short, and the difference in concentration was not likely to be significant because there were no attention-related activities.
At the time of Visual CPT, the concentration of attention in the two regions of the frontal lobe, Fp1 and Fp2, and the frontal lobe, Fz, had a significant probability of 0.000, which was higher at low temperature (20.5 °C) than at medium temperature (24.0 °C). In learning performance, the significance probabilities of Fp1, Fp2, and Fz regions were 0.031, 0.002, and 0.001, indicating that the concentration of attention at low temperature was higher than at medium temperature. As a result of the paired sample T-test, the difference in attention intensity by temperature in the two runs is shown in Figures 6 and 7. The difference in attention intensity according to the room temperature of the frontal region (Fp1, Fp2, Fz) was found to have a significant difference in common between the two runs, as shown in Figures and . At 20.5 °C, the concentration of attention was 0.1100, 0.1695, and 0.1883 higher at Fp1, Fp2, and Fz, respectively, than at 24.0 °C. At the time of learning, it was statistically significant that the concentration of attention was higher in the Fp1, Fp2, and Fz regions, respectively, by 0.0594, 0.1142, and 0.1746.
Figure 5. Attention Level of the Frontal Head during Visual CPT.
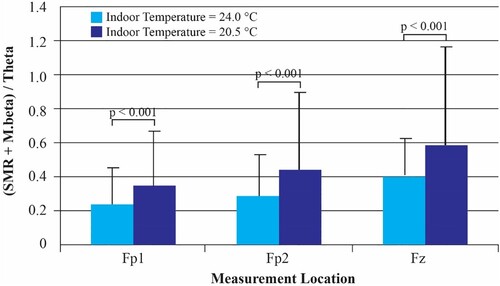
Figure 6. Attention Level of the Frontal Head During Learning Performance.
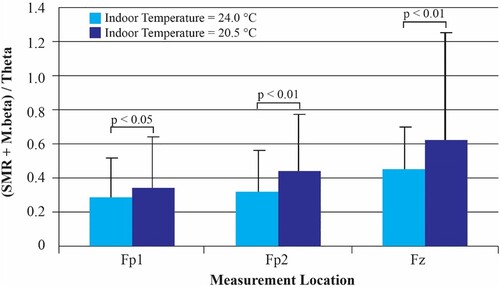
The fact that the concentration of attention in Visual CPT and learning performance was higher at low temperatures (20.5 °C) than at medium temperatures (24.0 °C) indicates that subjects properly activated their brains at low temperatures to selectively pay attention to stimulation or learning information of continuous performance tests means that it has been tilted. It suggests that a slightly cool environment is favourable for selective attention.
3.2. Comparison of relative power by frequency according to room temperature
To subdivide and analyze attention-related EEG, the relative power of each frequency band of the frontal Fp1, Fp2, and Fz, where the difference in attention concentration was significant, was compared through the paired-sample T-test for the continuous performance test and the learning performance (Tables and ).
Table 7. Comparison of EEG Relative Power according to Room Temperature during Visual CPT.
Table 8. Comparison of EEG Relative Power according to Room Temperature during Learning Performance.
The relative power of all EEG frequencies in the frontal part showed a significant difference according to the room temperature. Among all frequencies, the theta (θ) wave, which represents the sleep state of the brain, significantly decreased with significance probabilities of 0.000, 0.000, and 0.001 in all three measurement regions at low temperatures (20.5 °C) than at medium temperature (24.0 °C). On the other hand, alpha (α) waves, beta (β) waves, and gamma (γ) waves showed significant increases at low temperatures compared to moderate temperatures in most areas. The comparative results of relative power that theta wave decreased and alpha, beta, and gamma wave increased at low temperature (20.5 °C) showed that the brain activity of humans at low temperature (20.5 °C) compared to when the brain activity was at medium temperature (24.0 °C). It shows that the brain is more active. It also shows that the change in the ((SMR + M.beta) / Theta) value indicating the concentration is not due to a change in a specific frequency but is a result of the complex action of changes in alpha, low beta, and theta waves. The increase of alpha and low beta waves and the decrease of theta wave indicates that the high-frequency band of the brain rises at a low temperature so that the brain is adequately awakened and is in a favourable state to receive information selectively.
3.3. Time-dependent change of attention according to room temperature
This study analyzed the aspect of ‘Sustained attention’ by examining the time-dependent change process of attention at each room temperature. To compare the temporal changes in attention intensity for the frontal region (Fp1, Fp2, Fz), where the difference in attention intensity according to room temperature was significant, 5 Repeated measures of ANOVA were performed on the (SMR + M.Beta) /Theta value, which represents the concentration of attention during the meeting Visual CPT and the course of 4 learning sessions. Then, to analyze the difference in the process of concentration change in two-room temperature conditions of medium temperature (24.0 °C) and low temperature (20.0 °C), a paired t-test was performed on the concentration of attention by time at each temperature condition.
As a result, there was a section in which the change in concentration of attention was significant with time at both the medium temperature (24.0 °C) and the low temperature (20.5 °C). Figures and show a graph showing the characteristic difference based on the time when attention begins to rise or fall.
Figure 7. Attention Level for Each Session in the Frontal Head during the Visual CPT.
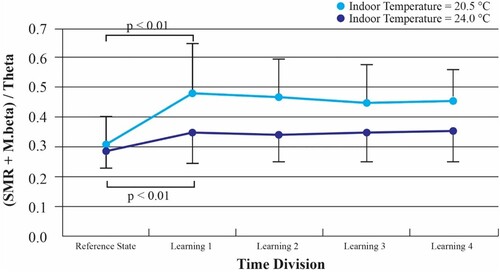
Figure 8. Attention Level for Each Session in the Frontal Head during Learning.
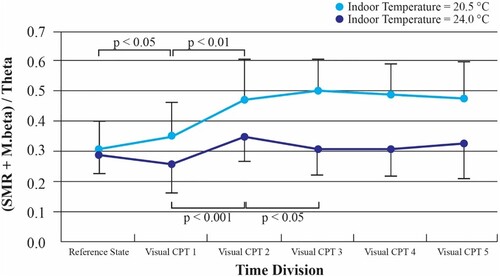
In the continuous performance test, which requires direct attention and discrimination of stimuli, the concentration of attention is improved in the interval of 5 to 25 min at a moderate temperature (24.0 °C). After dropping again in the 25–40-minute interval, it showed a specific pattern, and the change width was smaller than that at low temperature (20.5 °C). On the other hand, at low temperatures (20.5 °C), the concentration of attention continued to rise in the 0–25-minute period, and after that, it showed a specific pattern. The concentration of attention seems to occur more immediately in the indoor environment at low temperature (20.5 °C) than at medium temperature (24.0 °C), and it seems to reach and maintain the state of arousal more quickly. Therefore, a slightly cool low-temperature environment appears to be advantageous in terms of continuous attention in the attention activity in a similar period as in this study.
3.4. Visual CPT results
In the continuous performance test, the EEG characteristic shows the concentration of attention, which is the basis of performance, and shows the process aspect, while the result value of the continuous performance test is information on the outcome aspect of performance about how accurately and quickly the subject discriminated the presented stimuli. In particular, omission error that does not respond to the target stimulus is interpreted as an indicator of attention maintenance disorder in determining attention deficit disorder. Commission error in response to standard stimuli is also interpreted as an indicator of impulsivity.
This study conducted a paired t-test to compare the results of continuous performance tests at medium temperature (24.0 °C) and low temperature (20.5 °C). As a result, as shown in Table , the number of positive responses – that accurately discriminated stimuli – was more significant at medium temperature (24.0 °C). The number of omission errors was more effective at medium temperatures (24.0 °C), and the number of false alarm errors was more significant at low temperatures (20.5 °C). This was not found to be a statistically significant level. Also, the standard deviation of the forward response time and the forward response time between the 5 consecutive tests were shorter at low temperatures (20.5 °C), the response to the target stimulus was faster, and the deviation was slight. However, this difference was not significant.
Table 9. Comparison of Visual CPT Results according to Room Temperature.
Therefore, in this study, it was found that there was no difference in performance according to the two types of room temperature. First, it is expected that the difference between these results will not be significant because it is a task to discriminate relatively easy stimuli. Second, as a result of analyzing the concentration of attention by measuring the physiological signal of EEG, it is estimated that the cool temperature was advantageous for attention. Still, the performance result was due to the large intra-individual and inter-individual deviations due to various internal and external factors.
3.5. The relationship between thermal comfort and attention
Participants in our thermal comfort survey were required to complete the questionnaire after each session or change in thermal conditions. Each time, they spent approximately 5 to 10 min answering 15 questions. These questions addressed their perceived thermal comfort and sensation, thermal and humidity level preferences, perception of air movement, current clothing and activity levels, and the impact of temperature on concentration, overall well-being, and productivity. Participants also provided details about their environment before the current one, the duration spent in the current environment, their inclination towards natural versus artificial cooling, and their health status.
The subjects’ total of 10 real heat sensations during the experiment and the 10th heat sensation, the final feeling of warmth reported after the subjects were sufficiently exposed to a warm environment, were analyzed using repeated-measures ANOVA. As a result, there was no change in the actual heat sensation for each hour at the medium temperature (24.0 °C) but significantly changed during the continuous performance test at the low temperature (20.5 °C) (p<0.05).
Also, the actual comfort was significantly changed when learning was performed at a low temperature (20.5 °C) (p<0.05). This is thought to be because the number of cold spots among the hot and cold spots on human skin is much higher, and the rate of physiological change is faster when humans are exposed to low temperatures than when exposed to high temperatures. However, it is difficult to say that this change is related to the shift in attention concentration because the correlation coefficient between thermal comfort and attention concentration is low.
4. Discussion
Historically, in the nineteenth century, the UAE showcased a seasonal migration pattern, wherein locals transitioned from tents in the desert to the coast during the peak hot periods (U.A.E Citation2022). The oil boom, beginning in the 1950s, radically transformed the region, and with the introduction of air conditioning, the lifestyles of residents experienced a seismic shift. Between 1990 and 2016, the UAE witnessed a colossal surge in energy consumption for cooling, as denoted by World Bank figures, which expanded from 25 to 125 terawatt per hour (TWh). Today, 70% of the UAE’s electricity consumption is attributable to air conditioning (The Nationals Citation2020).
The UAE's unique economic and cultural context, where air-conditioning is freely available to nationals and even for expatriate residents, the A/C bill remains relatively low, has fostered an over-reliance on air conditioning. This over-dependence, particularly the trend of overcooling to temperatures as low as 18.0 °C, has spawned a plethora of health challenges. These range from common ailments like indoor air pollution, dehydration, and headaches to more severe respiratory conditions and allergies to asthma (The Nationals Citation2021).
Our study findings further elucidated this trend. We observed that students studying in a medium temperature environment of 24.0 °C exhibited a 15% improvement in attention metrics on the EEG compared to those studying in an overcooled environment of 20.5 °C. Furthermore, 68% of participants reported experiencing distraction or discomfort when exposed to the lower temperature during extended study sessions. Such findings underscore the implications of overcooling, especially in the current pandemic era, where students predominantly study from home.
Given these insights, we advocate for a more balanced approach to indoor temperature regulation. Overcooling, while initially seeming comfortable, can be counterproductive, affecting health and cognitive performance.
Limitations and Further Discussion:
Sample Demographics: Our sample consisted exclusively of male participants aged 21–27. This specific demographic might not represent the broader population, including females, younger students, or older adults.
External Influences: Despite efforts to maintain a consistent environment, individual variations like personal health status, daily fatigue, and even varying sensitivity to temperature could influence the results.
Duration of Exposure: Our experiment time was limited to 70 min. In real-world scenarios, individuals might be exposed to specific temperatures for extended periods, potentially leading to varied physiological and cognitive responses.
Limitation of Environmental Variables: While we controlled for many environmental parameters, other factors such as lighting, sound, and even the room's colour can influence cognitive performance and were not considered in this study.
Based on the conclusions derived from our study, we propose the following recommendations for future research endeavours:
Extended Study Duration: Expanding the study duration is essential for a more in-depth understanding, especially considering real-world scenarios where students might engage in longer study sessions.
Broader Temperature Range Exploration: Our study concentrated on the temperature range of −1<PMV<0, covering medium (24.0 °C) to low (20.5 °C) temperatures. A holistic understanding mandates exploring a more expansive temperature range to determine the optimal indoor temperature conducive to maintaining attention.
5. Conclusion
Through EEG analysis, this study sought to discern the variances in occupants’ attention in relation to room temperature and further scrutinize the temporal evolution of attention. Our primary findings and implications are:
Selective Attention and Thermal Environment: At a lower temperature of 20.5 °C, we observed an elevation in the EEG frequency denoting attention compared to the medium temperature of 24.0 °C. This increase is characterized by a rise in the high-frequency band, indicating heightened brain activity. Thus, contrary to general perception, a slightly cooler environment seems more conducive to focused attention than a conventionally comfortable one. Yet, it's crucial to note that this attention spike could also signify stress, emphasizing the need for an optimal balance between thermal comfort and attentiveness.
Continuous Attention Maintenance: Both temperature scenarios – medium (24.0 °C) and low (20.5 °C) – sustained attention after reaching a specific threshold. Interestingly, attention in a cooler environment appeared to be more immediate, reaching a state of optimal arousal faster than in the medium temperature setting. A slightly cooler environment for tasks stretching up to 70 min seems advantageous for rapid concentration attainment.
Performance Outcome: While there were observable differences in attention based on EEG, the resultant performance between the two temperature conditions didn't exhibit any statistically significant difference. Given that the tasks were relatively straightforward, the distinction might not be pronounced. Additionally, factors such as arousal, stress, and individual differences might have introduced variations in the outcomes.
Thermal Comfort vs. Attention: While subjects reported noticeable changes in thermal comfort at the lower temperature of 20.5 °C, these changes didn't directly correlate with attention concentration levels. This dissociation underscores the complex interplay between physiological comfort and cognitive function.
Practical Implications and Applications: This study has profound implications for spaces requiring sustained attention, such as educational institutions, offices, and research labs. By optimizing thermal conditions, such establishments can potentially boost productivity and information retention. Understanding the intricate relationship between temperature and cognitive performance becomes vital, especially in regions like the UAE, where air conditioning is ubiquitous. While a slightly cooler environment might be more conducive to focused tasks, care should be taken to ensure that it doesn't compromise overall comfort, which might lead to other health and well-being challenges.
Nomenclature
| EEG | = | Electroencephalography, a non-invasive medical test used to record the brain's electrical activity |
| DEWA | = | Dubai Electricity & Water Authority |
| FMRI | = | Functional Magnetic Resonance Imaging |
| ADHD | = | Attention Deficit and Hyperactive Disorders |
| ADD | = | Attention Deficit Disorder |
| SMR | = | Sensory-Motor Rhythm |
| DPFC | = | Dorsolateral Prefrontal Cortex |
| PMV | = | Predicted Mean Vote |
| CPT | = | Continuous Performance Test |
| ASHRAE | = | American Society of Heating, Refrigerating, and Air-Conditioning Engineers Scale |
Author contributions
All authors contributed significantly to this study. C.J. G.E. and G.E. identified and secured the example buildings used in the study. The data acquisition system and sensors were designed and installed by C.J. and G.E., responsible for data collection. C.J. performed data analysis. The manuscript was compiled by C.J. and G.E. and reviewed by G.E. All authors have read and agreed to the published version.
Institutional review board statement
The study was conducted according to the OOOOOO University Research Ethics Committee guidelines.
Informed consent statement
Informed consent was obtained from all subjects involved in the study.
Acknowledgments
The authors would like to thanks Ajman University and Prince Mohammad bin Fahd University for their generous support in publishing this paper.
Disclosure statement
No potential conflict of interest was reported by the author(s).
Data availability statement
New data were created or analyzed in this study. Data will be shared upon request and consideration of the authors.
References
- Al Horr, M., A. Arif, Kaushik, A. Mazroei, M. Katafygiotou, and E. Elsarrag. 2016. “Occupant Productivity and Office Indoor Environment Quality: A Review of the Literature.” Building and Environment 105: 369–389. https://doi.org/10.1016/j.buildenv.2016.06.001
- Arana-Llanes, J. Y., G. González-Serna, R. Pineda-Tapia, V. Olivares-Peregrino, J. J. Ricarte-Trives, and J. M. Latorre-Postigo. 2018. “EEG Lecture on Recommended Activities for the Induction of Attention and Concentration Mental States on E-learning Students.” Journal of Intelligent & Fuzzy Systems 34 (5): 3359–3371. https://doi.org/10.3233/JIFS-169517
- Arar, M., and C. Jung. 2021. “Improving the Indoor Air Quality in Nursery Buildings in United Arab Emirates.” International Journal of Environmental Research and Public Health 18 (22): 12091. https://doi.org/10.3390/ijerph182212091
- Awad, J., and C. Jung. 2021. “Evaluating the Indoor Air Quality after Renovation at the Greens in Dubai, United Arab Emirates.” Buildings 11 (8): 353. https://doi.org/10.3390/buildings11080353
- Bergomi, C., W. Tschacher, and Z. Kupper. 2013. “The Assessment of Mindfulness with Self-report Measures: Existing Scales and Open Issues.” Mindfulness 4 (3): 191–202. https://doi.org/10.1007/s12671-012-0110-9
- Biasiucci, A., B. Franceschiello, and M. M. Murray. 2019. “Electroencephalography.” Current Biology 29 (3): R80–R85. https://doi.org/10.1016/j.cub.2018.11.052
- Cabrerizo, M., M. Ayala, M. Goryawala, P. Jayakar, and M. Adjouadi. 2012. “A new Parametric Feature Descriptor for the Classification of Epileptic and Control EEG Records in Pediatric Population.” International Journal of Neural Systems 22 (02): 1250001. https://doi.org/10.1142/S0129065712500013
- Chen, C. M., J. Y. Wang, and C. M. Yu. 2017. “Assessing the Attention Levels of Students by Using a Novel Attention Aware System Based on Brainwave Signals.” British Journal of Educational Technology 48 (2): 348–369. https://doi.org/10.1111/bjet.12359
- Choi, Y., M. Kim, and C. Chun. 2015. “Measurement of Occupants’ Stress Based on Electroencephalograms (EEG) in Twelve Combined Environments.” Building and Environment 88: 65–72. https://doi.org/10.1016/j.buildenv.2014.10.003
- Choi, Y. A., S. Park, J. A. Jun, C. M. B. Ho, C. S. Pyo, H. Lee, and J. Yu. 2021. “Machine-learning-based Elderly Stroke Monitoring System Using Electroencephalography Vital Signals.” Applied Sciences 11 (4): 1761. https://doi.org/10.3390/app11041761
- De Souza, L. C., H. C. Guimarães, A. L. Teixeira, P. Caramelli, R. Levy, B. Dubois, and E. Volle. 2014. “Frontal Lobe Neurology and the Creative Mind.” Frontiers in Psychology 5: 761. https://doi.org/10.3389/fpsyg.2014.00761
- Díaz-Orueta, U., C. García-López, N. Crespo-Eguílaz, R. Sánchez-Carpintero, G. Climent, and J. Narbona. 2014. “AULA Virtual Reality Test as an Attention Measure: Convergent Validity with Conners’ Continuous Performance Test.” Child Neuropsychology 20 (3): 328–342. https://doi.org/10.1080/09297049.2013.792332
- Dichev, C., and D. Dicheva. 2017. “Gamifying Education: What is Known, What is Believed and What Remains Uncertain: A Critical Review.” International Journal of Educational Technology in Higher Education 14 (1): 1–36. https://doi.org/10.1186/s41239-017-0042-5
- Djamila, H. 2017. “Indoor Thermal Comfort Predictions: Selected Issues and Trends.” Renewable and Sustainable Energy Reviews 74: 569–580. https://doi.org/10.1016/j.rser.2017.02.076
- Duque-Muñoz, L., J. J. Espinosa-Oviedo, and C. G. Castellanos-Dominguez. 2014. “Identification and Monitoring of Brain Activity Based on Stochastic Relevance Analysis of Short–Time EEG Rhythms.” Biomedical Engineering Online 13 (1): 1–20. https://doi.org/10.1186/1475-925X-13-123
- Eom, H., K. Kim, S. Lee, Y. J. Hong, J. Heo, J. J. Kim, and E. Kim. 2019. “Development of Virtual Reality Continuous Performance Test Utilizing Social Cues for Children and Adolescents with Attention-Deficit/Hyperactivity Disorder.” Cyberpsychology, Behavior, and Social Networking 22 (3): 198–204. https://doi.org/10.1089/cyber.2018.0377
- Frontczak, M., and P. Wargocki. 2011. “Literature Survey on how Different Factors Influence Human Comfort in Indoor Environments.” Building and Environment 46 (4): 922–937. https://doi.org/10.1016/j.buildenv.2010.10.021
- Gray, S. A., P. Chaban, R. Martinussen, R. Goldberg, H. Gotlieb, R. Kronitz, M. Hockenberry, and R. Tannock. 2012. “Effects of a Computerized Working Memory Training Program on Working Memory, Attention, and Academics in Adolescents with Severe LD and Comorbid ADHD: A Randomized Controlled Trial.” Journal of Child Psychology and Psychiatry 53 (12): 1277–1284. https://doi.org/10.1111/j.1469-7610.2012.02592.x
- Gu, F., A. Gong, Y. Qu, A. Bao, J. Wu, C. Jiang, and Y. Fu. 2022. “From Expert to Elite?—Research on Top Archer’s EEG Network Topology.” Frontiers in Human Neuroscience 16.
- Han, J., and C. Chun. 2021. “Differences Between EEG During Thermal Discomfort and Thermal Displeasure.” Building and Environment 204: 108220. https://doi.org/10.1016/j.buildenv.2021.108220
- Hillebrand, A., G. R. Barnes, J. L. Bosboom, H. W. Berendse, and C. J. Stam. 2012. “Frequency-dependent Functional Connectivity Within Resting-State Networks: An Atlas-Based MEG Beamformer Solution.” NeuroImage 59 (4): 3909–3921. https://doi.org/10.1016/j.neuroimage.2011.11.005
- Ieracitano, C., N. Mammone, A. Bramanti, A. Hussain, and F. C. Morabito. 2019. “A Convolutional Neural Network Approach for Classification of Dementia Stages Based on 2D-Spectral Representation of EEG Recordings.” Neurocomputing 323: 96–107. https://doi.org/10.1016/j.neucom.2018.09.071
- Jung, C., N. Al Qassimi, M. Arar, and J. Awad. 2021. “The Analysis of Indoor Air Pollutants from Finishing Material of New Apartments at Business Bay, Dubai.” Frontiers in Built Environments 7: 765689. https://doi.org/10.3389/fbuil.2021.765689
- Jung, C., and J. Awad. 2021. “The Improvement of Indoor Air Quality in Residential Buildings in Dubai, UAE.” Buildings 11 (6): 250. https://doi.org/10.3390/buildings11060250
- Jung, C., and N. Al Qassimi. 2022. “Investigating the Emission of Hazardous Chemical Substances from Mashrabiya Used for Indoor Air Quality in Hot Desert Climate.” Sustainability 14 (5): 2842. https://doi.org/10.3390/su14052842
- Kadri, A., M. Slimani, N. L. Bragazzi, D. Tod, and F. Azaiez. 2019. “Effect of Taekwondo Practice on Cognitive Function in Adolescents with Attention Deficit Hyperactivity Disorder.” International Journal of Environmental Research and Public Health 16 (2): 204. https://doi.org/10.3390/ijerph16020204
- Kang, S. J., H. S. Kim, and K. H. Baek. 2021. “Effects of Nature-Based Group Art Therapy Programs on Stress, Self-Esteem and Changes in Electroencephalogram (EEG) in Non-Disabled Siblings of Children with Disabilities.” International Journal of Environmental Research and Public Health 18 (11): 5912. https://doi.org/10.3390/ijerph18115912
- Kapoor, N. R., A. Kumar, T. Alam, A. Kumar, K. S. Kulkarni, and P. Blecich. 2021. “A Review on Indoor Environment Quality of Indian School Classrooms.” Sustainability 13 (21): 11855. https://doi.org/10.3390/su132111855
- Karamacoska, D., R. J. Barry, F. M. De Blasio, and G. Z. Steiner. 2019. “EEG-ERP Dynamics in a Visual Continuous Performance Test.” International Journal of Psychophysiology 146: 249–260. https://doi.org/10.1016/j.ijpsycho.2019.08.013
- Khosla, A., P. Khandnor, and T. Chand. 2020. “A Comparative Analysis of Signal Processing and Classification Methods for Different Applications Based on EEG Signals.” Biocybernetics and Biomedical Engineering 40 (2): 649–690. https://doi.org/10.1016/j.bbe.2020.02.002
- Kim, K. J., and D. H. Choi. 2017. “Relative SMR Wave Power Spectra Analysis of Visual Arts Majors and Non-majors.” International Journal of Applied Engineering Research 12 (9): 2022–2026.
- Kim, H., T. Hong, J. Kim, and S. Yeom. 2020. “A Psychophysiological Effect of Indoor Thermal Condition on College Students’ Learning Performance through EEG Measurement.” Building and Environment 184: 107223. https://doi.org/10.1016/j.buildenv.2020.107223
- Kim, J., Y. Lee, D. Han, K. Min, D. Kim, and C. Lee. 2015. “The Utility of Quantitative Electroencephalography and Integrated Visual and Auditory Continuous Performance Test as Auxiliary Tools for the Attention Deficit Hyperactivity Disorder Diagnosis.” Clinical Neurophysiology 126 (3): 532–540. https://doi.org/10.1016/j.clinph.2014.06.034
- Lan, L., L. Pan, Z. Lian, H. Huang, and Y. Lin. 2014. “Experimental Study on Thermal Comfort of Sleeping People at Different Air Temperatures.” Building and Environment 73: 24–31. https://doi.org/10.1016/j.buildenv.2013.11.024
- Lasee, M. J., and H. S. Choi. 2013. “Evidence of Reliability and Validity for a Children’s Auditory Continuous Performance Test.” Sage Open 3 (4): 2158244013511828. https://doi.org/10.1177/2158244013511828
- Lim, S., M. Yeo, and G. Yoon. 2019. “Comparison between Concentration and Immersion based on EEG Analysis.” Sensors 19 (7): 1669. https://doi.org/10.3390/s19071669
- Lv, B., C. Su, L. Yang, and T. Wu. 2017. “Effects of Stimulus Mode and Ambient Temperature on Cerebral Responses to Local Thermal Stimulation: An EEG Study.” International Journal of Psychophysiology 113: 17–22. https://doi.org/10.1016/j.ijpsycho.2017.01.003
- Markovska-Simoska, S., and N. Pop-Jordanova. 2017. “Quantitative EEG in Children and Adults with Attention Deficit Hyperactivity Disorder: Comparison of Absolute and Relative Power Spectra and Theta/Beta Ratio.” Clinical EEG and Neuroscience 48 (1): 20–32. https://doi.org/10.1177/1550059416643824
- Marlats, F., G. Bao, S. Chevallier, M. Boubaya, L. Djabelkhir-Jemmi, Y. H. Wu, et al. 2020. “SMR/Theta Neurofeedback Training Improves Cognitive Performance and EEG Activity in Elderly with Mild Cognitive Impairment: A Pilot Study.” Frontiers in Aging Neuroscience 12: 147. https://doi.org/10.3389/fnagi.2020.00147
- Min, B. K., A. Bystritsky, K. I. Jung, K. Fischer, Y. Zhang, L. S. Maeng, H. Lenoir, A. S. Rigaud, and E. Azabou. 2011. “Focused Ultrasound-Mediated Suppression of Chemically-Induced Acute Epileptic EEG Activity.” BMC Neuroscience 12 (1): 1–12. https://doi.org/10.1186/1471-2202-12-1
- Mutanen, T. P., J. Metsomaa, S. Liljander, and R. J. Ilmoniemi. 2018. “Automatic and Robust Noise Suppression in EEG and MEG: The SOUND Algorithm.” Neuroimage 166: 135–151. https://doi.org/10.1016/j.neuroimage.2017.10.021
- The Nationals. 2020. “Working from Home could Create Surge in Gulf's AC Bills and Emissions.” https://www.thenationalnews.com/uae/environment/working-from-home-could-create-surge-in-gulf-s-ac-bills-and-emissions-1.1077001.
- The Nationals. 2021. “UAE Residents Warned of Risk to Health from Dirty Air Conditioning Units.” https://www.thenationalnews.com/uae/health/uae-residents-warned-of-risk-to-health-from-dirty-air-conditioning-units-1.1235821.
- Nazari, M. A., F. Wallois, A. Aarabi, and P. Berquin. 2011. “Dynamic Changes in Quantitative Electroencephalogram during Continuous Performance Test in Children with Attention-Deficit/Hyperactivity Disorder.” International Journal of Psychophysiology 81 (3): 230–236. https://doi.org/10.1016/j.ijpsycho.2011.06.016
- Neguț, A., A. M. Jurma, and D. David. 2017. “Virtual-reality-based Attention Assessment of ADHD: ClinicaVR: Classroom-CPT Versus a Traditional Continuous Performance Test.” Child Neuropsychology 23 (6): 692–712. https://doi.org/10.1080/09297049.2016.1186617
- Nguyen, P., T. A. Nguyen, and Y. Zeng. 2018. “Empirical Approaches to Quantifying Effort, Fatigue and Concentration in the Conceptual Design Process.” Research in Engineering Design 29 (3): 393–409. https://doi.org/10.1007/s00163-017-0273-4
- Oemisch, M., S. Westendorff, S. Everling, and T. Womelsdorf. 2015. “Interareal Spike-Train Correlations of Anterior Cingulate and Dorsal Prefrontal Cortex During Attention Shifts.” Journal of Neuroscience 35 (38): 13076–13089. https://doi.org/10.1523/JNEUROSCI.1262-15.2015
- Papinutto, N., S. Galantucci, M. L. Mandelli, B. Gesierich, J. Jovicich, E. Caverzasi, R. G. Henry, et al. 2016. “Structural Connectivity of the Human Anterior Temporal Lobe: A Diffusion Magnetic Resonance Imaging Study.” Human Brain Mapping 37 (6): 2210–2222. https://doi.org/10.1002/hbm.23167
- Paszkiel, S., R. Rojek, N. Lei, and M. A. Castro. 2021. “A Pilot Study of Game Design in the Unity Environment as an Example of the Use of Neurogaming on the Basis of Brain–Computer Interface Technology to Improve Concentration.” NeuroSci 2 (2): 109–119. https://doi.org/10.3390/neurosci2020007
- Petersen, S. E., and M. I. Posner. 2012. “The Attention System of the Human Brain: 20 Years After.” Annual Review of Neuroscience 35 (1): 73. https://doi.org/10.1146/annurev-neuro-062111-150525
- Rosen, D. S., Y. Oh, B. Erickson, F. Z. Zhang, Y. E. Kim, and J. Kounios. 2020. “Dual-process Contributions to Creativity in Jazz Improvisations: An SPM-EEG Study.” NeuroImage 213: 116632. https://doi.org/10.1016/j.neuroimage.2020.116632
- Rothlein, D., J. DeGutis, L. Germine, J. Wilmer, R. McGlinchey, and M. Esterman. 2018. “Sensitivity to Stimulus Similarity is Associated with Greater Sustained Attention Ability.” Attention, Perception, & Psychophysics 80 (6): 1390–1408. https://doi.org/10.3758/s13414-018-1504-0
- Roy, P. P., P. Kumar, and V. Chang. 2020. “A Hybrid Classifier Combination for Home Automation Using EEG Signals.” Neural Computing and Applications 32 (20): 16135–16147. https://doi.org/10.1007/s00521-020-04804-y
- Salamone, F., B. Barozzi, A. Bellazzi, L. Belussi, L. Danza, A. Devitofrancesco, M. Ghellere, I. Meroni, F. Scamoni, and C. Scrosati. 2021. “Working from Home in Italy During COVID-19 Lockdown: A Survey to Assess the Indoor Environmental Quality and Productivity.” Buildings 11 (12): 660. https://doi.org/10.3390/buildings11120660
- Sawai, S., S. Fujikawa, S. Murata, T. Abiko, and H. Nakano. 2022. “Dominance of Attention Focus and Its Electroencephalogram Activity in Standing Postural Control in Healthy Young Adults.” Brain Sciences 12 (5): 538. https://doi.org/10.3390/brainsci12050538
- Shan, X., and E. H. Yang. 2020. “Supervised Machine Learning of Thermal Comfort Under Different Indoor Temperatures Using EEG Measurements.” Energy and Buildings 225: 110305. https://doi.org/10.1016/j.enbuild.2020.110305
- Shan, X., E. H. Yang, J. Zhou, and V. W. C. Chang. 2018. “Human-building Interaction Under Various Indoor Temperatures Through Neural-Signal Electroencephalogram (EEG) Methods.” Building and Environment 129: 46–53. https://doi.org/10.1016/j.buildenv.2017.12.004
- Simor, P., G. van der Wijk, L. Nobili, and P. Peigneux. 2020. “The Microstructure of REM Sleep: Why Phasic and Tonic?.” Sleep Medicine Reviews 52: 101305. https://doi.org/10.1016/j.smrv.2020.101305
- Son, Y. J., and C. Chun. 2018. “Research on Electroencephalogram to Measure Thermal Pleasure in Thermal Alliesthesia in Temperature Step-Change Environment.” Indoor Air 28 (6): 916–923. https://doi.org/10.1111/ina.12491
- Sun, J. C. Y. 2014. “Influence of Polling Technologies on Student Engagement: An Analysis of Student Motivation, Academic Performance, and Brainwave Data.” Computers & Education 72: 80–89. https://doi.org/10.1016/j.compedu.2013.10.010
- Tamasiga, P., M. Molala, M. Bakwena, H. Nkoutchou, and H. Onyeaka. 2022. “Is Africa Left behind in the Global Climate Finance Architecture: Redefining Climate Vulnerability and Revamping the Climate Finance Landscape – A Comprehensive Review.” Sustainability 15 (17): 13036. https://doi.org/10.3390/su151713036.
- U.A.E. 2022. “The UAE's Response to Climate Change.” https://u.ae/en/information-and-services/environment-and-energy/climate-change/theuaesresponsetoclimatechange.
- Valenzi, S., T. Islam, P. Jurica, and A. Cichocki. 2014. “Individual Classification of Emotions Using EEG.” Journal of Biomedical Science and Engineering.
- Wang, X., D. Li, C. C. Menassa, and V. R. Kamat. 2019. “Investigating the Effect of Indoor Thermal Environment on Occupants’ Mental Workload and Task Performance Using Electroencephalogram.” Building and Environment 158: 120–132. https://doi.org/10.1016/j.buildenv.2019.05.012
- Xu, J., X. Sun, X. Zhou, J. Zhang, and L. Yu. 2014. “The Cortical Distribution of Multisensory Neurons was Modulated by Multisensory Experience.” Neuroscience 272: 1–9. https://doi.org/10.1016/j.neuroscience.2014.04.068
- Xu, J., and B. Zhong. 2018. “Review on Portable EEG Technology in Educational Research.” Computers in Human Behavior 81: 340–349. https://doi.org/10.1016/j.chb.2017.12.037
- Yao, Z. F., and S. Hsieh. 2019. “Neurocognitive Mechanism of Human Resilience: A Conceptual Framework and Empirical Review.” International Journal of Environmental Research and Public Health 16 (24): 5123. https://doi.org/10.3390/ijerph16245123
- Zander, T. O., L. M. Andreessen, A. Berg, M. Bleuel, J. Pawlitzki, L. Zawallich, L. R. Krol, and K. Gramann. 2017. “Evaluation of a dry EEG System for Application of Passive Brain-Computer Interfaces in Autonomous Driving.” Frontiers in Human Neuroscience 11: 78. https://doi.org/10.3389/fnhum.2017.00078
- Zhu, M., W. Liu, and P. Wargocki. 2020. “Changes in EEG Signals During the Cognitive Activity at Varying air Temperature and Relative Humidity.” Journal of Exposure Science & Environmental Epidemiology 30 (2): 285–298. https://doi.org/10.1038/s41370-019-0154-1