
ABSTRACT
Recent advances and commercialisation of unmanned aerial vehicle/red blue green (RGB) camera systems and digital photogrammetric techniques now provide a cheap and flexible alternative to higher-cost airborne platforms for routine monitoring of canopy health in timber plantations. Structure-from-Motion photogrammetry produces very dense three-dimensional (3D) point clouds which can be used to derive metrics for inventory estimation. Unmanned aerial vehicle RGB photography also captures data that can relate to tree health. In contrast to the more common use of orthorectified RGB photography to extract this spectral information, we used the software package Agisoft Photoscan to assign a simple Vegetation Index value directly to each point in the 3D point cloud. Using data acquired by a DJI Phantom 4 Pro, we present a simple processing and photogrammetric workflow solution for detecting dead and dying trees in a young Eucalyptus pellita plantation located in the provenance of Riau, Sumatra. Trees affected by the bacterial wilt Ralstonia sp. present symptoms of necrotic foliage on individual branches or the whole crown. Assigning the Visible Atmospheric Resistant Index Vegetation Index colour-coded values to individual points in the 3D point cloud significantly enhanced visualisation of necrotic foliage on individual trees in both the point cloud and the associated orthophoto compared to the RGB equivalent images. This approach could easily be operationally deployed for the rapid detection and mapping of unhealthy trees with symptoms of necrotic foliage.
Introduction
The capacity of digital aerial photography (DAP) and Structure-from-Motion (SfM) photogrammetric methods to deliver dense three-dimensional (3D) point clouds that describe the structure of forest canopies has been widely demonstrated in recent years (Bohlin et al. Citation2012; Wallace et al. Citation2016; Puliti et al. Citation2017; Alonzo et al. Citation2018; Iqbal et al. Citation2018b; Jayathunga et al. Citation2018; Navarro et al. Citation2018; Tompalski et al. Citation2018). In particular, a substantial research effort has been directed at assessing the capability of photogrammetric methods to generate canopy and tree-level metrics that support estimation of forest inventory (Nurminen et al. Citation2013; White et al. Citation2015; Bonnet et al. Citation2017; Goodbody et al. Citation2017; Ota et al. Citation2017; Alonzo et al. Citation2018; Caccamo et al. Citation2018; Guerra-Hernández et al. Citation2018; Navarro et al. Citation2018; Iqbal et al. Citation2019). These studies have demonstrated that DAP and photogrammetric methods are a practical alternative to airborne laser scanning (ALS) for the purposes of forest inventory when there are sufficient operational and financial benefits (Kangas et al. Citation2018).
Affordable photogrammetry software packages incorporating SfM algorithms (often also referred to as Structure-from-Motion Multi-View-Stereopsis algorithms) use images that are acquired with high forward and side-overlap from a range of different viewpoints to generate a very dense 3D point cloud. Differences between DAP and ALS-derived point clouds are described in detail by Iqbal et al. (Citation2018b). Photogrammetric methods generally cannot deliver the depth of penetration into the canopy or through the canopy to terrain that is afforded by ALS (White et al. Citation2013; Stone et al. Citation2016; Iqbal et al. Citation2018b) but offer other important operational advantages. These include the flexibility to acquire aerial imagery using any of a wide variety of digital cameras, or any of a wide variety of unmanned aerial vehicles (UAV) or manned aircraft platforms, and not are dependent on more expensive and less available UAV or manned aircraft ALS platforms and sensors. In turn, this leads to more flexible timing of deployment (improved temporal resolution for data acquisition) and lower deployment costs when compared with ALS. Photogrammetric methods also offer very high spatial resolution, high spatial accuracy and—significantly in the case of monitoring tree health—point cloud data that includes spectral information.
Remotely sensed multispectral and, more recently, hyperspectral imagery have been widely employed to monitor forest canopy health. The detection and mapping of damage extent and severity caused by damaging agents and processes is required for targeted intervention as well as for more strategic aims of predicting stand susceptibility or evaluating the performance of management strategies (Stone & Mohammed Citation2017). Satellite imagery has commonly been used for this application, providing wide area coverage (e.g. Meddens et al. Citation2014) but with significant limitations in terms of spatial resolution, spatial accuracy and lack of 3D structural information.
Multi- and hyperspectral sensors mounted on manned aircraft or UAV platforms, however, are becoming more available and providing spatial (ground sampling) resolutions that approach conventional digital cameras (e.g. Pietrzykowski et al. Citation2007; Pu et al. Citation2008; Dash et al. Citation2017; Näsi et al. Citation2018). At present, these sensors are much more expensive than consumer or professional-grade red green blue (known as RGB) cameras and hence create higher financial risk if they are mounted onto UAV platforms. Alternatives to the expensive pushbroom hyperspectral sensors are being developed, such as sensors based on the Fabry-Férot interferometer technique (Näsi et al. Citation2018).
The capacity of these spectral sensors to detect a range of different types of foliar damage is significantly influenced by both the spatial and spectral resolution of the sensor (Stone & Mohammed et al. Citation2017). With hyperspectral data (bandwidth <10 nm), there is an opportunity to discern subtle changes in foliar pigment composition (e.g. leaf chlorosis or non-green discolouration) or symptoms of water stress or nutrient deficiencies (e.g. Camino et al. Citation2018; Gerhards et al. Citation2018). Although metrics derived from hyperspectral data are sensitive to physiological stress, they are also highly affected by illumination conditions, viewing geometry and canopy structure (Hermández-Clemente et al. Citation2011; Näsi et al. Citation2015). Spectral metrics derived from broadband multispectral imagery are more robust and transferrable but much less sensitive to the specific type or severity of foliar symptoms.
Dash et al. (Citation2017) used a UAV equipped with a multispectral (B, G, R, RE & Near Infra Red (NIR)) sensor to monitor changes in pine crown colour after herbicide application. They extracted raster-based reflectance values after conversion from the raw digital numbers (DN) using calibrated reflectance panels. They then extracted and modelled four spectral indices that were known to be related to plant stress and created non-parametric models that could predict the onset of needle discolouration with reasonable accuracy (kappa range 0.39–0.64). Goodbody et al. (Citation2018) used DAP to extract structural metrics from point cloud data and spectral metrics from multi-band orthophotography. They showed that while structural metrics were effective for landscape-level estimations of stand forest inventory attributes for a mixed species forest in Ontario, Canada, the spectral metrics derived from multi-band orthophotography were more suited to modelling cumulative spruce budworm defoliation. Alonzo et al. (Citation2018) also extracted both structural and spectral metrics from a raster-based Canopy Height Model (CHM) and RGB orthophotography, respectively, derived from SfM data acquired by a UAV for estimating stand structure and species composition.
Numerous reviews have been published that evaluate the effectiveness of a large suite of vegetation indices (VIs) using multispectral and hyperspectral imagery for a range of assessment objectives (e.g. Xue & Su Citation2017). To date, the majority of VIs incorporate information from both the visible and NIR spectra (Xue & Su Citation2017). There are fewer VIs derived from just the visible spectra using RGB wavebands (e.g. Richardson et al. Citation2007; Hunt et al. Citation2011; Sakamoto et al. Citation2012b; Bendig et al. Citation2015; Jannoura et al. Citation2015).
The operational advantages of using consumer-grade UAV/RGB camera systems need to be countered with some inherent disadvantages when compared to more expensive multispectral and hyperspectral platforms. With consumer-grade digital cameras there is significant overlap of the R, G and B wavelength values recorded in the output image and there is a non-linear relationship between the intensity of the incident light and the DN associated with each pixel or point datum. A useful discussion of these and other factors affecting RGB imagery is provided by Lebourgeois et al. (Citation2008). However, despite these limitations RGB VIs have been successfully applied to monitor vegetation phenology and condition (e.g. Adamsen et al. Citation1999; Richardson et al. Citation2007; Hunt et al. Citation2013; Inoue et al. Citation2015; Anderson et al. Citation2016; Possoch et al. Citation2016). Farmers now routinely survey crops using UAV/RGB camera systems and apply VIs presented in these studies to a derived raster-based orthophoto and the pixels are classified on a pixel-by-pixel basis.
Much fewer investigations using indices derived directly from colour information encoded into photogrammetrically derived dense point clouds can be found in the literature. Dandois et al. (Citation2017) evaluated the quality of RGB data in photogrammetric dense point clouds captured for a single tree and for forest patches. They found that when target features were fully visible in images the colour assigned to 3D points was highly reliable, but the reliability of assigned colour declined when target features were partially obscured or in shadow.
This paper presents a preliminary study on the application of 3D RGB point cloud data for crown health surveillance in young tree plantations. We present an acquisition and photogrammetric workflow solution based on the use of a low-cost UAV, an affordable consumer camera and extraction of 3D RGB point clouds using popular photogrammetric software. We propose that this solution can be operationally deployed for the accurate detection and mapping of dead or dying trees within a young eucalypt plantation.
Materials and methods
Study area and tree damage symptoms
The study area was in a plantation of Eucalyptus pellita F.Muell. managed by PT. Indah Kiat Pulp & Paper company and located approximately 30 km north-east from Pekanbaru City, Riau Province, central Sumatra. It consisted of a 3-ha stand planted in July 2017 at a spacing of 2 × 3 m. Tree crowns along the rows were often touching, however, the ground was visible between the tree rows for most of the stand.
The most common symptom in this stand of young E. pellita trees was a bacterial wilt caused by the pathogen Ralstonia sp. This disease is soil borne and enters its host via the root system. A bacterial ‘slime’ results that fills the xylem vessels, causing leaves to become dry and necrotic. These symptoms can occur on individual branches or clusters of branches before killing the entire crown. Some leaf drop can occur but dead leaves are usually retained until the whole plant wilts (Keane et al. Citation2000). These distinct damage symptoms presented in a young plantation were ideal for demonstrating the potential of RGB SfM point cloud data acquired with a multi-rotor UAV for the rapid detection of necrotic foliage on individual trees.
Ground-truthing was not undertaken in this preliminary study. Ground-based visual assessments of damage symptoms on individual trees are of course desirable and if available present the opportunity of being used as reference data for automated classification of tree crown health (Stone & Mohammed Citation2017). However, the visual assessment of high spatial resolution DAP in forest health surveys has been applied operationally, although precision does rely on the expertise of the interpreter (Wulder et al. Citation2012). The approach taken in this study was the visual assessment of crown damage by a forest health expert in both the RGB and Visible Atmospheric Resistant Index (VARI)-derived orthophotos, with discrepancies examined in more detail through closer examination of the VARI-assigned point cloud.
Ground control points
Ground control points (GCPs) are not essential but are recommended when high spatial accuracy is required from photogrammetry and should be well-distributed throughout the area of interest and having a clear sky view (Osborn et al. Citation2017). The survey control consisted of existing features such as road markings as well as temporary ground control targets made of laminated paper with a black and white checker board pattern with a cell size of 12.5 cm. For repeat aerial surveys it is recommended that permanent GCPs be established. The GCPs were surveyed using a CHC Navigation x900 S-OPUS dual frequency Global Navigation Satellite System (GNSS) receiver which was set up as a base station and a single frequency GNSS receiver used as the rover. The base station was located close to the site and collected data for the duration of the survey. Ground control point observations were made with the rover mounted on a levelled, 2-m pole for a minimum of 10 minutes at each GCP. Locations were recorded in a Universal Transverse Mercator (UTM) projection of the WGS84 datum. A total of 15 GCPs were surveyed.
For GNSS post-processing the base control point data was exported to a Rinex format and then submitted to the Canadian (Natural Resources Canada) Precise Point Positioning website https://webapp.geod.nrcan.gc.can/geod/tools-outils/ppp.php. The rover data was exported to a Rinex format and processed against the post-processed base station location using the Ashtech GNSS Solutions (free) software.
Only one GCP was not well-resolved having relatively large uncertainty in the X, Y (0.114) and Z (0.079) coordinates and hence was not used as a control point for the photography. The uncertainty of this point may have resulted from a poor receiver sky view or because the pole was unstable during data collection.
Unmanned aerial vehicle imagery acquisition
Flying conditions were favourable with generally even lighting and very light winds. The imagery was acquired with a DJI Phantom 4 Pro. The flying height was around 30 m above ground level giving a ground sample distance (GSD) at the ground of approximately 0.8 cm. The flight lines were aligned parallel to the tree rows to maximise the capacity to match and extract ground features between the tree rows. Photo acquisition parameters were set to 95% forward-overlap and 95% side-overlap. The camera settings were set manually to capture JPEG images at an equal distance with an image ratio of 3:2, ISO 100, F-stop 4.5, shutter at 1/200 second and white balance set to cloudy.
The flightpaths were generated using DJI Ground Station Pro, which automatically determines the optimal efficient speed of flight based on keeping the motion blur at less than half a pixel. This motion blur is a critical factor in determining the ability of the sensor to clearly resolve the upper part of the tree crowns, and to maintain sharp, in-focus images throughout the survey. Motion blur can also be introduced into the photography through the movement of trees due to wind.
The high 95%/95% forward and side-overlap helped to ensure a high-quality representation of the canopy and tree structure and a well-defined ground surface. While the high side-overlap increases overall flying time due to the closer spacing of the flight lines, it results in a more reliable representation of tree structure due to the increase in matched image points. High overlap also provides redundancy in areas of undulating terrain since, for a flight plan with fixed distances between camera exposure stations and between flight lines (each set by the flight planning design), there will be some reduction in both forward and side-overlap whenever the terrain height increases. High overlap also allows for the potential to subsample the acquired images if desired, to decrease processing times.
Image processing
The photographs were not altered or enhanced in any way and were processed using default settings in Agisoft Photoscan Professional (Version 1.3). The default settings were: Key Point Limit = 40 000; Tie Point Limit = 4000 points. Alternative values were tested but it was concluded that the default settings provided just as accurate and comprehensive data as other settings (). The key point limit defines the maximum number of feature points identified in each image and made available for the subsequent image to image search for conjugate (paired) points in neighbouring images; the Tie Point Limit defines the maximum number of key points from each image that can be selected and used in the bundle adjustment solution (triangulation; Agisoft Citation2018). Key Point and Tie Pont values can be varied on a case-by-case basis to optimise the reliability of a photogrammetric solution.
Table 1. Alignment parameters set for processing the photographs acquired by the DJI Phantom 4 Pro for the survey over a planted stand of young Eucalyptus pellita
The High Quality alignment setting was used in the processing of the datasets, meaning that the images were sampled at their original resolution. Selecting Medium Quality would subsample the image resolution by half and Ultra-High would resample the images to double resolution. Generic pre-selection of the photos was enabled as there was a single flight and the photos were sequentially numbered. As surveyed GCP were used, the Reference Pre Selection option was disabled and GNSS coordinates for all the images were unchecked (disabled). The sometimes intermittent/poor quality of the DJI Phantom 4 Pro GPS positional data means that the geotagged image coordinates are insufficient to reliably control the precise alignment of photographs. The geotagged coordinates can be used but tolerances for the accuracy need to be set accordingly in the software. The real world planimetric (E, N) accuracy might be as low as ±1–5 m, and we have observed errors in geotagged elevation of up to 100 m, particularly if sufficient time is not allowed at the commencement of the flight or if GNSS coverage is poor. Adaptive Camera Model Fitting was selected in the alignment options due to the regular gridded nature of the acquired photographs and the lack of tie runs orthogonal to the main flight lines and of oblique/convergent photographs. The overall solution was optimised using the default parameters which were selected on the basis of the effectiveness of the calibration of the camera lens derived from the point matching and effective overlap of the SfM alignment solution.
Extraction of the point cloud data
The dense point cloud was generated with the default values of High Quality and Mild depth filtering. High quality was selected in order to constrain processing time while still providing a high level of detail. Mild depth filtering was selected to ensure there was a neutral amount of filtering; that is, a balance between appropriate levels of noise reduction while maintaining good detection of upper and mid-parts of the tree crowns (Osborn et al. Citation2017).
Segmenting the bare earth terrain
The settings for ground point extraction in Photoscan from the dense point cloud were: Angle 45°, Distance 0.1 m and Cell Size 5 m. These settings resulted in the detection of ground and low points at an observed efficiency of about 90%; manual editing or refinement of the settings would be required in order to improve this result. It is important to optimise ground detection, particularly in the absence of a separately acquired bare earth elevation model derived either from DAP captured prior to planting or from ALS. These bare earth Digital Elevation Models (DEMs) are used to normalise the point cloud for the creation of a CHM and for detection of individual tree tops from which can be derived key inventory parameters (Bohlin et al. Citation2012; White et al. Citation2013; Stone et al. Citation2016).
RGB orthophotography
Two types of orthophoto mosaics were produced. The first was produced using a DEM of the extracted ground surface points. This results in a seamless but spatially less accurate representation of the tree vegetation because the location of image points representing vegetation is spatially corrected on the basis of the bare earth height at the location rather than using the height of the vegetation, that is—the relief distortion in the imagery is not removed as accurately as possible. This mosaic was used for a visual inspection of the individual tree characteristics and to check overall survey location accuracy against the GNSS ground control.
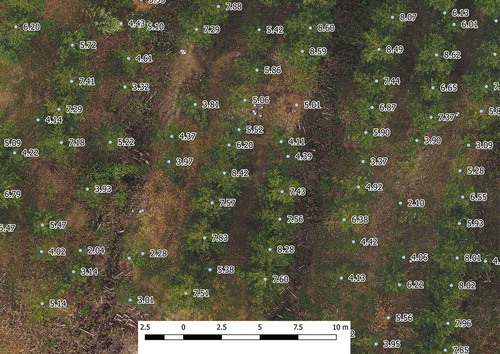
The second orthophoto was produced using a DSM mesh generated from the classified dense point cloud that excluded points classified as ground or low-point classes. For visualisation of the raster orthophoto, this results in a more accurate representation of the location of the canopy and tree crowns in the orthophoto because the mesh is optimally fitting the canopy, but it results in a more fragmented orthophoto () because the surface model being used to account for relief distortion in the photography is far less smooth than an extracted bare earth terrain model.
Figure 1. Individual tree heights annotated onto an orthophoto derived using a digital surface model (DSM). High points in the DSM are closely aligned with the image of each tree top
Individual tree crown segmentation and tree height estimation
The registered and classified point cloud data generated in Agisoft Photoscan were exported in .las format as single blocks totalling 17 000 000 points. Exporting the data as a single block is critical as tiled datasets result in offset duplicate points along the .las tile boundaries in later processing steps. The point cloud was then normalised in the LAStools (rapidlasso GmbH) software package using the ground points classified in the Photoscan ground detection module. While it is possible to use the ‘detect ground functions’ within either the LAStools or CloudCompare (danielgm.net) software packages to achieve similar results, the manual editing and automated attributing of the point cloud is currently easier within Agisoft Photoscan.
The classified point cloud data were then processed in the software tool PointcloudITD (Bryson Citation2017) to extract tree locations. The PointcloudITD software package is freely available from the Forests & Wood Products website (https://www.fwpa.com.au/resources/resources/1461-deployment-and-integration-of-cost-effective-high-spatial-resolution-remotely-sensed-data-for-the-australian-forestry-industry.html). The ground points used for the height normalisation of the point cloud were those generated in Photoscan. The processing variables used for tree top identification were: CHM raster generation 0.10 m, for Local Maxima Finding where Minimum Radius = 0.9 m and Maximum Radius = 10.0 m. Through manual observations it was noted that the PointcloudITD software accurately detected trees that retained dead leaves but had difficulty detecting tree stems after leaf fall.
Extracted tree heights could not be compared with the ground measurements as field assessments were not undertaken. Previous studies, however, have demonstrated the acceptability of deriving individual tree heights using UAV-mounted camera imagery (e.g. Birdal et al. Citation2017). Note, however, that tree heights measured in point cloud data are likely to be referenced to a ground surface extracted from either the DAP point cloud or an ALS point cloud and so may be biased by very low vegetation or forest litter, leading to an underestimation of true heights. It is highly desirable to acquire an accurate bare earth surface such as could be acquired just prior to, or soon after, planting.
Derivation of vegetation indices from the RGB point cloud
RGB-based VIs can be derived from combinations of the DN values captured by consumer-grade digital cameras. The degree of pre-processing undertaken for atmospheric and radiometric calibration can vary considerably. Some operators have applied no pre-processing to their images while others have implemented complex data workflows (e.g. Lebourgeois et al. Citation2008). Imagery can initially be calibrated per band in order to estimate surface reference values using methods such as the Empirical Line Method, which is a simple and direct approach to calibrate the DNs of images to approximated units of surface reflectance. Several raster transform algorithms (i.e. VIs) were evaluated for generating a visually distinctive 3D point cloud representation of the foliar damage symptoms (i.e. necrotic/dead leaf tissue) on individual tree crowns. Visual comparisons resulted in the selection of the VARI as the most sensitive to the extent and severity of necrotic leaf tissue within a tree crown, where VARIGreen = (G-R)/(G + R-B) based on the uncalibrated DN for each of the green (G), red (R) and blue (B) values. The VARI index is commonly used for monitoring the health of agricultural crops and provides a measure of the ‘greenness’ of targeted vegetation (e.g. Sakamoto et al. Citation2012b). The fact that it can be derived from an RGB camera makes it very convenient. As a ratio index, it in part minimises the influence of atmospheric effects, however, variations in sunlight and cloud cover will make temporal comparisons difficult.
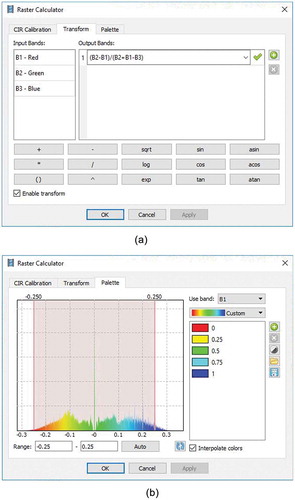
Within Photoscan, the point cloud colour palette is transformed using the Set Raster Transform function ()). The Palette histogram can then be clipped to highlight areas attributed to dead or dying vegetation that appear brown in the normal RGB palette but accentuated to a distinctive red colour in the VARI palette. ) illustrates how the colour histogram was clipped at 0.25 units either side of 0, i.e. from −0.25 to 0.25.
Figure 2. Illustration of settings used in the (a) Agisoft photoscan set raster transform function and (b) raster transform palette settings used for VARI VI VARI, visible atmospheric resistant index
The accuracy of the VARI-transformed orthophoto in detecting necrotic foliage was assessed by visually allocating individual tree crowns into four classes of crown damage severity: (1) healthy; (2) partially damaged; (3) totally necrotic/dead and (4) missing. A total of 1250 tree crowns were visually assessed in the RGB orthophoto and the VARI orthophoto. The time taken to assess the crowns in both the RGB and VARI orthophotos was also recorded. The visual crown assessments were then added to a confusion error matrix and the Producer’s error (a measure of omission error), User’s error (a measure of commission error) and Overall accuracy were calculated (Congalton Citation1990). A subset of trees with discrepancies in crown health classification between the two images were visually examined in more detail in the VARI point cloud.
Results
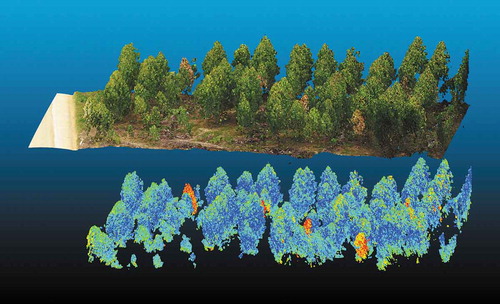
and illustrate the RGB point cloud of a small stand of trees from within the study site ()) and the corresponding normalised and Z clipped VARI-transformed point cloud ()). The VARI point cloud was clipped to 1 m above ground level to remove the ground points which share the same reflectance as the diseased trees due to presence of similar coloured soil, dead understorey vegetation and leaf litter.
Figure 3. (a) The RGB point cloud of a small stand of trees from within the study site; (b) shows the corresponding normalised and Z clipped VARI-transformed point cloud
RGB, Red Green Blue; VARI, Visible Atmospheric Resistant Index
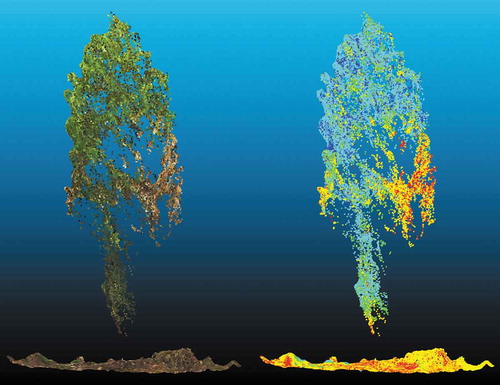
presents an individual diseased tree that has been clipped out of the point cloud. The distribution and relative amount of necrotic leaf tissue caused by the bacterial wilt Ralstonia sp. is visible in the RGB image as a brown discolouration but this is clearly enhanced through the application of the VARI algorithm. The areas of red and yellow in the VARI point cloud relate to the location and level of foliar damage, with yellow colouring representing lower severity than the red discolouration. The extent of necrosis on this example tree is less likely to be clearly visible in the orthophoto as the disease is concentrated in the lower half of the tree. The presence of senescent understorey vegetation also illustrates the requirement to filter out these data from the lower VARI point cloud.
Figure 4. Comparison of a partially diseased Eucalyptus pellita crown as presented in the RGB point cloud dataset with the enhanced point cloud dataset transformed through application of the VARI algorithm to the individual points
RGB, Red Green Blue; VARI, Visible Atmospheric Resistant Index
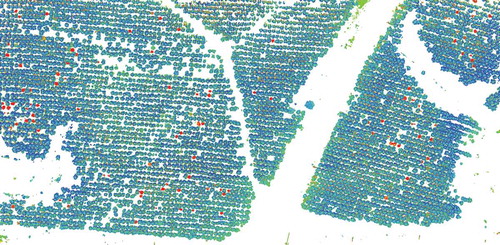
presents a nadir view of the stand after the point cloud has been height normalised (in LAStools), the points classified as ground removed and then clipped at a Z height value that removes the understorey vegetation. This Z clipped point cloud minimises topographical effects and eliminates noise resulting from misclassified ground points, providing distinct visualisation of the dead trees with the necrotic crowns coloured red.
Figure 5. Nadir view of the VARI point cloud that has been height normalised and ‘Z clipped’ to remove the influence of the understorey and soil influences. The red dots represent necrotic trees
VARI, Visible Atmospheric Resistant Index
A non-standard elevation mesh was used to produce a VARI-derived orthophoto with which to visualise the dead trees in raster form. The mesh is a smoothed DSM of all non-ground classified points with extrapolation disabled so that the mesh represents just the patches of the tree crowns.
Of the 1250 tree crowns visually assessed in the RGB orthophoto, the majority were classed as healthy (= 1133 trees), 39 crowns had some necrotic foliage, 40 crowns were completely necrotic and 38 crowns appears to be missing. The discrepancies in classification when the same crowns were assessed in the VARI-transformed orthophoto are presented in a confusion matrix (). The Producer’s accuracy’s (%) for the four classes were 99.8, 71.8, 100.0, 100.0, respectively, and the User’s accuracies (%) were 99.4, 93.3, 95.2 and 95.0, respectively. This resulted in an overall accuracy of 99.0. Caution, however, is required in interpreting these results because of the zero’s occurring in the confusion matrix. The time required to identify and classify unhealthy trees on the RGB raster image was approximately 1.5 hours and the same process for the VARI raster image was only 15 minutes.
Table 2. Confusion matrix and accuracy results for visually detecting healthy, partially affected, dead and missing Eucalyptus pellita crowns affected by the bacterial wilt Ralstonia sp
Some discrepancies between the two images arose because it was difficult to assess using the RGB orthophoto whether an outer circle of dead leaves was associated with a tree crown or with ground vegetation. On inspection of these trees in the 3D VARI point cloud, this distinction was much easier to identify. It was also easier to detect necrotic foliage in the lower crown. Viewing the VARI data in the VARI orthophoto was simpler and faster than inspecting the VARI point cloud, however, the canopy could then be viewed in the 3D point cloud format whenever required.
Discussion
There are potentially several important advantages to using data that has spectral information assigned to individual points in a 3D point cloud representation of the plantation canopy. Advantages of this approach are that:
Data collection is affordable and flexible. For relatively small areas, (<1000 ha), the minimum requirements are a conventional small format digital camera and UAV platform
Acquisition of photography to coincide with preferred operational or environmental conditions is straightforward, particularly in the case of UAV platforms and it is increasingly easy to access and use SfM photogrammetry software
Very high spatial resolution and high spatial accuracy is possible, with GSDs (image resolution) better than 5 cm routinely possible and spatial accuracy of a similar magnitude
RGB colour information, derived VIs and structural three-dimensionally located point clouds are contained in a single coherent dataset, derived using the same image acquisition and processing methods. Spectral and structural data are thus natively coincident rather than reliant on fusion of data from multiple sensors with concomitant errors due to the differing spatial accuracy, spatial resolution and alignment of each data set, the data fusion process, or uncertainty associated with structural and spectral data being collected at different epochs
Derived point clouds encoded with RGB VIs allow for more refined data analysis than can be obtained from raster imagery. The 3D point cloud format allows points associated with terrain to be removed, thus removing from the data spectral responses from understorey vegetation or ground litter. The point cloud format also allows for the possibility of voxel-based analysis (Pearse et al. Citation2018) and thus discrimination of returns from particular components of the canopy.
There are, however, also inherent limitations in the quality of SfM point cloud representations of forest (and plantation) canopies. Extraction of the 3D data relies on conjugate features being visible and reliably matched in multiple images. As a consequence, the 3D point cloud data will normally extend for only a limited depth into the canopy; there will be gaps in the data whenever a component of the canopy is not visible in multiple images due to occlusions or due to poor illumination; and there will be erroneous 3D data due to errors in the image matching process (Dandois et al. Citation2017; Iqbal et al. Citation2018b). Careful flight planning, including consideration of optimal GSD, the use of very high forward and side-overlap imagery, the use of orthogonal flight lines, the choice of camera format and focal length, and the selection of flying time to optimise solar azimuth can reduce these limitations (Dandois et al. Citation2015; Osborn et al. Citation2017; Pepe et al. Citation2018). In addition, the influence of canopy structure is assumed to be minimal in young homogeneous tree plantations compared to a multi-species, multi-age native forest.
The software Agisoft Photoscan provides a simple solution to VI derivation and presentation through its transform and colour palette functions (). This procedure was made simple, in part, because we used uncalibrated DN values. If sunlight conditions vary across a large study site, or vary during acquisition then there may be benefits in adjusting the point cloud colour palette for subsections of the site. If there is a need for temporal comparisons then radiometric calibration may be required with conversion to comparable reflectance values (Iqbal et al. Citation2018a). Notwithstanding these limitations, we have demonstrated that simple VIs can easily be attributed to every point in a 3D point cloud.
The applicability of this approach for forest health surveillance depends on the capacity of RGB VIs to detect unhealthy foliage in tree crowns, in particular the detection of specific symptoms caused by the damaging agent of interest (Stone et al. Citation2003). This process therefore requires an understanding of the chronology of crown symptoms attributed to specific damaging agents. In our case, the VARI VI appears to be sensitive to the presence of necrotic foliage caused by the bacterial wilt but it needs to be seen whether it can also detect other foliar symptoms such as foliar chlorosis (yellowing). It is unlikely that these simple VIs could function as a general purpose tree health indicator. More trialling is required to determine which VIs are most suited for different damaging agents. Testing differing VIs, however, is not a difficult task. The Triangular Greenness Index (TGI) (Hunt et al. Citation2011; Hunt et al. Citation2013), for example, may be more suited for detecting foliage suffering from chlorosis (low chlorophyll content). Implementing different VIs into the workflow described above is straightforward and so there is considerable scope of exploring 3D point cloud vegetation data with a variety of RGB VIs. These may include, for example, the RGB VI (Upadhyay Citation2016), the 2G_RBi greenness index (Woebbecke et al. Citation1995; Richardson et al. Citation2007; Sakamoto et al. Citation2012a; Sakamoto et al. Citation2012b; Bendig Citation2015; Inoue et al. Citation2015; Anderson et al. Citation2016) or the Channel % Index (Woebbecke et al. Citation1995; Richardson et al. Citation2007; Sakamoto et al. Citation2012a; Sakamoto et al. Citation2012b; Bendig et al. Citation2015; Inoue et al. Citation2015).
The majority of published VIs are based on a mixture of visible and NIR bands. An opportunity afforded by modern digital cameras is the high sensitivity of their imaging arrays to light in the NIR (Nijland et al. Citation2014; Zheng et al. Citation2018). These cameras can be modified by removing an NIR filter to capture in the NIR part of the spectrum. This would enable capture of the Normalised Difference Vegetation Index (NDVI), which is one of the most commonly employed VIs. The NDVI is responsive to levels of green biomass and hence could be sensitive to varying levels of defoliation in young tree crowns. In addition, light-weight multispectral (with NIR wavebands) and hyperspectral sensors are becoming more available, with the expectation that their prices will fall.
The extraction of spectral data from raster format unrectified, rectified or orthophoto images does not capture the influence of the 3D structural characteristics of forest canopies on spectral behaviour. Therefore, while the use of this imagery for analysing vegetation health may be suitable for many agricultural crops (e.g. Candiago et al. Citation2015), orthophotography may not accurately represent the full extent of damage in a stand of trees and complicates spectral interpretation because of the vertical integration of data into a single raster pixel. Cardil et al. (Citation2017), for example, noted that their models derived from UAV-acquired RGB orthophotography underestimated defoliation in a mixed species forest. They concluded that field estimates of defoliation were based on a visual assessment of the entire crown thus providing a percentage of defoliation in volume, whereas the 2D orthophotography may not have captured defoliation occurring in lower parts of the trees.
This issue can be addressed by directly examining the spectral information of each point in the 3D point cloud because each point in the cloud has both an X, Y, Z, (E, N, H) coordinate and an assigned DN brightness value for each spectral (R, G, B) band. Notwithstanding the potential limited penetration of 3D point cloud data in tree canopies, we argue that this colour information encoded into photogrammetrically derived dense points is a simple, affordable solution to improving the detection and mapping of tree damage symptoms. The visual assessment of damaged tree crowns in an orthophoto derived from a VARI point cloud data revealed that it was easier, and therefore quicker to detect necrotic foliage than in a corresponding RGB orthophoto. The VARI-assigned values visually accentuated the presence of even small patches of necrotic foliage.
A high-quality Digital Terrain Model (DTM) was not already available for the study site. This is usually derived from ALS data or photogrammetrically at a time when the vegetation cover is sparse (e.g. just prior to planting). The DTM is required in order to remove terrain height and in turn obtain canopy or individual tree heights, which is an essential step in the extraction of metrics for inventory attribute estimation and mapping (White et al. Citation2013; White et al. Citation2015). In the case of the study site used in this project, the relatively young age of the plantation together with the use of very high overlap photography meant that a reliable DTM could be derived. In other circumstances, particularly where there is greater canopy closure, it is less likely a suitable DTM could be extracted. It is important to note, however, that a high accuracy bare earth DTM is not necessarily required if the only purpose of the photography is to assess tree health, rather than also to extract reliable estimates of tree height (and other inventory parameters that can be derived from the normalised point cloud). If inventory attributes are not required, then a VI can be applied to point cloud data that has not been normalised using a DTM or has been normalised using only a low accuracy DTM. Some modification to the approach used to remove point cloud data associated with bare earth, low (non-plantation) vegetation and leaf litter would be required.
Several studies have demonstrated the comparable performance of LiDAR and DAP point clouds for modelling forest attributes such as mean height and standing volume using an area-based approach (e.g. Bohlin et al. Citation2012; White et al. Citation2015; Caccamo et al. Citation2018; Iqbal et al. Citation2018b). Our study demonstrates the potential of processing a single 3D imagery point cloud to simultaneously map key inventory attributes as well as survey for unhealthy tree crowns with dead and dying foliage. These tasks can now be undertaken using consumer-grade UAV systems and processed in workflows readily available in software packages such as Agisoft Photoscan and LAStools (rapidlasso GmbH). Using ground-based crown health assessments, further studies could assess whether the spectral information captured in the 3D point clouds are suitable for automated classification of damage severity (Lehmann et al. Citation2015; Dash et al. Citation2017).
Acknowledgements
This paper arose from a workshop on the application of remote sensing for timber plantation inventory and health held in the Riau Province, central Sumatra on 30–31 July 2018 as part of the ACIAR-funded project FST/2014/068 ‘Management strategies for Acacia plantation diseases in Indonesia and Vietnam’. The authors would like to thank M. P. Sucahyono and Fadjar Sagitarianto (PT. Arara-Abadi, Sinarmas Forestry) for their field assistance. We also thank Sam Hislop for construction of the error confusion matrix and Arko Lucieer for his constructive comments on the manuscript.
Disclosure statement
No potential conflict of interest was reported by the authors.
Additional information
Funding
References
- Adamsen FG, Pinter PJ, Barnes EM, LaMorte RL, Wall GW, Leavitt SW, Kimball BA. 1999. Measuring wheat senescence with a digital camera. Crop Science. 39:719–724.
- Agisoft. 2018. Agisoft metashape user manual: professional edition, Version 1.5. St. Petersburg (Russia): Agisoft LLC.
- Alonzo M, Andersen H-E, Morton DC, Cook BD. 2018. Quantifying boreal forest structure and composition using UAV structure from motion. Forests. 9:Article 119.
- Anderson HB, Nilsen L, Tømmervik H, Karlsen SR, Nagai S, Cooper EJ. 2016. Using ordinary digital cameras in place of near-infrared sensors to derive vegetation indices for phenology studies of high arctic vegetation. Remote Sensing. 8:Article 847.
- Bendig J, Yu K, Aasen H, Bolten A, Bennertz S, Broscheit J, Gnyp ML, Bareth G. 2015. Combining UAV-based plant height from crop surface models, visible, and near infrared vegetation indices for biomass monitoring in barley. International Journal of Applied Earth Observation and Geoinformation. 39:79–87.
- Birdal AC, Avdan U, Turk T. 2017. Estimating tree heights with images from an unmanned aerial vehicle. Geomatics, Natural Hazards and Risks. 8:1144–1156.
- Bohlin J, Wallerman J, Fransson JES. 2012. Forest variable estimation using photogrammetric matching of digital aerial images in combination with a high-resolution DEM. Scandinavian Journal of Forest Research. 27:692–699. [accessed 2018 Nov 20]. doi: 10.1080/02827581.2012.686625.
- Bonnet S, Lisein J, Lejeune P. 2017. Comparison of UAS photogrammetric products for tree detection and characterization of coniferous stands. International Journal of Remote Sensing. 38:5310–5337.
- Bryson M. 2017. PointcloudITD: a software package for individual tree detection and counting. In: Deployment and integration of cost-effective high resolution remotely sensed data for the Australian forestry. Forest &Wwood Products Australia final report for project PNC326-1314. [accessed 2018 Aug 10]. Available from: https://www.fwpa.com.au/resources/resources/1461-deployment-and-integration-of-cost-effective-high-spatial-resolution-remotely-sensed-data-for-the-australian-forestry-industry.html.
- Caccamo G, Iqbal IA, Osborn J, Bi H, Arkley K, Melville G, Aurik D, Stone C. 2018. Comparing yield estimates derived from LiDAR and aerial photogrammetric point-cloud data with cut-to-length harvester data in a Pinus radiata plantation in Tasmania. Australian Forestry. 81:131–141. [accessed 2018 Nov 20]. doi: 10.1080/00049158.2018.1458582.
- Camino C, González-Dugo V, Hernández P, Sillero J, Zarco-Tejada P. 2018. Improved nitrogen retrievals with airborne-derived fluorescence and plant traits quantified from VNIR-SWIR hyperspectral imagery in the context of precision agriculture. International Journal of Applied Earth Observation and Geoinformation. 70:105–117.
- Candiago S, Remondino F, De Giglio M, Dubbini M, Gattelli M. 2015. Evaluating multispectral images and vegetation indices for precision farming applications from UAV images. Remote Sensing. 7:4026–4047.
- Cardil A, Vepakomma U, Brotons L. 2017. Assessing pine processionary moth defoliation using unmanned aerial systems. Forests. 8:Article 402.
- Congalton RG. 1990. A review of assessing the accuracy of classifications of remotely sensed data. Remote Sensing of Environment. 37:35–46.
- Dandois JP, Baker M, Olano M, Parker GG, Ellis EC. 2017. What is the point? Evaluating the structure, color, and semantic traits of computer vision point clouds of vegetation. Remote Sensing. 9:Article 355.
- Dandois JP, Olano M, Ellis EC. 2015. Optimal altitude, overlap, and weather conditions for computer vision UAV estimates of forest structure. Remote Sensing. 7:13895–13920.
- Dash JP, Watt MS, Pearse GD, Heaphy M, Dungey HS. 2017. Assessing very high resolution UAV imagery for monitoring forest health during a simulated disease outbreak. ISPRS Journal of Photogrammetry and Remote Sensing. 131:1–14.
- Gerhards M, Schlerf M, Rascher U, Udelhoven T, Juszczak T, Aberterti G, Miglietta F, Inoue Y. 2018. Analysis of airborne optical and thermal imagery for detection of water stress symptoms. [accessed 2018 Nov 20]. Remote Sensing. 10:Article 1139. doi: 10.3390/rs10071139.
- Goodbody TRH, Coops NC, Hermosilla T, Tompalski P, McCartney G, MacLean DA. 2018. Digital aerial photogrammetry for assessing cumulative spruce budworm defoliation and enhancing forest inventories at a landscape-level. ISPRS Journal of Photogrammetry and Remote Sensing. 142:1–11.
- Goodbody TRH, Coops NC, Marshall PL, Tompalski P, Crawford P. 2017. Unmanned aerial systems for precision forest inventory purposes: a review and case study. Forest Chronicle. 93:71–81.
- Guerra-Hernández J, Cosenza DN, Rodriguez LCE, Silva M, Tomé M, Ramón A, González-Ferreiro E. 2018. Comparison of ALS- and UAV(SfM)-derived high-density point clouds for individual tree detection in Eucalyptus plantations. International Journal of Remote Sensing. 39:5211–5235.
- Hernández-Clemente R, Navarro-Cerrillo RM, Navarro-Cerrillo RM, Zarco-Tejada PJ. 2011. Assessing structural effects on PRI for stress detection in conifer forests. Remote Sensing of Environment. 115:2360–2375.
- Hunt ER, Daughtry CST, Eitel JU, Long DS. 2011. Remote sensing leaf chlorophyll content using a visible band index. Agronomy Journal. 103:1090–1099.
- Hunt ER, Doraiswamy PC, McMurtrey E, Daughtry CS, Perry EM, Akhmedov B. 2013. A visible band index for remote sensing leaf chlorophyll content at the canopy scale. International Journal of Applied Earth Observation and Geoinformation. 21:103–112.
- Inoue T, Nagai S, Kobayashi H, Koizumi H. 2015. Utilization of ground-based digital photography for the evaluation of seasonal changes in the aboveground green biomass and foliage phenology in a grassland ecosystem. Ecological Informatics. 25:1–9.
- Iqbal F, Lucieer A, Barry K. 2018a. Simplified radiometric calibration for UAS-mounted multispectral sensor. European Journal of Remote Sensing. 51:301–313.
- Iqbal IA, Musk RA, Osborn J, Stone C, Lucieer A. 2019. A comparison of area-based forest attributes derived from airborne laser scanner, small-format and medium-format digital aerial photography. International Journal of Applied Earth Observation & Geoinformation. 76:231–241.
- Iqbal IA, Osborn J, Stone C, Lucieer A, Del M, McCoull C. 2018b. Evaluating the robustness of point clouds from small format aerial photography over a Pinus radiata plantation. Australian Forestry. 81:162–176. [accessed 2018 Nov 20]. doi: 10.1080/00049158.2018.1482799.
- Jannoura R, Brinkmann K, Uteau D, Bruns C, Joergensen RG. 2015. Monitoring of crop biomass using true colour aerial photographs taken from a remote controlled hexacopter. Biosystems Engineering. 129:341–351.
- Jayathunga S, Owari T, Tsuyuki S. 2018. Evaluating the performance of photogrammetric products using fixed-wing UAV imagery over a mixed conifer-broadleaf forest: comparison with airborne laser scanning. Remote Sensing. 10:Article 187.
- Kangas A, Gobakken T, Puliti S, Hauglin M, Næsset E. 2018. Value of airborne laser scanning and digital aerial photogrammetry data in forest decision making. Silva Fennica. 52:Article 9923.
- Keane PJ, Kile GA, Podger FD, Brown BN, editors. 2000. Diseases and pathogens of eucalypt. Collingwood (Australia): CSIRO Publishing.
- Lebourgeois V, Bégué A, Labbé S, Mallavan B, Prévot L, Roux B. 2008. Can commercial digital cameras be used as multispectral sensors? A crop monitoring test. Sensors. 8:7300–7322.
- Lehmann JRK, Nieberding F, Prinz T,Knoth C. 2015. Analysis of unmanned aerial system-based CIR images in forestry – a new perspective to monitor pest infestation levels. Forests. 6:594–612.
- Meddens AJH, Hicke J. 2014. Spatial and temporal patterns of Landsat-based detection of tree mortality caused by a mountain pine beetle outbreak in Colorado, USA. Forest Ecology & Management. 322:78–88.
- Näsi R, Honkavaara E, Blomqvist M, Lyytikäinen-Saarenmaa P, Hakala T, Viljanen N, Kantola T, Holopainen M. 2018. Remote sensing of bark beetle damage in urban forests at individual tree level using a novel hyperspectral camera from UAV and aircraft. Urban Forestry & Urban Greening. 30:72–83.
- Näsi R, Honkavaara E, Lyytikäinen-Saarenmaa P, Blomqvist M, Litkey P, Hakala T, Viljanen N, Kantola T, Tanhuanpää T, Holopainen M. 2015. Using UAV-based photogrammetry and hyperspectral imaging for mapping bark beetle damage at tree-level. Remote Sensing. 7:15467–15493.
- Navarro JA, Fernández-Landa A, Tomé JL, Guillén-Climent ML, Ojeda JC. 2018. Testing the quality of forest variable estimation using dense image matching: a comparison with airborne laser scanning in a Mediterranean pine forest. International Journal of Remote Sensing. 39:4744–4760.
- Nijland W, de Jong R, de Jong SM, Wulder MA, Bater CW, Coops NC. 2014. Monitoring plant condition and phenology using infrared sensitive consumer grade digital cameras. Agricultural and Forest Meteorology. 184:98–106.
- Nurminen K, Karjalainen M, Yu X, Hyyppä J, Honkavaara E. 2013. Performance of dense digital surface models based on image matching in the estimation of plot-level forest variables. ISPRS Journal Photogrammetry & Remote Sensing. 83:104–115. [accessed 2018 Nov 20]. doi: 10.1016/j.isprsjprs.2013.06.005.
- Osborn J, Dell M, Stone C, Iqbal I, Lacey M, Lucieer A, McCoull CJ. 2017. Photogrammetry for forest inventory: planning guidelines. Melbourne (Australia): Forest and Wood Products Australia. PNC326-1314. Available from: https://www.fwpa.com.au/images/resources/-2017/Photogrammetry_for_Forest_Inventory_Planning_Guide_PNC326-1314.pdf.
- Ota T, Ogawa M, Mizoue N, Fukumoto K, Yoshida S. 2017. Forest structure estimation from a UAV-based photogrammetric point cloud in managed temperate coniferous forests. Forests. 8:Article 343.
- Pearse GD, Watt MS, Dash JP, Stone C, Caccamo G. 2018. Comparison of models describing forest inventory attributes using standard and voxel-based lidar predictors across a range of pulse densities. International Journal of Applied Earth Observation and Geoinformation. [accessed 2018 Nov 20]. doi: 10.1016/j.jag.2018.10.008.
- Pepe M, Fregonese L, Scaioni M. 2018. Planning airborne photogrammetry and remote-sensing missions with modern platforms and sensors. European Journal of Remote Sensing. 51:412–436.
- Pietrzykowski E, Sims N, Stone C, Pinkard L, Mohammed C. 2007. Predicting Mycosphaerella leaf disease severity in a Eucalyptus globulus plantation using digital multi-spectral imagery. Southern Hemisphere Forestry Journal. 69:175–182.
- Possoch M, Bieker S, Hoffmeister D, Bolten A, Schellberg J, Bareth G. 2016. Multi-temporal crop surface models combined with the RGB vegetation index from UAV-based images for forage monitoring in grassland. The International Archives of Photogrammetry, Remote Sensing and Spatial Information Sciences. 41:991.
- Pu R, Kelly M, Anderson GL, Gong P. 2008. Using CASI hyperspectral imagery to detect mortality and vegetation stress associated with a new hardwood forest disease. Photogrammetric Engineering & Remote Sensing. 74:65–75.
- Puliti S, Gobakken T, Ørka HO, Næsset E. 2017. Assessing 3D point clouds from aerial photographs for species-specific forest inventory. Scandinavian Journal Forest Research. 32:68–79.
- Richardson AD, Jenkins JP, Braswell BH, Hollinger DY, Ollinger SV, Smith ML. 2007. Use of digital webcam images to track spring green-up in a deciduous broadleaf forest. Oecologia. 152:323–334.
- Sakamoto T, Gitelson AA, Nguy-Robertson AL, Arkebauer TJ, Wardlow BD, Suyker AE, Verma SB, Shibayama M. 2012a. An alternative method using digital cameras for continuous monitoring of crop status. Agricultural and Forest Meteorology. 154:113–126.
- Sakamoto T, Gitelson AA, Wardlaow BD, Arkebauer TJ, Verma SB, Suyker AE, Shibayama M. 2012b. Application of day and night digital photographs for estimating maize biophysical characteristics. Precision Agriculture. 13:285–301.
- Stone C, Carnegie A, Matsuki M, Parsons M. 2003. Pest and disease assessment in young eucalypt plantations – field manual for using the crown damage index. Canberra: National Forest Inventory, Bureau of Rural Sciences.
- Stone C, Mohammed C. 2017. Application of remote sensing technologies for assessing planted forests damaged by insect pests and fungal pathogens: a review. Current Forestry Reports. 3:75–92.
- Stone C, Webster M, Osborn J, Iqbal I. 2016. Alternatives to LiDAR-derived canopy height models for softwood plantations: a review and example using photogrammetry. Australian Forestry. 79:271–282. [accessed 2018 Nov 20]. doi: 10.1080/00049158.2016.1241134.
- Tompalski P, Coops NC, Marshall PL, White JC, Wulder MA, Bailey T. 2018. Combining multi-date airborne laser scanning and digital aerial photogrammetric data for forest growth and yield modelling. Remote Sensing. 10:Article 347.
- Upadhyay P, Mahadik S, Kamble A. 2016. Image classification using visible RGB bands. Third International Conference on Computing for Sustainable Global Development; Mar 16–18; New Delhi, India: IEEE Xplore, Accession Number 164261503.
- Wallace L, Lucieer A, Malenovský Z, Turner D, Vopěnka P. 2016. Assessment of forest structure using two UAV techniques: a comparison of airborne laser scanning and structure from motion (SfM) point clouds. Forests. 7:Article 62.
- White JC, Stepper C, Tompalski P, Coops N, Wulder M. 2015. Comparing ALS and image-based point cloud metrics and modelled forest inventory attributes in a complex coastal forest environment. Forests. 6:3704–3732. [accessed 2018 Nov 20]. doi: 10.3390/f6103704.
- White JC, Wulder MA, Vastaranta M, Coops NC, Pitt D, Woods M. 2013. The utility of image-based point clouds for forest inventory: a comparison with airborne laser scanning. Forests. 4:518–536.
- Woebbecke DM, Meyer GE, VonBargen K, Mortensen DA. 1995. Color indices for weed identification under various soil, residue and lighting conditions. Transactions of the American Society of Agricultural Engineers. 38:259–269.
- Wulder MA, White JC, Coggins S, Ortlepp SM, Coops NC, Heath J, Mora B. 2012. Digital high spatial resolution aerial imagery to support forest health monitoring: the mountain pine beetle context. Journal of Applied Remote Sensing. 6:Article 062527.
- Xue J, Su B. 2017. Significant remote sensing vegetation indices: a review of developments and applications. Journal of Sensors. 2017:Article 1353691.
- Zheng H, Cheng T, Li D, Zhou X, Yao X, Tian Y, Cao W, Zhu Y. 2018. Evaluation of RGB, color-infrared and multispectral images acquired from unmanned aerial systems for the estimation of nitrogen accumulation in rice. Remote Sensing. 10:Article824.