Abstract
This study examined the development of declarative and procedural memory longitudinally in primary school-aged children. At present, although there is a general consensus that age-related improvements during this period can be found for declarative memory, there are conflicting data on the developmental trajectory of the procedural memory system. At Time 1 children aged around 5½ years were presented with measures of declarative and procedural memory. The tasks were then administered 12 months later. Performance on the declarative memory task was found to improve at a faster rate in comparison to the procedural memory task. The findings of the study support the view that multiple memory systems reach functional maturity at different points in development.
Much research has accumulated supporting the view of multiple memory systems (Squire, Citation2004). A number of taxonomies have been forwarded that attempt to describe the functional and neurological correlates of each memory system (e.g., Graf & Schacter, Citation1987; Squire, Knowlton, & Musen, Citation1993). One model distinguishes between declarative and procedural memory (Squire & Zola, Citation1996). Functionally, declarative memory is involved in the explicit acquisition, retention and retrieval of information for personal events (in the case of episodic memory) or facts (in the case of semantic memory). The declarative memory system achieves this through linking different representations (Mayes, Montaldi, & Migo, Citation2007). Learning through this system is rapid, can occur following a single exposure, and is primarily supported by the medial temporal lobes (Squire, Stark, & Clark, Citation2004). The procedural memory system is involved in the acquisition and retrieval of habits, motor and cognitive skills (Packard & Knowlton, Citation2002). Unlike declarative memory, information learnt via this system does not require conscious awareness. Learning through this system is typically slower and achieved through repeated execution of a motor skill or exposure to a particular stimulus sequence. Evidence suggests that the procedural memory system is mediated by the basal ganglia and cerebellum (Gabrieli, Citation1998).
Developmentalists have been interested in the maturation of multiple memory systems. Early theories made developmental conclusions from observations of adult clinical populations (Schacter & Moscovitch, Citation1984). In many of these cases memory impairments were observed with declarative but not procedural memory (e.g., Cohen & Squire, Citation1980). The apparent robustness of the procedural memory system led to the proposal that it may mature earlier than declarative memory (Reber, Citation1992). More recently, neurodevelopmental studies undertaken with infants and children suggested that declarative and procedural memory systems develop according to different developmental timetables (Bauer, Citation2007; Schacter & Moscovitch, Citation1984). Supporting this claim are research findings into pre- and postnatal brain development that suggest regional differences in neurogenesis, cell migration, synaptogenesis, myelination and synaptic pruning (e.g., Lenroot & Giedd, Citation2006; Sowell, Thompson, & Toga, Citation2004). In general terms, the maturation of subcortical and cerebellum structures precedes occipital, temporal and frontal lobes (Anderson & Lajoie, Citation1996). Because procedural memory is mediated by structures that mature first, it has been suggested that this system may reach adult-like levels of functioning early in development (Bauer, Citation2007). Regional differences in brain development have also been found to extend into childhood and adolescence. Large-scale studies utilising magnetic resonance imaging have found that the temporal lobe, which is implicated in declarative memory, exhibits a curvilinear developmental trend between the ages of 4 and 22 years, with size increasing until around 16 years. In contrast, the caudate, which is one of the structures that comprise the basal ganglia and supports procedural memory, exhibits a relatively stable development that peaks in size between the ages of 7½ and 10 years (Giedd et al., Citation1999; Lenroot & Giedd, Citation2006).
Behavioural studies of declarative memory functioning in children have generally been consistent with the neurological data. In general terms, most studies have reported that older children perform better on tests of declarative memory than younger children (e.g., Kramer, Delis, Kaplan, O'Donnell, & Prifitera, Citation1997). Discrepant findings, however, have been observed in relation to behavioural studies of procedural memory. At the heart of the debate are concerns as to whether age-related differences exist for this memory system. If it is the case that procedural memory matures early in development, then age-related differences should not be observed on tasks that purport to measure this system. Tests of this hypothesis have been mixed, with studies reporting either the presence or absence of age-related difference in procedural or other forms of implicit memory (e.g., Mayberry, Taylor, & O'Brien-Malone, Citation1995; Vinter & Perruchet, Citation2000).
Serial reaction time (SRT) paradigms have been used to study procedural memory development in children. In SRT tasks, participants are seated in front of a computer screen. A visual stimulus then repeatedly appears in one of four designated spatial locations. The participant's sole instruction is to press the corresponding button on a four-button response panel. Unbeknown to the participant, on some blocks the visual stimulus follows a sequence and on others presentation is random (e.g., Nissen & Bullemer, Citation1987). Reaction times (RTs) are the primary dependent variable of interest in SRT tasks. In cases in which procedural memory has developed, RTs decrease as participants respond to the repeating sequences. An increase in RTs, however, is observed when the stimulus appears randomly. This increase in RTs is considered to indicate implicit learning of the sequence. This is because if no information had been learnt it would be expected that RTs should continue to decrease as participants become more proficient at responding to the visual stimulus.
If it is the case that procedural memory matures relatively earlier it would be expected that age-related differences should not be observed on SRT tasks. To date, the results have been mixed. Studies by Meulemans, van der Linden, and Perruchet (Citation1988) and Thomas and Nelson (Citation2001) reported non-significant differences on SRT tasks between groups of children and adults. Meulemans et al. examined procedural learning in two groups of children (aged 6 and 7 years) and one group of adults (aged 18–27 years). The participants in the Thomas and Nelson study were groups of children aged 4, 7, and 10 years. The key comparison of interest was whether RTs collected from sequenced and random blocks were comparable across different age groups. In both studies the magnitude of the difference between repeating and random sequences was found to be comparable across all groups. Thus it seems that all groups learnt the sequence with equal levels of proficiency. This occurred even though none of the children in the studies were able to explicitly recall the sequence. Age-related differences in procedural memory, however, were reported by Thomas et al. (Citation2004). That study compared children aged between 7 and 11 years and adults aged between 23 and 33 years on an SRT task. Both groups were faster to respond to sequenced blocks in comparison to random blocks. The magnitude of difference, however, between sequenced and random blocks was larger for the adults than the children. These results were interpreted to suggest age-related differences in procedural memory.
At present there are no longitudinal data available on procedural memory development; the development of this memory system has been inferred from cross-sectional designs. Subsequently, rather than being able to study change in memory functioning, questions concerning procedural memory development have been addressed on the basis of whether a statistically significant difference between two or more age groups has been observed. This type of method and analysis has inherent constraints that need to be considered when making inferences about development. In particular, when statistically significant differences have been observed between groups of different ages, it needs to be shown that the independent variable was the primary source of variance and not any other extraneous variable that correlates with group membership. The clearest case in which this might be a problem occurs when comparing children and adults on SRT tasks. Given that children differ from adults not only neurologically, but also with respect to cognitive, social, and motor skills, all of which also correlate with age, one cannot rule out that one of these variables and not procedural memory produced differences between groups. Thus one problem with cross-sectional designs is that the presence or absence of age-related differences may arise from the characteristics of the comparison group rather than inherent properties of the procedural memory system.
The current state of the field suggests that declarative memory continues to develop throughout childhood. However, although procedural memory has been shown to be invariant to age (e.g., Meulmans et al., 1988), relatively more recent research (Thomas et al., Citation2004) has challenged the idea. In the present study a longitudinal design was used to investigate procedural and declarative memory development. Using this design we were able to quantify changes in memory functioning. Participants in this study were children aged approximately 5½ years at the first round of testing. The rationale for selecting this age follows from research showing that the caudate peaks in size when children are between the ages of 7½ and 10 years (Giedd et al., Citation1999; Lenroot & Giedd, Citation2006). Assessing children younger than 7½ years allowed us to study procedural memory in a period in which it would still be reasonable to observe behavioural change given that the underlying neurological structures supporting this system are still developing. The children in this study were presented with a battery of tests that included measures of declarative and procedural memory. All tasks were presented to the children twice, with testing dates separated by a 12-month interval. Studying the development of the two memory systems at the same time also allowed us to directly compare the rate of development between memory systems over this period.
Method
Participants
A total of 67 children participated in the study. The memory skills of 40 children (20 girls, 20 boys) were examined longitudinally over a 12-month period (±3 months). At Time 1 the mean age of this group (hereafter referred to as the longitudinal group) was 5 years 6 months and at Time 2, 6 years 6 months. A potential problem with re-testing these children was that performance on the memory tasks at Time 2 may have been influenced by the earlier round of testing. To examine potential practice effects, a second group (hereafter referred to as the control group) consisting of 27 children (13 girls, 14 boys) of comparable age to the longitudinal group at Time 2 were also presented with the same battery of tests. If re-testing influences performance on the memory tasks, differences in performance between the longitudinal group at Time 2 and control group would be expected. All children were recruited from primary schools located in Manchester, United Kingdom.
The children participating in the study were presented with the Raven Coloured Progressive Matrices (RCPM) (Raven, Citation1998) and British Picture Vocabulary Test Second Edition (BPVS-2) (Dunn, Dunn, Whetton, & Burley, Citation1997). These tests were administered to provide some evidence that cognitive development was unimpaired in the sample (a description of these tests is presented below). Descriptive statistics of the children's age and scores from the RCPM and BPVS-2 reported by group are presented in . Analyses were undertaken to ensure that the age and scores from the BPVS-2 and RCPM of the longitudinal group at Time 2 were comparable with those of the control group. Differences between these groups were evaluated using independent samples t tests and the effect size measure r2. In this context r2 describes the extent that differences in age and test scores are accounted for by group membership. If the two groups are comparable on the dependent variables the effect size should be small. As an approximate guideline Cohen (Citation1988) suggested that an r2 of .010 is small, .059 is medium and .138 is large. (It should also be noted that effect sizes can be used to provide an estimate of the overlap in two distributions. When an r2 of .010 [i.e., small effect size] indicates that 85.3% of scores overlap, an r2 of .059 indicates that 67% of scores overlap and an r2 of .138 indicates that 52.6% of scores overlap; Cohen, Citation1988.) Non-significant differences and small effect sizes were observed with respect to age, t(65) = .165, p = .869, r2 < .001, and scores from the BPVS-2, t(66) = .725, p = .471, r2 = .008, and RCPM, t(65) = 1.073, p = .287, r2 = .017. Inspection of effect sizes indicated the control and longitudinal groups were comparable with respect to age, vocabulary and non-verbal reasoning.
Table I. Subject age data and test scores
Materials
Children were presented with measures of intelligence, vocabulary as well as tasks assessing procedural and declarative memory. Each is test now described.
Measure of intelligence
Intellectual functioning was screened using the RCPM. On this test children are presented with a visual stimulus consisting of a pattern that has a missing piece. Children are asked to select the missing piece from an array of six. Previous research has shown that scores from the RCPM correlate with the Performance IQ (r = .52), Verbal IQ (r = .54) and Full IQ (r = .55) from the Wechsler Intelligence Scale for Children (Chalmers & Frederick, Citation1955).
Measure of vocabulary
Children's vocabulary was tested using the BPVS-2. On this test children are presented with an array of four pictures and asked to point to the one that matches a word spoken by the test administrator.
Measure of procedural memory
Procedural memory was examined using a modified version of the Nissen and Bullemer (Citation1987) SRT task. There is considerable empirical evidence that supports the validity of SRT tasks as a measure of procedural memory functioning. For instance, adults with neurodegenerative disorders that affect the basal ganglia differ with respect to controls on SRT tasks (e.g., Siegert, Taylor, Weatherall, & Abernethy, Citation2006), whereas individuals with neurological damage leading to declarative memory impairments have been reported to perform as well as controls (Nissen, Willingham, & Hartman, Citation1989).
In the current study children were presented with a response pad, similar to those found in commercially available computer game consoles, and were seated approximately 40 cm in front of a Dell Latitude laptop computer. On this version of the SRT task a visual stimulus, which was a well-known cartoon character, appeared in one of four designated spatial locations. The locations in which the visual stimulus could appear were arranged in a diamond shape on the laptop's monitor. The response pad consisted of four buttons that were also arranged in a diamond shape. This method was selected to minimise the influences of motor development. The locations in which the visual stimulus appeared matched the layout of the buttons on the response pad. Children were informed that they would see the cartoon character appear in one of four locations on the computer screen and their task was to press the matching button on the response pad. Children were presented with five blocks. In each block the visual stimulus appeared 60 times in one of the four locations. A schematic overview of the task is presented in .
Figure 1. Overview of the serial reaction time task. A visual stimulus appeared on a computer monitor in one of four spatial locations and participants were asked to press the corresponding button on a response panel. This figure is reproduced from Lum et al. (in press).
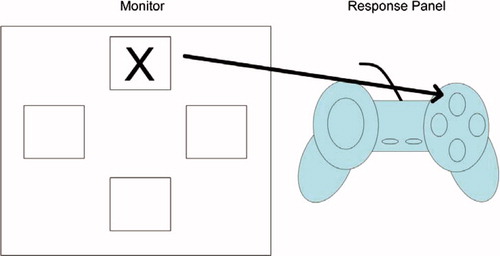
Unbeknown to the children, on Blocks 1–4 the visual stimulus appeared in a 10-item sequenced pattern. Labelling the uppermost spatial position as 1, the rightmost position as 2, bottom position as 3 and leftmost position as 4, the pattern was 4, 2, 3, 1, 3, 2, 4, 3, 2 and 1. This pattern was the same used by Nissen and Bullemer (Citation1987). On the fifth block the visual stimulus appeared in a pseudo-random order with the following two constraints. First, the visual stimulus appeared in each spatial location the same number of times as in the previous blocks. Second, the probability of the visual stimulus appearing in one of the four spatial locations, given the location of the previous visual stimulus was the same as observed on Blocks 1–4. Specifically, in the 10-item sequenced pattern used in this study, if the visual stimulus appeared in location 1, there was a 50% chance that on the next trial it would appear in locations 3 or 4. If the visual stimulus appeared in location 2, there was a 33.33% probability that it would appear in locations 1, 3 or 4. If the visual stimulus appeared in location 3, there was a 33.33% probability it would appear in location 1 and 66.66% probability it would appear in location 2. Finally, if the stimulus appeared in location 4, there was an equal probability it would appear in locations 2 or 3. These probabilities between spatial locations were preserved in the random block. These constraints were necessary to control for the possibility that children may have only learnt associations between pairs of locations on the task (Jackson, Jackson, Harrison, Henderson, & Kennard, Citation1995). At the end of the task children were asked whether they became aware of the pattern. Irrespective of children's responses they were then asked to explicitly recall in which order they expected the visual stimulus to appear. None of the children at either time successfully recalled the pattern.
Two dependent variables were collected from the SRT task: accuracy and RTs. In this task accuracy described the number of times children pressed the correct button on the response pad following presentation of the visual stimulus. RTs described the amount of time taken (in ms) for children to press the response button after the visual stimulus appeared. The proportion of correct responses and median RTs were computed for each of the five blocks for each child.
Measure of declarative memory
Declarative memory was assessed using the word pairs (WP) subtest from the Children's Memory Scales (CMS, hereafter notated as WP-CMS) (Cohen, Citation1997). This task was selected because neuropsychological data have been presented that validate its use as a measure of declarative memory. Specifically, children with neural pathology associated with the left medial temporal lobe typically have difficulty learning lists of semantically unrelated word pairs (Cohen, Citation1997; Jambaqué et al., 2007). On the WP-CMS children were orally presented with a list of 10 semantically unrelated word pairs (e.g., leaf–school). The task consists of three trials. On each trial the test administrator orally presented the list of word pairs. Then children were presented with the first word of the pair (e.g., leaf) and were then asked to recall the second (e.g., school). At the end of the task children were asked to recall as many words pairs as they could (e.g., leaf–school). In accordance with the test's administration and scoring, children's performance on this task was described as the total number of items recalled across trials.
Procedure
The battery of tests and tasks were individually presented to each child in a quiet room at his/her school. Presentation of the battery was randomised to control for carry-over effects. In particular, the order in which declarative and procedural memory tasks were presented was counterbalanced between each child to average over the possibility that completing one task differentially impacted on performance on the other. The entire battery was presented to children within a 12-month period (±3 months).
Results
WP-CMS scores (declarative memory)
The first set of analyses examined developmental changes in children's performance on the WP-CMS task. Summary data for the longitudinal and control group scores are presented in . The first analysis evaluated possible re-testing effects by comparing the performance of the longitudinal and control groups. This was achieved by comparing the Time 2 scores of the longitudinal group with those of the control group. shows that both groups obtained similar scores on this test. An independent samples t test indicated that this difference was not statistically significant, t(65) = .266, p = .791, r2 =.001. The effect size measure indicates that group membership (i.e., whether a child was tested once or twice within a 12-month period) accounted for <1% of the variance in the data. The next analysis examined differences in WP-CMS scores between Times 1 and 2. shows that scores increased at Time 2 compared to Time 1. A paired-samples t test indicated that this difference was statistically significant, t(39) = 3.966, p < .001, r2 = .16. Time of testing accounted for 16% of the variance.
Table II. Accuracy on the WP-CMS task
SRT data (procedural memory)
The next set of analyses examined children's performance on the SRT task. Although the primary dependent variable of interest from this task was RTs, it was necessary to examine accuracy first. This was to ensure that (a) accuracy at Time 2 was comparable to the control group, and (b) accuracy of button presses was comparable between Times 1 and 2. shows summary statistics for the overall proportion of correct responses for the longitudinal and control groups. Overall, the accuracy of both groups approached ceiling. The first analysis examined differences between the longitudinal group at Time 2 and the control group. Preliminary data screening indicated that the overall measure of accuracy was negatively skewed and an arcsine transformation was applied to the data. An independent samples t test indicated a significant difference between groups with respect to overall accuracy, t(65) = 2.575, p = .012, r2 = .075. The second analyses examined differences in accuracy within the longitudinal group over Times 1 and 2. An arcsine transformation was also applied to these data to correct for non-normality. A paired samples t test indicated a significant difference in accuracy between Times 1 and 2, t(39) = 3.612, p = .001, r2 = .104. Collectively, these results indicate subtle differences between the groups on the task. Given this it was necessary to control accuracy when analysing RT data.
Table III. Accuracy on the SRT task
Children's RTs from the SRT task were used to examine developmental trends in procedural memory. In analysing these data only RTs associated with correct responses were used. This was necessary in light of the previous analyses showing differences in accuracy between the groups and testing rounds. shows the mean RTs reported according to block and group. The first set of analyses evaluated whether the groups had implicitly learnt the sequence. As noted earlier, in SRT paradigms of procedural memory, learning has taken place if the RTs for the block with the random presentation of stimuli are longer than that for the final block with the repeating sequence. In this study this involved examining whether RTs in Block 5 were longer than for Block 4. It is noted that the data from Blocks 1–3 were not analysed because it is plausible that changes observed on these items may reflect increased proficiency in responding to the visual stimuli. To evaluate the effects of re-testing participants Time 2 data from the longitudinal and control groups were submitted to a 2 (Group: longitudinal, control) ×2 (Block: 4, 5) mixed design factorial ANOVA. This analysis indicated a significant main effect for Block, F(1,65) = 101.637, p < .001, hp2 = .610 (where hp2 = partial η2). The main effect for Group, F(1,65) = 2.463, p = .121, hp2 = .037, and the interaction between Group and Block, F(1,65) = 1.278, p = .262, hp2 = .019, were not found to be statistically significant. This analysis indicates a significant increase in RTs from Block 4 to Block 5 for the control and longitudinal group at Time 2. Moreover, the small effect size observed for the interaction term indicates that the increase in RT between blocks was comparable for both groups. The next analyses examined differences in Blocks 4 and 5 over Times 1 and 2 for the longitudinal group. These data were analysed with a 2 (Time: Time 1, Time 2) × 2 (Block: 4, 5) repeated measures ANOVA. This analysis indicated significant main effects for Block, F(1,39) = 60.839 p < .001, hp2 = .609, and Time, F(1,44) = 83.290, p < .001, hp2 = .681. The interaction between Block and Time was not statistically significant, F(1,39) = .236, p = .630, hp2 = .006. The significant main effect for Block along with the small effect size for the interaction terms indicates that at both Time 1 and Time 2 children were slower in Block 5 compared to Block 4.
Figure 2. Mean reaction times (RTs; ± SE) from the serial reaction time task at Times 1 and 2 reported according to Block and Group.
To evaluate whether age-related trends were present, the magnitude of difference in RTs between Block 5 and 4 were examined. This method for quantifying procedural learning has been previously used to investigate age-related differences with SRT tasks (Thomas et al., Citation2004). In the current study this was achieved by subtracting RTs in Block 4 from RTs in Block 5. According to this measure, the presence of age-related differences would mean that the magnitude of difference between Blocks 4 and 5 should differ between Times 1 and 2. At Time 1 the mean magnitude of difference was 103.35 (SD = 154.76, range = −166 to 506) and at Time 2, 117.24 (SD = 92.29, range = 57–317). An independent samples t test indicated that this difference was not statistically significant, t(39) = .486, p = .630, r2 = .003. In this analysis time of testing accounted for <1% of the variance.
Development of declarative and procedural memory
In the final analyses we compared the rate of change in performance on the measures of declarative and procedural memory. To undertake this comparison standardised regression coefficients (i.e., β weights) were computed using the WP-CMS scores and the difference in RTs between Blocks 4 and 5 from the SRT task across the two rounds of testing. For the measure of declarative memory, this was achieved by regressing WP-CMS scores at Time 1 on to scores at Time 2. For procedural memory, the difference in RTs between the fourth and fifth block at Times 1 and 2 was computed for each child. RTs from Time 1 were then regressed on to RTs from Time 2. The beta weights obtained from the regression analyses expresses change in standard deviation units.
Prior to computing beta weights it was necessary to ensure that both measures were of comparable reliability. This is because, as the reliability of a test or task decreases, the effect size measure also decreases as a consequence of measurement error (Baugh, Citation2002). Subsequently, if the reliability of one task is good and the other poor, it may give the impression of differences in task performance that do not exist (Chapman & Chapman, Citation1973). The reliability of the two memory measures was estimated using Cronbach's alpha and computed separately for data collected at Time 1 and Time 2. On the WP-CMS Cronbach's alpha at Time 1 was found to be .864, and at Time 2 it was .868. Cronbach's alpha for the SRT task was found to be .953 at Time 1, and .968 at Time 2. A higher reliability estimate for the SRT task can be expected because this task consists of a large number of items.
The equivalence of the reliability coefficients observed at Time 1 and 2 for the WP-CMS and SRT tasks was evaluated using the formula provided by Feldt (Citation1980), which has been implemented as a computer program by Lautenschlager (Citation1989). This formula tests whether there is a significant difference between reliability coefficients. At Time 1 the difference in reliability between the WP-CMS and SRT tasks was found to be statistically significant, χ(1) = 11.422, p < .001. At Time 2 a significant difference was also observed, χ(1) = 19.536, p < .001. Given the difference in coefficient values between WP-CMS and SRT tasks it was decided to correct observed betas for measurement error using the formula provided by Hunter and Schmidt (Citation1994). Because this formula requires only one coefficient per task or test, the midpoint between reliability values was calculated. The reliability estimate entered into the formula was the respective midpoint between coefficients at Times 1 and 2. For the WP-CMS task this was .866 and for the SRT task it was .961. Adjusted and unadjusted beta weights along with 95% confidence intervals are presented in .
Table IV. Standardised regression coefficients for WP-CMS and SRT tasks
shows that the beta for the WP-CMS task is larger in comparison to that for the SRT task. This indicates that a 1 SD increase in WP-CMS scores at Time 1 is associated with a 0.486 SD increase at Time 2. The increase in procedural memory functioning over this time period is smaller. Specifically, a 1 SD unit increase in Time 1 is associated with a .010 SD unit increase at Time 2. Significance tests for the differences in corrected beta coefficients indicated that the WP-CMS coefficients were significantly larger in comparison to coefficients from the SRT task (Z = 2.141, p < .032).
Discussion
This study investigated the development of declarative and procedural memory in typically developing children at the early stages of schooling. A significant increase was observed for the measure of declarative memory but not for procedural memory. Both findings are consistent with past research indicating developmental differences in the development of these two memory systems (e.g., Kramer et al., Citation1997; Meulemans et al., Citation1988). This view was further supported by comparing standardised regression coefficients. After adjusting for measurement error, scores from the measures of declarative memory were found to increase at a larger rate than procedural memory over a 12-month period. Collectively, these results suggest a relatively larger improvement in declarative memory functioning compared to procedural memory over the age span investigated in this study.
Children's scores on the measure of declarative memory were found to increase between testing sessions. In the first instance this result is interesting given that change was observed for this memory system even within a 12-month period. It is important to note that the improvement in scores on the declarative memory task does not appear to arise from the effects of re-testing the children. This claim is supported by the analyses comparing the performance of the control group to the longitudinal group at Time 2. In this analysis, whether a child was tested once or twice over a 12-month period accounted for <1% of variance in WP-CMS scores. At the same time a significant increase was observed in the longitudinal group between Times 1 and 2. In this analysis time of testing accounted for 16% of variance in the data, which in the Cohen (Citation1988) taxonomy corresponds to a large effect. The improvements in declarative memory functioning is consistent with a number of cross-sectional studies undertaken with children of comparable ages showing that performance on declarative memory task improves in childhood (Kramer et al., Citation1997).
At present, no studies known to us have examined procedural memory development using a longitudinal design. In this study procedural memory was evaluated by comparing RTs between the final two blocks on the SRT task. According to this approach an increase in RTs in the final block indicated that children had implicitly learnt the visual sequence. The analyses indicated that at Times 1 and 2, RTs in Block 5 (i.e., visual stimulus appeared randomly) were significantly slower than Block 4 (i.e., visual stimulus followed 10-item sequence). This result indicates that at both rounds of testing the children had implicitly learnt the sequence. With respect to developmental differences, the magnitude of the difference between the random and sequence block was comparable over the two rounds of testing. Collectively these data can be interpreted to suggest comparable performance in procedural memory at 5½ and 6½ years. These results are in agreement with cross-sectional studies of sequence learning in children (Meulemans et al., Citation1988) and are consistent with the argument that procedural memory matures relatively early in development and subsequently task-related improvements plateau at an earlier age in comparison to declarative memory (Reber, Citation1992).
One potential concern with inferences made about procedural memory from this study concerns re-testing participants twice within a 12-month period on the SRT task. It is possible that children may have retained some knowledge about the sequence at Time 1, which, in turn, influenced their performance at Time 2. This interpretation of the data is unlikely. First, research conducted with children (Meulemans et al., Citation1988) and adults (Nissen et al., Citation1989) has been undertaken to examine the effects of re-testing participants on SRT tasks within a 7-day period. Those studies demonstrated that measures of procedural memory neither improved nor deteriorated over this time period. Almost identical results were reported in this study, albeit with a longer time period separating testing sessions. Second, in this study it was found that the longitudinal group at Time 2 performed similarly on the task as the control group. Although the longitudinal group were marginally more accurate and faster on the task, a non-significant interaction and small effect size was observed between the groups with respect to RTs on the random block and final block with the repeating sequence. This suggests that both groups had learnt the visual sequence with equal proficiency.
If age-related differences are more likely to be observed on tests of declarative memory than procedural memory the findings of Thomas et al. (Citation2004), who reported differences between children and adults on an SRT task, need to be addressed. In their study the magnitude of difference between random and sequenced blocks for the adults was significantly larger in comparison to the children. The results reported by Thomas et al. are not necessarily inconsistent with those observed in the current study. It is important to note that the present results do not necessarily indicate an absence of development in procedural memory functioning. Rather, the rate of improvement in functioning of the procedural memory system appears slower in comparison to declarative memory. Subsequently, detecting developmental trends in procedural memory may require studying change in performance that is separated by a larger period of time. Another possibility is that the age-related differences reported by Thomas et al. (Citation2004) were influenced by the bimanual response required on their SRT task. In their study participants responded to the stimulus with fingers on both hands. Designing the task in this manner requires the corpus callosum, because information needs to be integrated from both hemispheres. The corpus callosum does not reach full maturity until adulthood (e.g., McLaughlin et al., Citation2007), therefore differences between children and adults observed by Thomas et al. may also reflect age-related differences with inter-hemispheric integration. In support of this view, De Guise and Lassonde (Citation2001) reported that older children were able to implicitly learn a sequence faster than younger children when participants made their responses with both hands. Differences between age groups, however, were not observed when responses were made with one hand.
The present results can be interpreted to provide further evidence for multiple memory systems (e.g., Squire, Citation2004), which develop at different rates in childhood (Meulemans et al., Citation1988). But it is important to recognise that the pattern of results observed in this study may reflect developments in other areas of cognitive functioning as well as their interactions. Developments in working memory demonstrate this point well. Gathercole (Citation1998) highlighted capacity increases in the short-term storage of auditory and visual information as well as central executive processes throughout childhood. Improvements in working memory functioning are likely to have implications for procedural and declarative memory. Research has been presented that shows an involvement of working memory in both paired associative learning (D'Arcy, Service, Connolly, & Hawco, Citation2005) and SRT tasks (Beldarrain, Grafman, Pascual-Leone, & Garcia-Monco, Citation1999). The relationship between working memory and other memory systems, however, is not equal. Foerde, Knowlton, and Poldrack (Citation2006) presented evidence showing that the neural structures that support declarative and procedural memory systems are both activated in the initial stages of learning. These findings were interpreted to suggest that both memory systems may compete in acquiring new information. Interestingly, a deactivation in declarative memory was observed following the introduction of a working memory task. This result was interpreted to suggest that declarative memory is more dependent upon working memory than is procedural memory. One implication of this result is that declarative memory may be more strongly related to developments in working memory capacity than procedural memory. In light of these studies developmental differences in declarative and procedural memory may reflect the net sum of simultaneous maturations of multiple memory systems and supporting neurological structures rather than isolated development specific in parts of the brain. Nevertheless, as was observed in this study, the end product of developments in multiple areas appears to lead to an early maturing procedural memory system and a later maturing declarative memory system.
Conclusion
This study examined the development of declarative and procedural memory in children. Unlike past research, the development of each memory system was studied longitudinally. The present results provided direct evidence to suggest that declarative and procedural memory systems follow different developmental trajectories. Specifically, whereas declarative memory undergoes development at between 5½ and 6½ years of age, no comparable maturation effects appear to be present for the procedural memory system. Collectively, these findings support the view of multiple memory systems that have different developmental trajectories.
Acknowledgements
This research was supported by grants from the British Academy to Evan Kidd and Jarrad Lum (SG-42144) and from the Nuffield Foundation (SGS/33866) to Evan Kidd.
References
- Anderson, V. A., and Lajoie, G., 1996. Developmental memory and learning skills in school-aged children: A neuropsychological perspective, Applied Neuropsychology 3/4 (1996), pp. 128–139.
- Bauer, P. J., 2007. Toward a neuro-developmental account of the development of declarative memory, Developmental Psychobiology 50 (2007), pp. 19–31.
- Baugh, F., 2002. Correcting effect sizes for score reliability: A reminder that measurement and substantative issues are linked inextricably, Educational and Psychological Measurement 62 (2002), pp. 254–263.
- Beldarrain, M. G. M., Grafman, J., Pascual-Leone, A., and Garcia-Monco, J. C., 1999. Procedural learning is impaired in patients with prefrontal lesions, Neurology 52 (1999), pp. 1853–1860.
- Chalmers, S. L., and Frederick, C. O., 1955. The relationship between Raven's Coloured Progressive Matrices and two tests of general intelligence, Journal of Clinical Psychology 11 (1955), pp. 84–85.
- Chapman, L. J., and Chapman, J. P., 1973. Problems in the measurement of cognitive deficit, Psychological Bulletin 79 (1973), pp. 380–385.
- Cohen, J., 1988. Statistical power analysis for the behavioural sciences. Hillsdale, NJ: L. Erlbaum Associates; 1988.
- Cohen, J., 1997. Children's memory scales. London: Psychological Corporation; 1997.
- Cohen, N. J., and Squire, L. R., 1980. Preserved learning and retention of pattern analyzing skill in amnesia: Dissociation of knowing how and knowing that, Science 210 (1980), pp. 207–209.
- D'Arcy, R. C. N., Service, E., Connolly, J. F., and Hawco, C. S., 2005. The influence of increased working memory load on semantic neural systems: A high-resolution event-related brain potential study, Cognitive Brain Research 22 (2005), pp. 177–191.
- De Guise, E., and Lassonde, M., 2001. Callosal contribution to procedural learning in children, Developmental Neuropsychology 19 (2001), pp. 253–272.
- Dunn, L., Dunn, L. M., Whetton, C., and Burley, J., 1997. British Picture Vocabulary Scale. Berks: nFER-Nelson; 1997.
- Feldt, L. S., 1980. A test of the hypothesis that Cronbach's alpha reliability coefficient is the same for two tests administered to the same sample, Psychometrika 45 (1980), pp. 99–105.
- Foerde, K., Knowlton, B., and Poldrack, R. A., 2006. Modulation of competing memory systems by distraction, Proceedings of the National Academy of Sciences 103 (2006), pp. 11 778–11 783.
- Gabrieli, J. D. E., 1998. Cognitive neuroscience of human memory, Annual Review of Psychology 49 (1998), pp. 87–115.
- Gathercole, S. E., 1998. The development of memory, Journal of Child Psychology and Psychiatry 39 (1998), pp. 3–27.
- Giedd, J. N., Blumenthal, J., Jeffries, N. O., Castellanos, F. X., Liu, H., and Zijdenbos, A., 1999. Brain development during childhood and adolescence: A longitudinal MRI study, Nature Neuroscience 2 (1999), pp. 861–863.
- Graf, P., and Schacter, D. L., 1987. Implicit and explicit memory for new associations in normal and amnesic patients, Journal of Experimental Psychology: Learning, Memory and Cognition 11 (1987), pp. 501–518.
- Hunter, J. E., and Schmidt, F. L., 1994. "Correcting for sources of artificial variation across studies". In: Cooper, H., and Hedge, L. V., eds. The handbook of research synthesis. New York: Russell Sage Foundation; 1994. pp. 323–336.
- Jackson, G. M., Jackson, S. R., Harrison, J., Henderson, L., and Kennard, C., 1995. Serial reaction time learning and Parkinson's disease: Evidence for a procedural learning deficit, Neuropsychologia 33 (1995), pp. 577–593.
- Jambaqué, I., Dellatolas, G., Fohlen, M., Bulteau, C., Watier, L., and Dorfmuller, G., 2007. Memory functions following surgery for temporal lobe epilepsy in children, Neuropsychologia 12 (2007), pp. 2850–2862.
- Kramer, J. H., Delis, D. C., Kaplan, E., O'Donnell, L., and Prifitera, A., 1997. Developmental sex differences in verbal learning, Neuropsychology 11 (1997), pp. 577–584.
- Lautenschlager, G. J., 1989. ALPHATST: Testing for differences in values of coefficient alpha, Applied Psychological Measurement 13 (1989), p. 284.
- Lenroot, R. K., and Giedd, J. N., 2006. Brain development in children and adolescents: Insights from anatomical magnetic resonance imaging, Neuroscience and Biobehavioral Reviews 30 (2006), pp. 718–729.
- Lum, J. A. G., Gelgec, C., and Conti-Ramsden, G., Procedural and declarative memory in children with specific language impairment, International Journal of Language & Communication Disorders.
- Mayberry, M., Taylor, M., and O'Brien-Malone, A., 1995. Implicit learning: Sensitive to age but not IQ, Australian Journal of Psychology 47 (1995), pp. 8–17.
- Mayes, A., Montaldi, D., and Migo, E., 2007. Associative memory and the medial temporal lobes, Trends in Cognitive Sciences 11 (2007), pp. 126–135.
- McLaughlin, N. C. R., Paul, R. H., Grieve, S. M., Williams, L. M., Laidlaw, D., and DiCarlo, M., 2007. Diffusion tensor imaging of the corpus callosum: A cross-sectional study across the lifespan, International Journal of Developmental Neuroscience 25 (2007), pp. 215–221.
- Meulemans, T., Van der Linden, M., and Perruchet, P., 1988. Implicit sequence learning in children, Journal of Experimental Child Psychology 69 (1988), pp. 199–221.
- Nissen, M. J., and Bullemer, P., 1987. Attentional requirements of learning: Evidence from performance measures, Cognitive Psychology 19 (1987), pp. 1–32.
- Nissen, M. J., Willingham, D., and Hartman, M., 1989. Explicit and implicit remembering: When is learning preserved in amnesia?, Neuropsychologia 27 (1989), pp. 341–352.
- Packard, M. G., and Knowlton, B. J., 2002. Learning and memory functions of the basal ganglia, Annual Review of Neuroscience 25 (2002), pp. 563–593.
- Raven, J., 1998. Raven's Progressive Matrices and Vocabulary Scales. London: Psychological Corporation; 1998.
- Reber, A. S., 1992. The cognitive unconscious: An evolutionary perspective, Consciousness and Cognition 1 (1992), pp. 93–133.
- Schacter, D., and Moscovitch, M., 1984. "Infants, amnesics, and dissociable memory systems". In: Moscovitch, M., ed. Advances in the study of communication and affect. New York: Plenum; 1984. pp. 173–216.
- Siegert, R. J., Taylor, K. D., Weatherall, M., and Abernethy, D. A., 2006. Is implicit sequence learning impaired in Parkinson's disease? A meta-analysis, Neuropsychology 20 (2006), pp. 490–495.
- Sowell, E. R., Thompson, P. M., and Toga, A. W., 2004. Mapping changes in the human cortex throughout the span of life, Neuroscientist 10 (2004), pp. 372–392.
- Squire, L. R., 2004. Memory systems of the brain: A brief history and current perspective, Neurobiology of Learning and Memory 82 (2004), pp. 171–177.
- Squire, L. R., Knowlton, B., and Musen, G., 1993. The structure and organization of memory, Annual Review of Psychology 44 (1993), pp. 453–495.
- Squire, L. R., Stark, C. E. L., and Clark, R., 2004. The medial temporal lobe, Annual Review of Neuroscience 27 (2004), pp. 279–306.
- Squire, L. R., and Zola, S. M., 1996. Structure and function of declarative and nondeclarative memory systems, Proceedings of the National Academy of Sciences 93 (1996), pp. 13 515–13 522.
- Thomas, K. M., Hunt, R. H., Vizueta, N., Sommer, T., Durston, S., and Yang, Y., 2004. Evidence of developmental differences in implicit sequence learning: An fMRI study of children and adults, Journal of Cognitive Neuroscience 16 (2004), pp. 1339–1351.
- Thomas, K. M., and Nelson, C. A., 2001. Serial reaction time learning in preschool- and school-age children, Journal of Experimental Child Psychology 79 (2001), pp. 364–387.
- Vinter, A., and Perruchet, P., 2000. Implicit learning in children is not related to age: Evidence from drawing behavior, Child Development 71 (2000), pp. 1223–1240.