
 ?Mathematical formulae have been encoded as MathML and are displayed in this HTML version using MathJax in order to improve their display. Uncheck the box to turn MathJax off. This feature requires Javascript. Click on a formula to zoom.
Abstract
The design and tuning of controllers for the industrial process is an art, which plays a vital role in many of the process control industries. The industries such as sugar, chemical, paper and other process control-based industries hold the nature of non-linearity due to their uneven distribution of load influence with disturbances. This paper highlights the study and investigation of different controlling parameters associated with the sugar industry which is located in the southern region of Tamil Nadu, India. After the analysis of various processes, the impact of controlling strategy needs to be implemented in an advanced way to minimize the resource utilization with high productivity. The behaviour of various process parameters, such as flow, temperature, level, pressure, is studied and one of these has been discussed in detail along with the controller design. The controller, such as proportional, integral, derivative, has been modified with advanced control phenomena and applied to process model with the presence of delay time provides the excellent tracking of operating point to bring the stability of a certain process in a tremendous manner.
1. Introduction
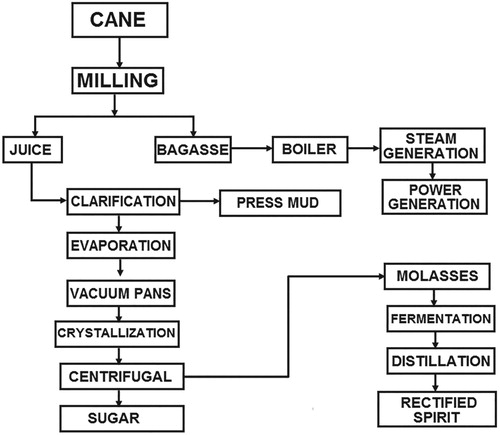
There are nearly more than 400 sugar industries are available in India. The states in India that mainly contribute in sugar production are Tamil Nadu, Andhra Pradesh, Gujarat, etc. According to the survey of U.S. department of Agriculture, India stands second place in the production of sugar. Sugar industry process is the combination of huge control loops, cascade as well as multiloops and variable inputs to the system. It requires continues monitoring and control of non-linear process parameters such as level, flow, pressure, temperature, etc., to ensure the process stability, labour safety with improving production rate. The process structure or process model is analysing the variables such as input, output and other constraints. The alternate method of process model identification will be based on the nature of the system parameters. i.e. height, radius and other system-dependent constraints. The modelling techniques for various linear and linear processes are dealt with in an extraordinary way by Bequette [Citation1]. The flow chart of the sugar industry process is shown in Figure . All the units have its individual control loop architecture to have connectivity for its previous and next process unit. The sugar production starts from the extraction of cane juice from sugar cane in various stages at the sugar mill. The efficient extraction of cane juice ensures the rate of sugar production and minimizes the demand of sugar cane. Turker ozkocak and Minyue fu have developed a mathematical model along with a predictive controller for juice extraction [Citation2]. The white sugar is normally used in house as well as food production. The size of the sugar particle is usually in mm and the final stage of the sugar production process is called as crystallization. J. Michal and M. Kminek derived an expert system with the process model and it was proved versatile [Citation3]. Even though some advanced controlling technologies have been employed in industries, the fault occurrence is one of the unavoidable issue. Silvio simani has undergone the study of fault diagnosis at sugar cane crushing unit and published an article using the fuzzy model [Citation4]. The control of pH value in the chemical process becomes very complex and a challenging task to maintain in a steady-state condition. In the sugar industry, pH neutralization is an important criterion to yield the product with good quality. O. Elfatni et T. Bounahmidi conducted an experiment by determining the mathematical model for the acidification process on sugar extraction [Citation5]. In the industrial process, the occurrence of delay in run-time process has never been eliminated at any controller action. Julio E. Normey-Rico and Alejandro Merino proposed a compensation technique with robust control in the evaporation process [Citation6]. Astrom K. J. and T. Hagglund have developed a method of tuning PID controller with fuzzy rules for the interacting process [Citation7].
Figure 1. Flowchart of sugar industry process.
2. Problem identification
The important task in sugar industry process is the control of process parameter at the right time. According to this investigation at the sugar industry if any engineer fails to notice some important issues or an abnormal condition in process that affects the entire process cycle since all the processes are sequential.
3. Process study
From Table , it is clear that we need to bring our industrial process controlling technique with advance control tuning. The cane juice extraction process has been taken for case study. The schematic diagram of crushing process is shown in Figure . The purpose of this process is to maximum the extraction of cane juice from sugar cane to produce sugar. This process is an example of a cascade-type control system; they are cane feeder, crushing mill and raw juice tank. The initial stage of the crushing process is to unload the cane from truck and to load in a cane feeder. It consists of four sequence processes such as chopper (C), leveller (L), pusher (P) and fibriser (F).
Figure 2. Schematic diagram for sugar cane crushing process.
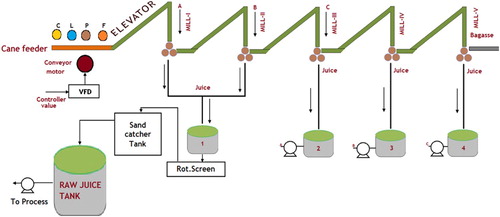
Table 1. Few identified issue as major drawback of sugar industry if the controller are failure to control the certain process parameter.
The four different operations are the primary processes in a sugar mill. In chopper, sugar canes are cut into small pieces by using its knife-based arrangements. The cutted pieces are regulated through the leveller and by applying high pressure with the aid of a pusher. The outer hard portion of sugar cane is removed by treating it with a fibriser. Finally, the sugar cane is fed to the mill through an elevator from the fibriser. Five sets of mills are consequently connected together and each mill consists of three to six rollers made up of heavy iron with high pressure. The cane juice from mills 1 and 2 is collected in tank-1 whereas the juice from mills 3,4 and 5 is collected in their corresponding juice storage tank and it will be recycled, as shown in the schematic diagram, using a pump. The juice from tank-1 is sent to a raw juice tank incorporated with a rotary screen and a sand catcher tank for purifying the cane juice. In the cascade process, the role of controller is to maintain the raw juice tank in optimum level by varying the cane feeder or conveyor motor speed using variable frequency drive.
3.1. Need of raw juice tank-level control
The raw juice tank is connected with a raw juice feed pump and it will be connected to further processes such as clarification and evaporation. Figure demonstrates the data acquisition process through a level transmitter. The output of level transmitter is in the range 4–20 mA and this will be calibrated as tank level from 0% to 100% by the data acquisition system. The actual height of the tank is 4 m and its radius is 3 m. The controller has a reference set point and it has to be compared with the transmitter output. Sensors are playing the major role for data acquisition with many check points.
The primary objective of controller is to drive the cane carrier or conveyor motor at an optimum speed and this will be discussed briefly in the controller design session. Table represents the theoretical calibration of level and speed, but in practice, the value may get differ slightly (Figure ).
Figure 3. Data acquisition system of raw juice tank.
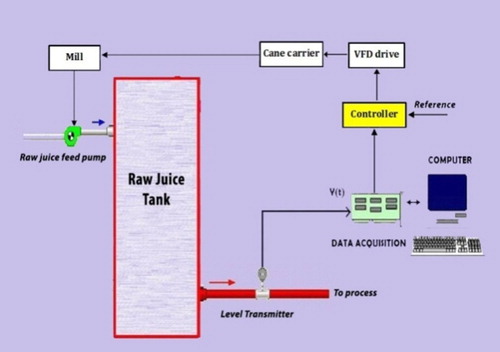
Table 2. Level and speed calibration.
4. Controller design
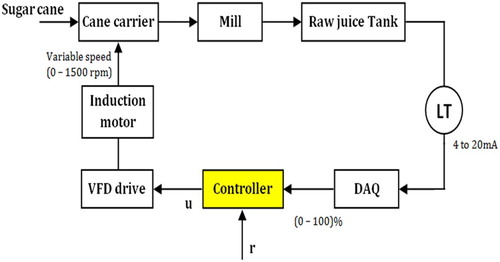
Controllers act as the backbone of process control and automation-based industries. PID controllers are the only controllers where industries are often used because of their robustness and easy accessibility. It is required to develop new controller schemes to enhance the process performance and in this paper, we investigate on the process characteristics with controller design. The various observations have been taken based on the simulation results and summarized in the following sections. Non-linear systems are highly occupied in chemical industries, process control industries such as sugar plant, paper plant and cement plant. The important criterion in controller design is tuning of gain parameters. Tuning is an art of any controller implementation process and a few popular tuning methods for PID controllers are certain methods like Ziegler Nichols tuning method, Cohen-Coon method and reaction curve method. K. J. Astrom and T. Hagglund et al. clearly explained the basic characteristics of PID controller and its compatibility with different controlling issues [Citation8]. T. Balasubramanian and N. Anandaraman exclusively designed the same controller for FOPDT and implemented successfully. The same controller has been modified using fuzzy logic i.e. a knowledge-based controller also gives better control and both simulation and real-time results were compared [Citation9]. One of the critical tasks in petroleum separation process is to isolate the oil and gas due to its complex mixing and structure of molecule [Citation10]. The controller requires an advanced or intelligent system to yield the product with maximum quality. R. F. Liao et al propose an intelligent control system to constitute a knowledge-based system i.e. fuzzy logic controller to the petroleum separation process. It was implemented in real time and performed well. The closed loop structure for level control is shown in Figure and it was clearly explained in the previous session. The mathematical model for the above process was determined using system identification. The obtained model is second-order plus delay time (SOPDT).
(1)
(1) From Figure , it is required to choose the controller adopt to this process and its design procedure will be continued in the following session.
Figure 4. Closed loop system for tank-level control.
4.1. PID controller design
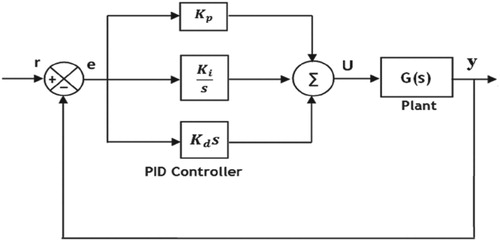
The PID controller is a combination of proportional, integral and derivative controller, which is widely employed in most of the industrial control applications because of its simplicity. Most of the closed loop-based industrial process is controlled only with the help of PID controllers here (r) is the reference input signal and (e) shows the tracking error corresponding to the feedback signal (y) where the controller action is based on the tracking error signal. Kp is Proportional gain, Ki is Integral gain, Kd is Derivative gain, U is controller output and G(S) is plant model. Among the traditional tuning methods for PID controllers in control theories, Ziegler Nichols tuning method, one of the conventional controllers, is widely used in industrial PID tuning.
The controller equation of PID controller is generally expressed as follows.
(2)
(2) The signal from the controller (u) fed to the plant comprises the gains of proportional, integral and derivative mode. It can be expressed as
(3)
(3) The gain values are obtained based on one of the Ziegler Nichols where without integral and derivative action slowly raise the proportional gain value till getting the sustained oscillations. The value at which the sustained value is denoted as Kcr (Kp = Kcr) and Pcr denotes the time required for the period of oscillation. The methods of calculating PID controller gain parameters are tabulated below.
With respect to the sustained oscillations obtained the tuning rule Proportional gain (Kp) = 0.147, Integral gain (Ki) = 5.265 and Derivative gain (Kd) = 1.316. The transient response of PID controller is shortlisted from Figures and and its performance analysis has been discussed using transient response characteristics in result and discussion (Figure ).
Figure 5. Closed loop system with PID controller.
4.2. Fuzzy-PID controller
Even though our conventional controller shows a better response, the time domain characteristics are not in a satisfactory level. The response exhibits more rise time, settling time with peak overshoot. In order to improve the system performance criteria, the conventional controller should be driven by the knowledge-based logical system. The various approaches like Neural network, fuzzy logic controller and optimization techniques have to be invoked for designing intelligent controllers. Among that fuzzy logic controller is a knowledge-based rule base system which is coupled with the PID controller to make a hybrid control system called Fuzzy-PID controller, as shown in Figure .
Figure 6. Closed loop system with fuzzy – PID controller.
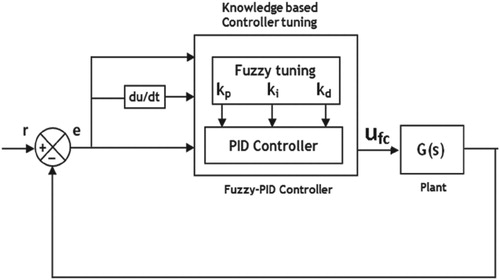
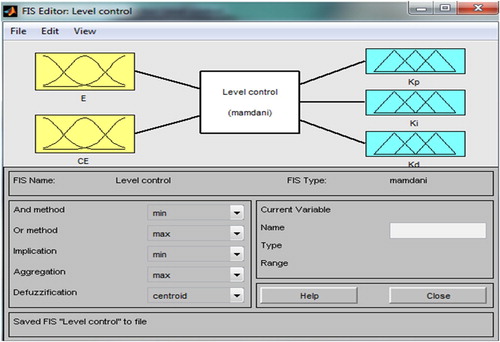
This kind of hybrid system is designed with error feedback and it will ensure the system to reach an operating point in less time and reduce overshoot during any external disturbance. The four main steps of the fuzzy logic controller are Fuzzification, Fuzzy Inference System with the knowledge base and Defuzzification. Fuzzification is the process of converting the physical variables into fuzzy variables with appropriate membership functions. Fuzzy rules such as IF … THEN rules are designed in the inference system along with knowledge base. Finally, the fuzzy variables are converted into real-world physical variables using defuzzification. The design of fuzzy controller involves two inputs and three outputs of mamdani-type fuzzy inference system, as shown in Figure . The two inputs are error e and change in error Δe whereas the three outputs are kp, kp and kd.
Figure 7. Two input and three output mamdani-type FIS editor.
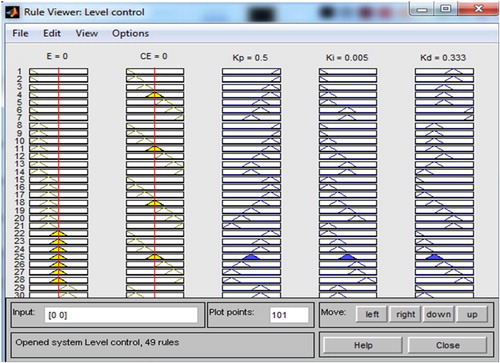
The input (e and Δe) and output (kp, ki, kd) are normalized into the interval [−1,1] and [0.1], respectively. The fuzzy sets are constructed using linguistic labels “Negative Large” (NL), “Negative Medium” (NM), “Negative Small” (NS), “Zero” (ZO), “Positive Large” (PL), “Positive Medium” (PM), “Positive Small” (PS). Figure (a)–(c). shows the surface viewer generates based on 40 nine rules created for both error and change in error. Figure shows the rule viewer that provides information of rules execution during the simulation. The response of Fuzzy-PID controller is shown in Figures and . It has been observed that when compared to conventional controller proposed controller reduces the overshoot with minimum settling time.
Figure 8. a. Surface view of the output kp b. Surface view of the output ki. c. Surface view of the output kd.
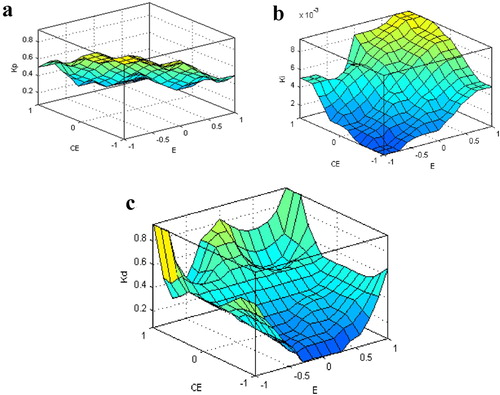
Figure 9. Rule viewer of the output kp, ki and kd.
5. Result and discussion
As of the analysis on process control variable and controller design from sugar industry process, the entire controller design is based on process nature may be linear or non-linear and its controller variable. PID controllers are providing efficient control in most of the industries. Many authors have investigated the characteristics of various industrial processes and provided the solutions for better improvement in a certain process.
Several research studies are carried out in the area of process control and few of them have been discussed in controller design and even though the controller is the same, it was applied to various real-time applications. This paper describes how the controller reacts for the author’s application considered in the sugar industry. Among the various non-linear process available in the sugar industry, the raw juice tank-level control process is selected because of complex cascade systems associated with it. The PI, PID, Fuzzy-PID controller are developed in the SOPDT system and its transient response characteristics have been given in Table . When compared with my result and other cited research article the choice of controller depends on the application and not based on our choice.
Table 3. Controller design based on sustained oscillations.
As shown in Table , PI controller provides better controlling compared to PID type. The settling time is not finite with the derivative controller and it shows continuous oscillations, as shown in Figure and the response curve, as shown in Figure , proves that proportionality with integral action exclusively gives good control stability with process delay. Since the process is non-linear and an industrial application, the controller should react with every set point change. Fortunately for this process, my tuning parameter has given tremendous response for every change in set point, as shown in Figure . To improve the process performance, the fuzzy controller has been designed and its responses exhibit with less sustained oscillations and reduced settling time, as shown in Figures and , respectively (Table ).
Figure 10. Response of PID controller.
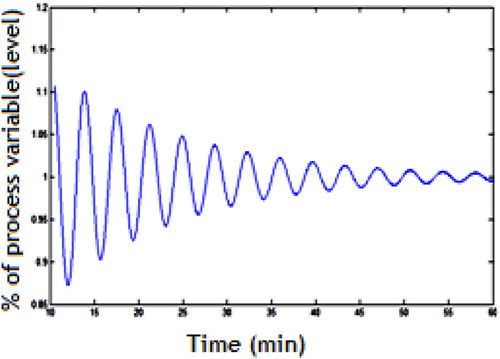
Figure 11. Response of PI controller.
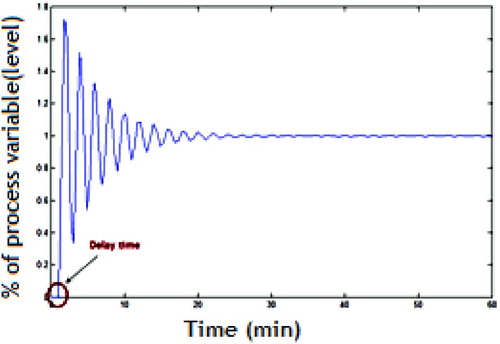
Figure 12. Servo response of PI controller with set point tracking.
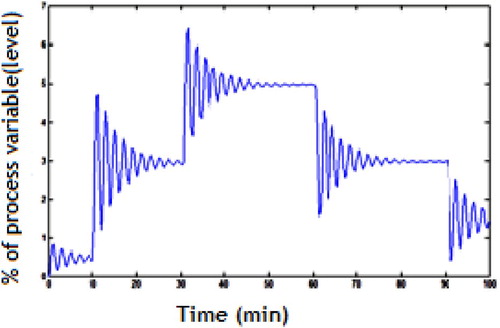
Figure 13. Response of Fuzzy-PID controller
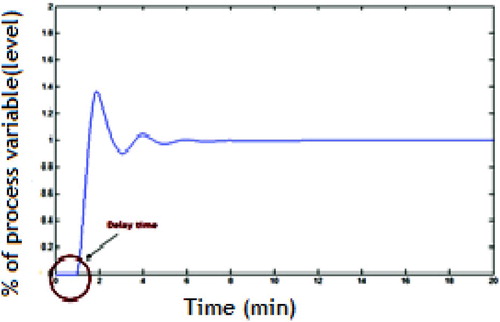
Figure 14. Servo response of Fuzzy-PID controller with an operating point tracking system.
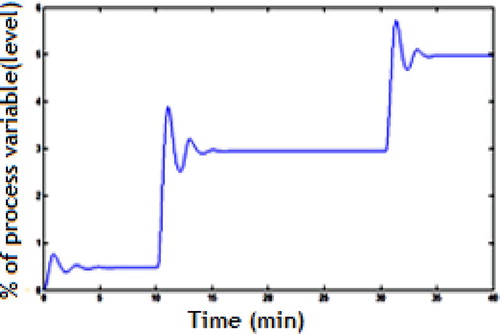
Table 4. Controller performance analysis based on transient response.
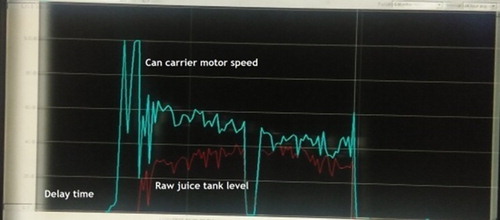
Research works prove that the real-time output through SCADA and the proposed controller gain parameters are almost close to the actual controller plant. It shows that the proposed PI controller has given 70% better result in real time and the following figure has been taken by a trial test (Table ).
Table 5. Level and cane carrier speed.
The level and cane carrier motor speed are varying with a control action, when the level decreases immediately, carrier motor speed increases to raise the tank level and vice versa. Few experimental values for different level and speed are tabulated.
6. Conclusion and future work
Research works designed and implemented PI, PID controller to enhance the performance of controller and tracking provision under various operating points with delay time and its output has been shown in Figure . The research works identified that controller performance need to be equipped well and to overcome those controller demerits a fuzzy-PID controller is designed to tune the gain parameters on knowledge base with respect to error and change in error with delay and its response is shown in Figures and , respectively. Added to that researcher deals with the investigations of issues and fault occurrence in the sugar industry which may affect the process performance in various aspects. The proposed controller may not give better response all time and it is required to use sophisticated techniques for further excellent process controlling strategy. The undergoing and future assessment related to problem statement as discussed in the problem identification session, new approaches like fault optimization, hybrid controller design, prototype model design are under progress.
Figure 15. Real-time controller response with the proposed PID controller gain values.
Acknowledgement
The authors would like to acknowledge the unit head of sugar industry which is located in the southern part of Tamil Nadu, India for their kind support and provision for data access to develop the plant model and controller design.
Disclosure statement
No potential conflict of interest was reported by the authors.
References
- Bequette BW. Process control: modeling, design, and simulation. New York: Prentice Hall; 1998.
- Ozkocak Turker, Minyue Fu, Graham C. Goodwin. Maceration control of a sugar cane crushing mill. In: Proceedings of the American Control Conference; Chicago, Illiois; 2000. p. 2255–2259.
- Michal J, Kminek M, Kminek P. Expert control of vacuum pan crystallization. IEEE Control Syst. 1994;14(5):28–34. doi: 10.1109/37.320884
- Simani S. Fuzzy model identification of a sugar cane crushing process for fault diagnosis application. In: Proceedings of the 44th IEEE Conference on Decision and Control, and the European Control Conference, Seville, Spain; 2005. p. 2053–2057.
- Elfatni O, Bounahmidi T. Mathematical modeling and simulation of acidification process for sugar extraction. Computational Engineering in Systems Applications; IMACS Multiconference; 2006 Oct 4–6. p. 1202–1208.
- Normey-Rico JE, Merino A, Cristea S, et al. Robust dead-time compensation of a evaporation process in sugar production. Prague: Elsevier, IFAC; 2005.
- Astrom KJ, Hagglund T. PID controllers, theory, design and tuning. 2nd ed. Instrument Society of America; 1995.
- Astrom KJ, Hagglund T. The future of PID control. Control Eng Pract. 2001;9:1163–1175. doi: 10.1016/S0967-0661(01)00062-4
- Balasubramanian T, Anandaraman N. Design of intelligent controllers for nonlinear processes. Asian J Appl Sci. 2008;1:33–45. doi: 10.3923/ajaps.2008.33.45
- Liao RF, Chan CW, Hromek J, et al. Fuzzy logic control for a petroleum separation process. Eng Appl Artif Intell. 2008;21:835–845. doi: 10.1016/j.engappai.2007.09.006