
 ?Mathematical formulae have been encoded as MathML and are displayed in this HTML version using MathJax in order to improve their display. Uncheck the box to turn MathJax off. This feature requires Javascript. Click on a formula to zoom.
Abstract
Graduate students are unaware of their final qualification for a course. Even though there were many models available, few works with feature selection and prediction with no control over the number of features to be used. As a result of the lack of an improved performance forecasting system, students are only qualified on the second or third attempt. A warning system in place could help the students reduce their arrear count. All students undertaking higher education should obtain the qualification at their desired level of education without delay to transit to their careers on time. Therefore, there should be a predictive system for students to warn during the course work period and guide them to qualify in a first attempt itself. Although so many factors were present that affected the qualifying score, here proposed a feature selection technique that selects a minimal number of well-playing features. Also proposed a model Supervised Learning Approach to unfold Student’s Academic Future Progression through Supervised Learning Approach for Student’s Academic Future Progression (SLASAFP) algorithm that recommends the best fitting machine learning algorithm based on the features dynamically. It has proven with comparable predictive accuracy.
1. Introduction
Current eras of students in higher education are lethargic in appearing for exams as well as in maintaining the minimum marks required to get qualified for the entire course. According to NEP2020, all graduate students should be qualified at the desired educational level. Until the students received the unqualified grade, they did not know their actual academic status [Citation1–5]. Even if the oral instructions are given to the students, they are all ignored in a very brief time. At the time they realize and work on it, they can be skilled only in a second or another attempt which also affects the percentage of institutional success.
In the higher education framework, the course duration is planned for six months. Each subject has three continuous assessment tests and three internal assignments internally and one external exam which should be attempted by each student to complete the course. The qualification of that semester will be only known after all these assessments. It is reactive to write the supplement exam to clear the arrear in the same subject in next semester parallel. The contribution here is an algorithm is proposed to predict the result of each student in each subject immediately after the completion of the second continuous assessment. It helps the mentors to provide the required support and train the student to get qualified. The alert can be triggered in the student learning system to increase the importance of the prediction and the immediate action to be taken with minimal parameters into consideration. Even though there are a large number of parameters and prediction algorithms, either a filter or a wrapper strategy was applied in various works. Both the methods have their benefit. To achieve the advantages of both the methods in a single technique, the operating principles of the filter and wrapper strategies are merged in the proposed model and the advantages of both techniques where the constraint is features should be minimum and effective. The highly relevant features were chosen as a new feature set for training and testing multiple machine learning algorithms in this way. Even though the parameter list and prediction performance determine the strategy to be finalized, supervised machine learning algorithms are broad. The ensemble model is a high-performing prediction technique that produces a large amount of prediction output [Citation6]. The accuracy of prediction is determined by the parameters used in algorithm execution [Citation7]. This research focuses on assisting students in improving their academic performance throughout the course, with performance forecasts provided each semester via their monitoring system aiming for all students to pass on their first attempt. This research specifically addresses the following issues:
Is it possible to identify the smallest number of significant factors influencing a student's academic performance?
Is there any algorithm that can anticipate the outcome using these few features?
In this study, a new hybrid methodology was devised and executed to identify significant components that can more accurately predict the output factor [Citation8]. Finally, it distinguishes itself from other relevant studies in the field of forecasting a student's future academic success by selecting the best supervising model for the prediction system automatically.
2. Background and related works
There is a wide spectrum of EDM-related work available, with many new methodologies and tools aimed at achieving the goals of discovering knowledge, making decisions, and generating recommendations. Below are some of them that served as an information source for the research. There are several machine learning algorithms used in student performance prediction such as DT, SVM, KNN, NB, LR, LDA, and CART.
2.1. Prediction based on the result
2.1.1. Predicting success modelling
The actual grade or marks is challenging due to a range of factors such as demographics, educational background, personal, psychological, academic growth, and other environmental variables. Performance classification is becoming more popular among researchers as the links between many of these characteristics remain unexplained. The authors in [Citation9,Citation10] said that it's understandable that if there were fewer target classes, making a prediction would be easier. The authors in [Citation11] say that many researchers have tried to categorize student performance using binary terms like pass-fail, below and above a reference level, good-poor, and so on.
2.1.2. Predicting grade or marks
As previously mentioned, some studies have even attempted to anticipate physical markings. The authors of [Citation12,Citation13] say that current research has employed both regression and classification strategies to achieve this goal. Internal assessment data is used by the majority of them to estimate grades marks over the course's duration. With 93.46 percent precision and 75.79 percent recall, the author predicted pass/fail class with over 90% accuracy within the first 10 weeks of student engagement in a virtual learning environment (VLE). In references [Citation9,Citation14,Citation15], the author found that before the commencement of the course, it was attempted to forecast the final grade or marks. However, they are not as effective as the previous one. The number of research aiming to predict actual grades or score is substantially lower than the success prediction cases. In an early stage of the student's academic route, the author provided a model that predicted the student's performance level with an accuracy of over 95%.
2.2. Prediction based on various techniques and algorithms
Decision trees and learning analytics principles are used to predict student performance. The prediction value is calculated using regression and correlation algorithms as the authors work in [Citation1]. In reference [Citation2], the author used the student log data from the department of mathematics and computer science in Nigeria is considered, including class test scores, lab work, and assignments completed, as well as class attendance. With 239 classifying samples, Decision Tree techniques are utilized to predict. The approaches for evaluating the features provided include gain ratio and information gain.
The authors in [Citation16] used seven algorithms to predict student performance at the University of Bangladesh, including SVM, KNN, NB, LR, DT, Adaboost, and extended classifiers. The weighted voting classifier performed the best, with an accuracy of 81.73 percent. Deep learning algorithms such as CNN have been used to investigate the prediction of students’ achievements, which has aided in the completion of degrees. The proposed model outperformed the approaches that predicted the most accurately. The authors in [Citation17] explain that internal and socioeconomic characteristics were used to predict student performance using multiple machine learning models. When those models were applied to this dataset, they outperformed the experiment. The author in [Citation18] used eighteen trials on two datasets with five machine learning methods to help classify and predict student performance in this research [Citation19]. The educational dataset for high school for the year 2015 is used in this article. Two significant classification and prediction algorithms, KNN and NB, are used, with NB outperforming KNN and achieving 93.6 per cent accuracy.
A study was published in [Citation20–23] to predict the performance of students in secondary school in Tuzla. On a dataset with 19 features, the Gain Ratio (GR) feature selection approach was utilized. In terms of prediction accuracy, the Random Forest classification (RF) method yields the best results.
The authors in [Citation24] used a dataset from the University of Minho in Portugal, where 395 samples were available to predict students’ academic success using support vector machines and KNN. The correlation coefficient performance metrics of both algorithms are compared, and it is discovered that SVM performs marginally better than KNN by the authors in [Citation25]. The author in [Citation26] used machine learning algorithms to collect data from a technology-enhanced learning system called the digital electronics education and design suite. On the input variables of average time, the total number of activities, average idle time, the average number of keystrokes, and total related activity for each workout during individual sessions, several algorithms such as NB used by authors in [Citation27,Citation28], logistic regression, ANN, SVM, and decision trees in [Citation29]. The authors in [Citation30] used ANN and SVM fared well in predicting students’ grades using K-fold cross-validation and root mean square error and can be implemented into their own technology-enhanced learning system.
3. Dataset
The dataset used in this scenario is a real-time dataset of postgraduate students undergoing the Indian higher education system. It has been collected from a reputed engineering college in Tamil Nadu with a student population of 4000 and 500 samples were used as input in this study as in Table . As it implies in [Citation22], the prediction of student performance by modelling small dataset size could be effective. It is proposed that there is a high possibility of identifying the key indicators in the small dataset using multiple machine learning algorithms to evaluate them for the most accurate model for the prediction of student performance. Name, register number, email id, date of birth, gender, course name, course code, high school score, higher secondary score, undergraduate specialization, undergraduate overall score, entrance exam score, continuous assessment test 1, final grade considered were the input variables, which were collected and stored in a CSV(comma-separated value) file. A PG course's educational approach entails calculating marks based on the sum of three internal assessments and assignments (50 percent) and one external test (50 percent). As a result, the existing approach identifies slow learners at the end of the semester, which is very late. Proactively, if a student is expected to be unqualified after the first internal assessment, that student might be offered interventions and extra caution while writing subsequent internal and external exams.
Table 1. List of variables collected for dataset.
3.1. Data pre-processing
As this is a real-time, this phase is completed after the data has been obtained from students to ensure its correctness. Variables such as Name, register number, email id is removed from the analysis. This data set for the research work contains both categorical and numerical values as in Table . The dataset's missing values were validated and filled using statistical imputation of each column's mean value, and it was then normalized using a one-hot encoding approach in Python. Duplicate values were deleted so that a particular data object does not gain an advantage or bias.
Table 2. Detailed statistics of the dataset used.
3.2. Working setup of model
The student academic dataset was first considered for pre-processing and once the dataset was ensured for its correctness and unbiased nature, then the feature selection was followed. In the feature selection phase, a new feature selection technique was proposed to find the efficient features which are of minimal in the count. Now the new dataset was generated for the model selection with the selected features. In the updated dataset, 70% of data was considered for training randomly and 30% was considered for testing the model. The training data was trained through seven machine learning algorithms such as decision trees, logistic regression, linear discriminant analysis, k-nearest neighbour, support vector machine, classification and regression trees and random forest. The various evaluation factors for each model was computed such as accuracy, kappa, f1-measure, recall and precision. The best performing model was selected and the test samples were given as input for the prediction process. Finally, the result of the student was whether as success or not based on which interventions could be provided.
The following section provides a set of rules for applying educational data mining tools for student success prediction; all decisions that must be made at various phases of the process are discussed, along with a shortlist of best practices culled from the literature. The framework that has been proposed has been derived from well-known processes. It consists of six main stages: (1) data collection, (2) data preprocessing, (3) Feature selection, (4) prediction algorithm implementation and (5) result evaluation.
4. Methodology
Machine learning is the science with various methods of retrieving the result on test data by training the machines on train data. There are various learning approaches in machine learning where the supervised learning approach is chosen as it mostly depends on the various academic factors of students to predict the result whether getting qualified or not. There are various supervised machine learning algorithms such as logistic regression, support vector machine, naive bayes, K-nearest neighbour [Citation8,Citation31], decision tree [Citation32], random forest [Citation33], linear discriminant analysis [Citation34], and classification and regression technique and so on.
Logistic Regression (LR) is a regression which well suited when the resultant is binary [Citation35]. There are various student’s academic factors involved in predicting the final grade of the student whether qualified or disqualified. In logistic regression, we generally calculate the probability which lies between the interval 0 and 1 (including both). Determining the cut-off value is a very important aspect of logistical regression and depends on the classification problem itself.
Support vector machine (SVM) algorithm is the conventional model used where it forms a hyper plane to find the two-class categories for the resultant. The purpose of the support vector machine algorithm is to find a hyper plane in N-dimensional space (N – the number of features) that distinctly classifies the data points [Citation36]. SVM is used in various experimental studies and has come up with a good result in small datasets to predict student performance [Citation37]. SVM with the combination of neural networks and various other technologies has demonstrated to predict student performance with a good level of accuracy [Citation38].
Linear discriminant analysis (LDA) is a linear classification technique that helps in finding the discriminance over two classes. Compute the within the class and between class scatter matrices, the eigenvectors and corresponding Eigenvalues for the scatter matrices, Sort the Eigenvalues and select the top k. Create a new matrix containing eigenvectors that map to the k Eigenvalues and obtain the new by taking the dot product of the data and the matrix again [Citation39].
K-Nearest Neighbour (KNN) is one of the simplest algorithms that work on regression and classification based on similarity points [Citation36]. Classification and regression Technique [Citation40,Citation41] works on both the value to be predicted and the class to which it belongs. Naive bayes is not a single algorithm where it is a collection of classifiers based on the bayes theorem.
The classification and regression tree(CART) algorithm is structured as a sequence of questions and the answers to which determine what the next question if any should be and ends when there is no question is present [Citation42]. 6 relevant attributes have been selected considering the academic performance such as grade, test, quiz, project, psychomotor skill and final exam mark. CART was analyzed on the numerical and categorized attributes. Results show that for this subject, students need to score more than half per cent from the final [Citation43].
Naive Bayes (NB) is a machine learning model that is used for big amounts of data. It is recommended that it be utilized if the dataset has millions of records. It's a simple and quick categorization algorithm. When NB is applied to the academic, behaviour, and extra features of the student data set, the accuracy was found to be around 75% which is determined to be superior to that of other current techniques [Citation44].
A Random Forest (RF) is a machine learning technique for solving classification and regression problems. It makes use of ensemble learning, which is a technique for solving complicated problems by combining several classifiers. Many decision trees make up a random forest algorithm. Bagging or bootstrap aggregation are used to train the “forest” formed by the random forest method.
Feature selection is the process of selecting or filtering significant features from all available features in a dataset using various methods such as filter and wrapper methods. In filter methods such as the feature importance method, the attributes are chosen based on how well they correlate with the outcome variable in various statistical analyses. In wrapper methods such as the recursive elimination technique, it is aimed to employ a subset of features and train a model with them. This approach is frequently quite time-consuming to compute. Wrapper approaches test the utility of a subset of features by actually training a model on it, whereas filter methods measure the importance of features by their correlation with the dependent variable. Filter techniques are much faster than wrapper methods since they do not require the models to be trained. Wrapper approaches, on the other hand, are computationally expensive as well.
Principal Component Analysis (PCA) is a statistical process that turns a set of correlated variables into a set of uncorrelated variables using an orthogonal transformation. In exploratory data analysis and machine learning for predictive models, PCA is the most extensively used tool. PCA is also an unsupervised statistical tool for examining the interrelationships between a set of variables. Regression determines a line of best fit, which is also known as generic factor analysis.
Univariate Feature Selection is a feature selection strategy that employs statistical methods to identify the most important features in a prediction issue. It finds the highest-scoring feature by removing the least important characteristics from the current set.
Recursive Feature Elimination is a strategy that looks at all of the input features and finds features for elimination iteratively. The importance of the feature that has the greatest impact on the target variable is determined by the order in which it is removed.
The feature Importance method assigns a score to input features depending on how valuable they are at predicting a target variable. Statistical correlation scores, coefficients generated as part of linear models, decision trees, and permutation importance scores are some of the most common types and sources of feature importance scores.
4.1. Proposed algorithm – SLASAFP
In this paper, the new technique is proposed in two stages such as feature selection and model selection. The proposed feature selection method is detailed in section 4.1.1 and the proposed model selection is detailed in section 4.1.2.
4.1.1. Feature selection
In this study, a new hybrid methodology was devised and executed to identify significant components that can more accurately predict the output factor with the benefit of both filter and wrapper techniques [Citation8,Citation45]. The two feature selection methods such as filter and wrapper method differ in the working principle. The filter method such as feature importance selects subsets of features based on their relationship with the target variable whereas the wrapper method such as recursive feature elimination searches for well-performing subsets of features. The descriptive analysis of features considered with the target variable was analysed using scatter plots as in Figure . We present a novel methodology to find the best feature subset by combining the principle of both filter and wrapper method as in Figure feature selection part that retains the benefits of both the method.
Figure 1. Descriptive analysis of feature set with the target variable.
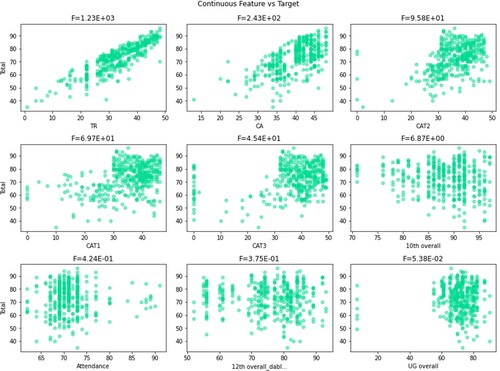
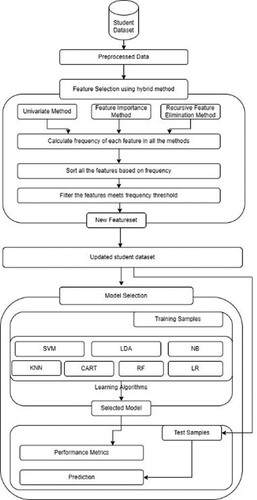
Figure 2. Proposed framework of supervised learning approach to unfold the student's academic future progression. Support Vector Machine(SVM), Linear Discriminant Analysis(LDA), Naïve Bayes(NB), Classification and Regression Tree(CART), Random Forest(RF), Logistic Regression(LR), K-Nearest Neighbor(KNN).
The univariate method screens the independent variables in advance using statistical methods and sample functions, for example. It is used on a training set, with filtering based on features [Citation46]. When using this univariate feature selection procedure, the highly dependent features are listed out.
The input features are applied with the recursive feature elimination method in this study, and the topmost features were discovered as a consequence. For uncertainty identification, the resulting feature set can be tracked using resample. As a result of recursive elimination, a matrix and a vector was created, along with some special options such as ranking, prediction, and so on [Citation13,Citation45]. The elimination procedure was repeated by selecting a feature and comparing it to all other features [Citation47]. Some algorithms require the importance of features to be determined for evaluation before they can be employed in a prediction method. The highest score for a characteristic that is very essential for prediction is shown by the feature importance technique [Citation28,Citation48,Citation49].
Now all the features were listed with the frequency generated and accumulated among the three feature selection techniques applied and were sorted based on the frequency acquired by the hybrid method. Feature Frequency threshold is set which is a simple baseline approach to feature selection. It removes all features whose frequency does not meet the threshold. By default, it considers that features with higher frequency contain more useful information. Then, the three commonly used feature selection strategies, such as univariate, feature significance, and recursive feature removal techniques results were merged, yielding a feature set with an accumulated frequency as rank. All the features were sorted in descending order with the frequency obtained. Statistically, essential characteristics that met the frequency threshold holding the top rank were selected for the model to provide better accuracy. Correlation between selected features and target using the proposed method from below Table . As the execution time is directly connected to the number of features used, and so as optimization is concerned, the highest accuracy can be achieved with the lowest execution time that is, using the smallest number of features.
Table 3. Comparison of proposed hybrid feature selection with Pearson’s correlation method.
Pearson’s correlation coefficient is a bivariate correlation technique that finds the correlation statistically among pairs of variables. It statistically finds the significant linear relationship that p exists between two continuous variables, the strength of a linear relationship and the direction of a linear relationship either increasing or decreasing. A Pearson correlation between variables X and Y is calculated by the formula dividing the covariance by the product of the standard deviations of the variables X and Y.
(1)
(1)
Correlation can have any value between −1 and 1. The magnitude of the correlation (how close it is to −1 or +1) reflects the intensity of the relationship, whereas the sign of the correlation coefficient indicates the direction of the association. The value −1 indicates a linear relationship that is perfectly negative, 0 indicates that there is no connection and +1 indicates a linear relationship that is perfectly positive concerning Table .
Table 4. Pearson's correlation.
Finally, the result set was verified with the proposed hybrid feature selection technique. Hence, the relationship between feature and target variables taken into account overcomes the drawback of filter methods. Subsequently, the optimal feature set can be considered as a set leading to the highest prediction accuracy.
4.1.2. Model selection
As the initial step, the hybrid feature selection was performed and the important features were filtered that forms a new dataset. It uses a hybrid feature selection strategy to filter out key characteristics that are shared by all three methods (univariate, feature importance, and recursive feature removal) as in Figure . To create a new dataset, some features were kept and others were removed from the overall feature set as in steps 1–3 of algorithm 1. Next, the machine learning model should be found for the suggested framework as in step 4 of algorithm 1.
It was observed that one among the most used supervised machine learning algorithms such as logistic regression, support vector machine, linear discriminant analysis, classification and regression tree, KNN, naive bayes and random forest were applied. The training samples were set and when executed through all the models, it is noted that there was a change in the newly suggested model based on the input features. It depends on the various factors such as accuracy, recall, F1 measure and kappa value.The logistic regression [Citation30,Citation50] and KNN [Citation8,Citation31] algorithms were shown to be the most effective classification algorithms. The final, high-accuracy model was then fixed as the actual model, and the dataset to test was processed and predicted. Based on the predictions, early interventions could be given to help the student pass the exam on the first try with the student’s effort. The importance of each feature in the feature set is computed in the proposed approach. Similarly, the relevance of each characteristic is computed, and then the frequency is calculated based on its modal existence, and ultimately the rank is calculated. For prediction, the feature with the highest-ranking was chosen.
The logistic regression and classification and regression tree, out of all the classification models used, provide the highest accuracy, which can be computed. The logistic regression is calculated where probabilities were found as a prediction that fits in it using likelihood. Therefore, for each training data point x, the predicted class was y. The proposed framework suggested the best fitting algorithm that outperformed all the other algorithms as specified in steps 5–8 in algorithm 1.
5. Results and discussion
In the student performance dataset, there are a variety of regularly used feature selection techniques such as principal component analysis(PCA), univariate, feature importance, recursive elimination. All these feature selection techniques combined with a random forest algorithm provides good accuracy. Among these feature selection techniques, the newly proposed feature selection methodology outperforms all the other techniques and its correctness is ensured with the Pearson’s correlation finding. When compared to existing feature selection strategies used in random forests, the accuracy attained from the newly proposed feature selection technique is high and it is 96 percent. Based on the prediction through this SLASAFP algorithm, the interventions can be provided as and when needed at an early stage which improves the student’s performance at the first attempt itself as a proactive measure Table .
Table 5. List of the most influential features for the final prediction.
In the proposed framework, the machine learning model was selected and applied dynamically based on the number of features selected for prediction. According to the results of the experiment, the features HS, HSC, UG, ENT, CAT1 and CAT2 were filtered as key factors for determining student academic prediction. The dataset was pre-processed, and the new data was applied using a support vector machine, with the hyper-plane and line being classified separately. The SVM classifies the tiny dataset, with a mean accuracy of 0.814 and a mean standard deviation of 0.143. The mean was 0.728 and the standard deviation was 0.174 when the linear discriminant analysis was used.
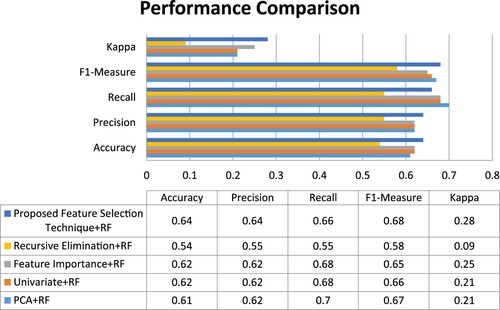
The performance comparison of various machine learning algorithms with the proposed feature selection techniques has been done based on various metrics such as Accuracy, Precision, Recall, F1-measure and kappa in the X-axis as in Figure . In LDA, n-dimensional mean vectors and scatter matrices are computed, and an Eigenvalue is formed, where the greatest vector values are filtered for prediction, and the summation of means and difference between covariances are calculated.
Figure 3. Comparison of performance metrics of proposed feature selection technique with various feature selection methods with Random Forest (RF).
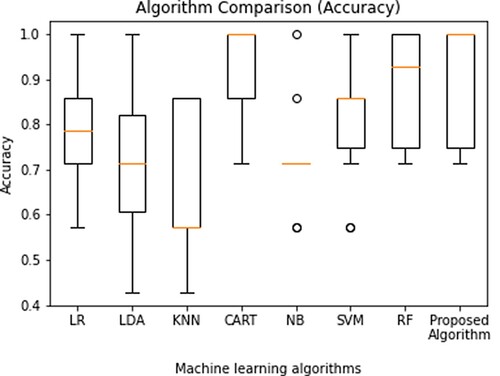
KNN is the most basic algorithm, with nearly no assumptions in prediction where the accuracy mean was 0.671 and the standard deviation was 0.157. The simplest approach is logistic regression, which uses the log of changes as the dependent variable. When logistic regression and classification and regression tree was applied, both generated the same mean accuracy as 0.785 and the standard deviation was 0.115. On applying the naïve bayes algorithm, the mean accuracy was found to be 0.728 and the standard deviation was 0.118. Finally, the random forest algorithm when applied it proves to give a higher mean accuracy value of 0.900 with a standard deviation of 0.128. It was evident that the model selected with the selected features for this dataset provided better results compared to other algorithms.
Finally, Stratified K fold cross-validation was used here as it allows to split data into train and test sets using train/test indices. The n_splits parameter in StratifiedKFold is set to 10, splitting our dataset by 10 times. In addition, the shuffling is kept true. This cross-validation object returns stratified folds and is a variant of KFold. With the cross-validation, the accuracy and standard deviation for all the algorithms were compared 0.20 Kappa value is 0.28 which is high comparing other values.
The mean accuracy received was visualized in the form of a box plot where the minimum value, first quartile, median, third quartile and maximum value could be viewed and compared as in Figure . It proves the proposed algorithm outperforms all the other algorithms with the proposed feature selection technique with the minimal number of features as in Figures and . In this approach, the algorithm predicts the student's performance, and the students are alerted via their monitoring system.
Figure 4. Various machine learning algorithm’s standard mean value comparison for performance evaluation.
6. Conclusion and future works
In this manuscript, we have proposed a methodology to monitor and predict success in higher education. The objective of this approach was to obtain the best prediction results so that in the following work we can develop an individualized learning system. The most extensively utilized technique for predicting student behaviour, according to the data collected in this review is supervised learning, which gives accurate and dependable findings. The SVM algorithm, in particular, was the most commonly utilized by the authors and offered the most accurate predictions as there is only a small-sized dataset available for further analysis. DT, NB, and RF, in addition to SVM, have all been well-studied algorithmic ideas that have produced positive outcomes.
Using various supervised machine learning techniques, the academic achievement of a student can be predicted. The dataset was subjected to six techniques, including logistic regression, linear discriminant analysis, KNN, classification and regression trees, support vector machine, random forest and naive bayes. To determine the performance of the algorithms, the real-time dataset was pre-processed using various data preparation techniques and updated data was split into train and test data.
When all six methods and characteristics were applied to the dataset, it was clear that random forest with the proposed feature selection technique in the suggested framework outperformed all other machine learning models with an accuracy of 90 percent.
Some of the research-based institutes seek to increase their reputation and rating by enlisting the help of high-achieving students to solve real-world problems. As a result, predicting and improving the student’s performance is a pressing need. Furthermore, understanding student’s performance in each course ahead of time is essential for assisting at-risk students in overcoming obstacles in their learning journeys and assisting them in excelling in the learning process. While such forecasts are difficult to make, especially for a new university, because there aren't enough dataset entries to analyse. Nonetheless, our findings show that it is possible to do so with reasonable accuracy rates with this limited set of features. The next step is to assess and develop a big data architecture that can handle the vast amounts of academic data that the university creates regularly. Other data, such as the student's online class activities and assessment information, as well as information from the student's learning assessment system, should be added with this academic data.
Disclosure statement
No potential conflict of interest was reported by the author(s).
References
- Badugu S, Rachakatla B.. Student's performance prediction using machine learning approach. In Data engineering and communication technology. Singapore: Springer; 2020. p. 333–340.
- Sunday K, Ocheja P, Hussain S, et al. Analyzing student performance in programming education using classification techniques. International Journal of Emerging Technologies in Learning (iJET). 2020;15(2):127–144.
- Hooshyar D, Pedaste M, Yang Y. Mining educational data to predict students’ performance through procrastination behavior. Entropy . 2020;22(1):12.
- Zulfiker MS, Kabir N, Biswas AA, et al. Predicting students’ performance of the private universities of Bangladesh using machine learning approaches. International Journal of Advanced Computer Science and Applications. 2020;11(3):672–679.
- Tatar AE, Düştegör D. Prediction of academic performance at undergraduate graduation: course grades or grade point average? Applied Sciences. 2020;10(14):4967.
- Gajwani J, Chakraborty P. Students’ performance prediction using feature selection and supervised machine learning algorithms. In International Conference on Innovative Computing and Communications (pp. 347-354). Springer, Singapore; 2021.
- Ajibade SSM, Ahmad NB, Shamsuddin SM. A heuristic feature selection algorithm to evaluate the academic performance of students. In 2019 IEEE 10th Control and System Graduate Research Colloquium (ICSGRC) (pp. 110-114). IEEE; 2019, August.
- Ahmed MR, Tahid STI, Mitu NA, et al. A comprehensive analysis on undergraduate student academic performance using feature selection techniques on classification algorithms. In 2020 11th International Conference on Computing, Communication and Networking Technologies (ICCCNT) (pp. 1-6). IEEE; 2020, July.
- Dutt A, Ismail MA, Herawan T. A systematic review on educational data mining. Ieee Access. 2017;5:15991–16005.
- Saqr M, Fors U, Tedre M. How the study of online collaborative learning can guide teachers and predict students’ performance in a medical course. BMC Med Educ. 2018;18(1):1–14.
- Ahmed NS, Sadiq MH. Clarify of the random forest algorithm in an educational field. In 2018 international conference on advanced science and engineering (ICOASE) (pp. 179-184). IEEE; 2018, October.
- Aljohani NR, Fayoumi A, Hassan SU. Predicting at-risk students using clickstream data in the virtual learning environment. Sustainability. 2019;11(24):7238.
- Buenaño-Fernández D, Gil D, Luján-Mora S. Application of machine learning in predicting performance for computer engineering students: A case study. Sustainability. 2019;11(10):2833.
- Yassein NA, Helali RGM, Mohomad SB. Predicting student academic performance in KSA using data mining techniques. Journal of Information Technology & Software Engineering. 2017;7(5):1–5.
- Miguéis VL, Freitas A, Garcia PJ, et al. Early segmentation of students according to their academic performance: a predictive modelling approach. Decis Support Syst. 2018;115:36–51.
- Akour M, Alsghaier H, Al Qasem O. The effectiveness of using deep learning algorithms in predicting students achievements. Indonesian Journal of Electrical Engineering and Computer Science. 2020;19(1):387–393.
- Ofori F, Maina E, Gitonga R. Using machine learning algorithms to predict students’ performance and improve learning outcome: a literature based review. Journal of Information and Technology. 2020;4(1):33–55.
- Amra IAA, Maghari AY. Students performance prediction using KNN and Naïve Bayesian. In 2017 8th International Conference on Information Technology (ICIT) (pp. 909-913). IEEE; 2017, May.
- Sekeroglu B, Dimililer K, Tuncal K. Student performance prediction and classification using machine learning algorithms. In Proceedings of the 2019 8th International Conference on Educational and Information Technology (pp. 7-11); 2019, March.
- Zaffar M, Savita KS, Hashmani MA, et al. A study of feature selection algorithms for predicting student’s academic performance. Int. J. Adv. Comput. Sci. Appl. 2018;9(5):541–549.
- Gajwani J, Chakraborty P. Students’ performance prediction using feature selection and supervised machine learning algorithms. In International Conference on Innovative Computing and Communications (pp. 347-354). Springer, Singapore; 2021.
- Zohair LMA. Prediction of student’s performance by modelling small dataset size. International Journal of Educational Technology in Higher Education. 2019;16(1):1–18.
- Chung JY, Lee S. Dropout early warning systems for high school students using machine learning. Child Youth Serv Rev. 2019;96:346–353.
- Alyahyan E, Düştegör D. Predicting academic success in higher education: literature review and best practices. International Journal of Educational Technology in Higher Education. 2020;17(1):3.
- Al-Shehri H, Al-Qarni A, Al-Saati L, et al. Student performance prediction using support vector machine and k-nearest neighbor. In 2017 IEEE 30th Canadian Conference on Electrical and Computer Engineering (CCECE) (pp. 1-4). IEEE; 2017, April.
- Naseer M, Zhang W, Zhu W. Early prediction of a team performance in the initial assessment phases of a software project for sustainable software engineering education. Sustainability. 2020;12(11):4663.
- Tatar AE, Düştegör D. Prediction of academic performance at undergraduate graduation: course grades or grade point average? Applied Sciences. 2020;10(14):4967.
- Bujang SDA, Selamat A, Ibrahim R, et al. Multiclass prediction model for student grade prediction using machine learning. IEEE Access. 2021;9:95608–95621.
- Hussain M, Zhu W, Zhang W, et al. Using machine learning to predict student difficulties from learning session data. Artif Intell Rev. 2019;52(1):381–407.
- Li C, Xing W, Leite W. Yet another predictive model? Fair predictions of students’ learning outcomes in an online math learning platform. In LAK21: 11th International Learning Analytics and Knowledge Conference (pp. 572-578); 2021, April.
- Yan L, Liu Y. An ensemble prediction model for potential student recommendation using machine learning. Symmetry (Basel). 2020;12(5):728.
- Shekhar S, Kartikey K, Arya A. Integrating decision trees with metaheuristic search optimization algorithm for a student’s performance prediction. In 2020 IEEE Symposium Series on Computational Intelligence (SSCI) (pp. 655-661). IEEE. 2020, December.
- Abubakar Y, Ahmad NBH. Prediction of students’ performance in e-learning environment using random forest. International Journal of Innovative Computing. 2017;7(2):1–5.
- Dangi A, Srivastava S. An application of student data to forecast education results of student by using classification techniques. Journal of Critical Reviews. 2020;7(14):3339–3343.
- Rastrollo-Guerrero JL, Gomez-Pulido JA, Durán-Domínguez A. Analyzing and predicting students’ performance by means of machine learning: A review. Applied Sciences. 2020;10(3):1042.
- Al-Shehri H, Al-Qarni A, Al-Saati L, et al. Student performance prediction using support vector machine and k-nearest neighbor. In 2017 IEEE 30th Canadian conference on electrical and computer engineering (CCECE) (pp. 1-4). IEEE; 2017, April.
- Burman I, Som S. Predicting student’s academic performance using support vector machine. In 2019 Amity International Conference on Artificial Intelligence (AICAI) (pp. 756-759). IEEE; 2019, February.
- Huang C, Zhou J, Chen J, et al. A feature weighted support vector machine and artificial neural network algorithm for academic course performance prediction. Neural Computing and Applications. 2021;33:1–13.
- Boedeker P, Kearns NT. Linear discriminant analysis for prediction of group membership: a user-friendly primer. Advances in Methods and Practices in Psychological Science. 2019;2(3):250–263.
- Bunkar K, Tanwani S. Student performance prediction using C4. 5 decision tree and CART algorithm. Parishodh Journal. 2020, February;IX(II):1702–1716.
- Amra IAA, Maghari AY. Students performance prediction using KNN and Naïve Bayesian. In 2017 8th International Conference on Information Technology (ICIT) (pp. 909-913). IEEE; 2017, May.
- Vyas MS, Gulwani R. Predicting student's performance using cart approach in data science. In 2017 International conference of Electronics, Communication and Aerospace Technology (ICECA) (Vol. 1, pp. 58-61). IEEE; 2017, April.
- Nawai SNM, Saharan S, Hamzah NA. An analysis of students’ performance using CART approach. In AIP Conference Proceedings (Vol. 2355, No. 1, p. 060009). AIP Publishing LLC; 2021, May.
- Tripathi A, Yadav S, Rajan R. Naive Bayes classification model for the student performance prediction. In 2019 2nd International Conference on Intelligent Computing, Instrumentation and Control Technologies (ICICICT) (Vol. 1, pp. 1548-1553). IEEE; 2019, July.
- Saifudin A, Desyani T. Forward selection technique to choose the best features in prediction of student academic performance based on Naïve Bayes. J Phys Conf Ser. 2020, March;1477(3):032007. IOP Publishing.
- Gómez-Pulido JA, Durán-Domínguez A, Pajuelo-Holguera F. Optimizing latent factors and collaborative filtering for students’ performance prediction. Applied Sciences. 2020;10(16):5601.
- Li J, Sun S, Yin H, et al. SEPN: a sequential engagement based academic performance prediction model. IEEE Intell Syst. 2020;36(1):46–53.
- Rai S, Shastry KA, Pratap S, et al. Machine learning approach for student academic performance prediction. In: Evolution in computational intelligence. Singapore: Springer; 2021. p. 611–618.
- Kou G, Yang P, Peng Y, et al. Evaluation of feature selection methods for text classification with small datasets using multiple criteria decision-making methods. Appl Soft Comput. 2020;86:105836.
- Hasan R, Palaniappan S, Mahmood S, et al. Predicting student performance in higher educational institutions using video learning analytics and data mining techniques. Applied Sciences. 2020;10(11):3894.