
 ?Mathematical formulae have been encoded as MathML and are displayed in this HTML version using MathJax in order to improve their display. Uncheck the box to turn MathJax off. This feature requires Javascript. Click on a formula to zoom.
Abstract
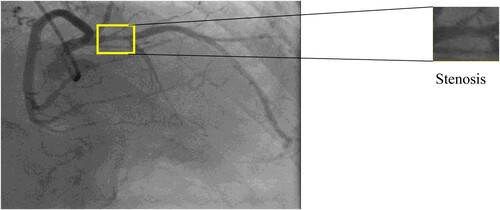
Coronary artery disease has been the utmost mutual heart disease in the past decades. Various research is going on to prevent this disease. Obstructive CAD occurs when one or more of the coronary arteries which supply blood to myocardium are narrowed owing to plaque build-up on the arteries’ inner walls, causing stenosis. The fundamental task required for the interpretation of coronary angiography is identification and quantification of severity of stenosis within the coronary circulation. Medical experts use X-ray coronary angiography to identify blood vessel/artery stenosis. Due to the artefact, the image has less clarity and it will be challenging for the medical expert to find the stenosis in the coronary artery. The solution to the problem a computational framework is proposed to segment the artery and spot the location of stenosis in the artery. Here the author presented an automatic method to detect stenosis from the X-ray angiogram image. A unified Computational method of Jerman, Level-set, fine-tuning the artery structure, is developed to extract the segmented artery features and detect the artery’s stenosis. The current experimental outcomes illustrate that this computational method achieves average specificity, sensitivity, Accuracy, precision and F-scores of 95%, 97.5%, 98%, 97.5% and 97.5%, respectively.
1. Introduction
Coronary Artery Disease/Coronary Heart Disease is one of the communal cardiac diseases in the world. According to WHO, 17.9 million people die from cardiovascular diseases and in that 85% are due to heart attack and stroke [Citation1]. Despite main growths in the treatment of atherosclerotic disease patients, many healthy victims of the illness die unexpectedly without earlier symptoms. Existing diagnostic and screening methods are inadequate to detect the victims earlier the event occurs [Citation2].
Detecting stenosis using computational methods has opened a new path of initial in the field of heart medicine. This Coronary artery disease can be prevented by focusing on behavioural risk factors such as unhealthy diet, obesity, tobacco habit, alcohol habit and physical inactivity. It is significant to detect coronary heart disease in the initial stage, to begin the medicines and counselling for the patient. The stenosis/plaque causes coronary heart disease, and stenosis is nothing but the fatty material deposited on the wall of the blood vessel [Citation3], which reduces the bloodstream to the heart or brain.
If the blood flow is reduced or stopped, it leads to Stroke and Heart attacks. So, to prevent this critical situation, finding the disease is important. One of the main diagnosing tests used to detect the coronary heart disease is the coronary angiogram test. In this procedure, a tiny pipe-like structure called a catheter is inserted into the vein. Once it comes to the correct position in the heart, dye is injected into the catheter, then the dye flows through the full artery; a parallel X-ray machine will initiate capturing the images from various angles and storing them in video format.
The primary phase of image acquisition involves capturing the angiogram images through the sensor. Different medical modalities are used to capture the angiogram image, such as MRA CT, X-ray and PET. Radiography is a medical modality that uses electromagnetic radiation, particularly X-rays, to see the non-transparent part of the human body. In this procedure, a heterogeneous beam of X-rays is produced by the generator projected on the part of the body. The rays penetrated the body parts and captured the image. The captured image is two-dimensional, representing the internal of the body.
Through analyzing the captured image, coronary artery disease can be identified by experts. Generally, medical images are an important part of healthcare; through these medical images, the nature of the human biological system is understood without surgery. The image captured from the various medical modality is in digital format. Digital image processing techniques are used to understand and get information from medical images. These techniques help to know the abnormality in the organ or part of the body by analyzing the image. The images are denoted in a matrix format with rows and columns. The medical images are processed and enhanced using image processing techniques called medical image processing.
Recently developed a coronary extraction and stenosis quantification method in XCA using a deformable spline algorithm and a string-matching technique. These methods were not fully automatic and required human interaction. Presented an automated method for the detection of coronary stenoses with XCA using a spatio-temporal surface of the artery width. But, this approach did not consider stenosis severity which is more clinically relevant.
To avoid this issue in this work using medical image processing methods and techniques, the author can extract the Keyframe from the angiogram video and pre-process it. The region of interest is also segmented properly using the hybrid segmentation method. In this research work, geometrical features are extracted from the segmented artery and by using this feature stenosis is identified. The proposed computational framework is presented to identify coronary artery disease. It begins with detecting the Keyframe from the video and pre-processing it, then segmenting the artery from the angiogram image and locating the stenosis in the artery region as a bounding box.
2. Literature review
Various studies proposed a number of segmentation methods for the automatic segmentation of the artery. Some of the research works are based on the Hessian method and Matching filter. Ivan Cruz-Aceves et al. [Citation4] proposed a method to detect the vessel and non-vessel in the angiogram image. Here author used the Gaussian matching template with an entropy minimization function. This segmentation method is compared with five different methods using the ROC curve and area. In this work, the author used 45 angiograms for demonstration and achieved 0.945 accuracies for blood vessel detection. Tao Wan et al. [Citation5] extracted the coronary blood vessel from the angiogram image using the Hessain-based statistical region merging method. This experiment author validated 100 patients’ data in the research and achieved 93% accuracy. Hengfei Cui et al. [Citation6] designed a hybrid method for vessel structure enhancement from medical images. In this work, vessel diffusion and the modified Frangi method on eigenvalue ratio are combined to get the region of interest. This author experimented on the two-dimensional retinal dataset and a three-dimensional vessel structure dataset. In this work, author compared the results with five other vessel enhancement methods. In this research work, a modified Frangi method is proposed to distinct the vessel from the image, but still the background noise is present in the segmented image. Guangkun Ma et al. [Citation7] proposed a hybrid segmentation method with a multi-scale-based vessel extraction method and region-growing method to find vascular structure from the angiogram image. Dash et al. [Citation8] presented an improved curvelet transform technique for finding the region of interest in the retinal image. In this research work, author first separated the green channels from the image and started the enhancement using the Jerman method. Then curvelet transformation with the Jerman method is utilized to the enhanced image to extract the vessel. The mean-C thresholding technique is used for the segmented image; after that, by using the morphological operation, the segmented image is fine-tuned further. This research work can use the pre-processing filter before the Jerman method to eliminate the noise in the image. Qian et al. [Citation9] researcher proposed a new non-local Hessain filter to segment the vascular structure from the angiogram image. This researcher incorporates a non-local operator in the Hessian method to reduce the image’s noise. This work combines the exponential function to form a new vascular enrichment filter. The output of this segmentation method is compared with the other Hessain-based filter. However, segmented output from this method is not considered an optimum.
Various authors have proposed different computational methods to identify coronary artery stenosis in the past. Among them, Compas et al. [Citation10] used the spatial–temporal method to segment the artery and tried to locate the plaque in the artery, and the author achieved 86% sensitivity and 97% specificity using 16 patients’ data. Zifan and Liatsis [Citation11] proposed a model to identify the narrowed artery region by building a 3D mesh model from the 2D coronary angiogram image. Iman [Citation12] proposed an algorithm to detect atherosclerosis and identify the narrowed artery by operating the center line method. Kishore et al. [Citation13] employed an automatic system to find the stenosis grading. In this author cropped a certain part of the segmented image and tried to measure the width of the artery row by row pattern. In these 25 angiographies, images were experimented with and obtained the resulting sensitivity of 94.74%, specificity of 83.3%, Accuracy of 92% and precision of 94.74%. Wu et al. [Citation14] experimented a deep-learning method through temporal constraints to locate the stenosis. The method attains 87.2% sensitivity and 79.5% positive predictive. Another research work is presented by Emmanuel Ovalle-Magallanes et al. [Citation15] to detect the stenosis using the Inceptionn-v3, ResNet50 and VGG16 Convolution Neural Network using Transfer Learning. This Inception-v3 gave a better stenosis detection compared with others. It provided an accuracy of 0.95. Danilov et al. [Citation16] implemented a deep-learning technique to detect the plaque in the coronary image. The author experimented with 100 patients’ data in the research and got an F1-score of 0.96 and average precision of 0.95 through the Faster-RCNN Inception ResNetV2-based network model. Table shows the comparison of existing coronary artery stenosis identification methods.
Table 1. Comparison of existing coronary artery stenosis identification methods.
3. Material and methods
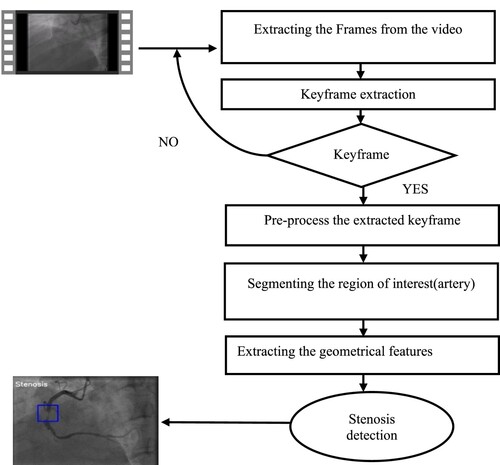
A flow diagram of the proposed computational method is shown in Figure , which contains four major parts: Keyframe extraction from the angiogram video, pre-processing the image, segmenting the region of interest and detecting the stenosis. The parts are described below.
Figure 1. Proposed method flow diagram.
3.1. Problem statement
Coronary artery disease (CAD), is the most common type of cardiovascular diseases and a major cause of mortality worldwide in the last decade. When the coronary arteries are narrowed or blocked induced by the atheromatous plaques building up inside, the reduction of oxygen-rich blood flow to the heart muscle can cause angina or a myocardial infarction. The fundamental task required for the interpretation of coronary angiography is identification and quantification of severity of stenosis within the coronary circulation. However, with the complex vessel structure, image noise, poor contrast and non-uniform illumination appearing in the angiograms, the maximum degree of coronary artery stenosis cannot be always accurately evaluated.
3.2. Data description
The coronary angiogram image sequence used in this research work was acquired from the cardio department of Rahavendar Hospital, Madurai. The author collected data coronary angiogram data from the hospital from 2019 to 2020. The patients underwent an angiogram test in the cath lab in a supine position screened by the Philips Allura X per FD20 C-arm system. All the frames are captured at the rate of 25 frames per second. Dataset contains three subsets: 1-17, 1-19 and 1-AVI.
Stored in DICOM (Digital Imaging and Communications in Medicine) format, while angiograms in 1-AVI were stored in AVI (Audio Video Interleave) format. Patients were excluded if any of the following occurred: incomplete injection of contrast dye, percutaneous coronary intervention, an implanted pacemaker or cardioverter defbrillator, or the presence of artificial objects other than the dye injection catheter. Ultimately, 130 angiogram sequences from 50 patients were included in this study. 80 of angiogram sequences visualize the Left Coronary Artery (LCA) while the remaining 50 depict the right coronary artery (RCA).
3.2.1. Keyframe extraction
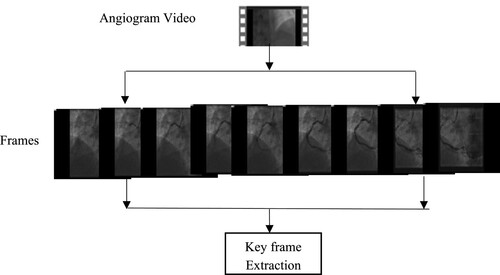
Normally angiogram data is in video format. While diagnosing the disease, the cardiologist manually determines the Keyframe from the video by visually inspecting the frames. The Keyframe is the frame that contains the complete structure of the artery. Identifying the Keyframe through visual inception is time-consuming, here author implemented the automatic keyframe extraction from the angiogram video.
In this research, Keyframe is extracted from the video using the absolute difference of the histogram method [Citation17]. This method starts with splitting the frame one by one in the video. Then Convert all frames into grayscale. Calculate the histogram difference between the following frames and compute the mean value and standard deviation value. By Equation (1) the threshold value is calculated. Finally, select the Keyframe, comparing the threshold value with the absolute difference histogram of the frames. Figure shows the key frame extraction method.
(1)
(1)
T - Threshold
M_ADH - Mean of absolute difference
S_ADH - Standard deviation of absolute difference.
Steps
Extract the frames from the video
Change the frame into a grayscale image.
compute the histogram difference for consecutive frames.
Using the absolute difference, calculate the mean value.
Using the absolute difference, calculate the standard deviation.
Find the threshold through mean and standard deviation.
Check whether the threshold value is greater than the frame, then extract it as a Keyframe.
Once the Keyframe is extracted from the above phase, it will be pre-processed by removing the unwanted areas to enhance the image.
Figure 2. Key frame extraction method.
3.2.2. Pre-processing
Pre-processing is a method that helps to improve the image and to remove the artifacts from the image. In this research, the angiogram images are mainly affected by the artefact and also the non-illumination of lighting. The extracted keyframe has a black region around the artery structure. That black area in the image/frame is removed by means of the grey threshold method by using Equation (2).
(2)
(2)
where – Pre-processed Image
– Keyframe
– Threshold value
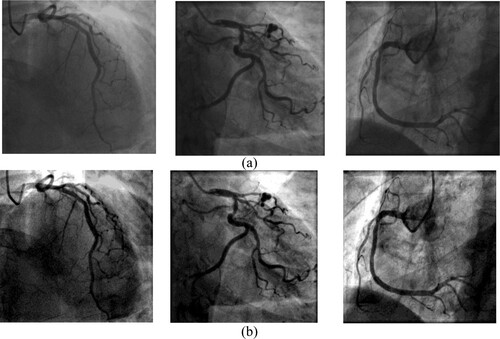
The pre-processed image is appearing without the black region. By using the Top hat morphological [Citation18] function, the angiogram image is enhanced further, and the artery is visible after the pre-processing. The output of the sample pre-processed image is shown in Figure (a,b).
Figure 3. (a) Original image (b) Pre-processed images.
3.2.3. Segmentation
Segmenting the image means separating the original image by gathering the pixel values of the original image. It is mostly intended for distinguishing the region of interest/foreground from the image. There are many segmentation methods like multiscale Hessian-based filtering, Gaussian Matched Filters [Citation19], Gabor filters [Citation20], convolutional neural networks. In this research work, the author first implemented the Jerman method to isolate the vascular structure from pre-processed image. Where the image is converted into the hessian matrix by using second-order derivation, and from the hessian matrix using eigenvalues and using eigenvector, the blood vessel is highlighted. But in this output image, the other part is also highlighted as a vessel, so the author converts that image into binary to do further process. Then in that binary image Level set method is used to segment the region of interest. But till output image from the Level set method also not extracted the artery region perfectly, the author applied a method to find the highest connected region in the image. Once the region is found, the other non-artery region in that image is removed, So the artery can be extracted clearly from the angiogram image.
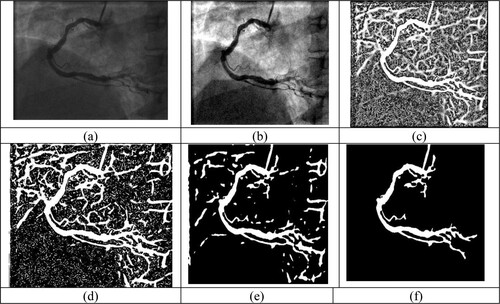
Figure shows the output of each stage of the research work. Figure (a) is the original angiogram acquired from the X-ray machine. Figure (b) is the enhanced image, and Figure (c) is the output from the Jerman method, which is also used to enhance the vessel. Figure (d) is the converted binary image and Figure (e) image is the segmented image using the Level set method. Finally, Figure (f) shows extracted artery region from the proposed segmentation method. In Figure author presented the images individually to brighten the proposed segmentation method.
Figure 4. (a) Original image (b) Pre-processed image (c) Highlighting the vessel using Jerman method (d) Convert the image into binary (e) Segmented the image using Level Set method (f) Output of proposed method.
3.2.4. Stenosis detection
Features help to detect the stenosis from the image. Here the author extracted different geometrical features from the segmented artery. These features are fused by feature-level fusion, and this proposed method detects the blockage from the coronary angiogram image. The result is shown in Figure . The contour method is used to track the coronary artery, then the artery contour below 1500 is extracted and stored in the variable. The distance among each contour remains calculated by the Euclidian distance method. If the distance among the contours is less than 15, it is considered a Stenosis area in the artery. The Final output of the computational method is shown in Figure .
Figure 5. Left artery image with marked stenosis location.
ALGORITHM
Input: Angiogram video from the C-arm X-Ray device
Output: Angiogram video frame with the marked region
Step 01: Frames are separated from the video, using the frame extraction method
Step 02: Keyframe is identified using the Keyframe extraction method
Step 03: Pre-process the Keyframe(image)
Step04: Apply the Jerman segmentation method to extract the foreground region from the image
Step 05: Once foreground is extracted, then apply the level set method to get the region of interest.
Step 06: From that segmented output, check the strong connection in the image and remove the other region in the image. Now, a clear artery structure is extracted.
Step 07: When the artery region is extracted, then geometrical features from that image are extracted.
Step 08: Geometrical features are used to spot the image’s blockage and are shown as the output.
4. Experimental results and analysis
In this research work, three existing segmentation methods are tested in this dataset then the author tried the proposed method to get the vessel structure in the angiogram image. 100 images are used in the experiment to check the method accuracy measure. In this research work, all images are pre-processed to reduce the image’s noise and improve the image. Top hat transformation is used in the image to enhance it. Once the image is pre-processed, to highlight the blood vessel structure Jerman segmentation method is used. Then change the segmented image into a binary image. The level set method is used to extract the artery properly. Once the artery is extracted to fine-tune the output image, the distance between the connected component in the image is calculated. The large distance value indicates that the part is not linked to the artery. It automatically removes the non-artery part in the image, and the only artery region will remain in the resultant segmented image.
Figure presented the output obtained from the existing method and also the proposed method. Figure (a) shows the original image acquired from the X-ray machine. In Figure (b), the results are presented by Frangi et. al. [Citation22], in that result the artery is not visible. In Figure (c), the result is presented by Yang et.al. [Citation23], wherein the segmented image background noise is presented. In Figure (d), the results of the Kaifeng Chen et.al. [Citation21] are shown; in that output image, some part of the vessel is missing, and background noise is also there. The proposed segmentation method results are presented in Figure (e). These images have a robust structure of the artery and background noise is reduced in this image. While compared to these three existing methods, the proposed segmentation method presented a whole and clear artery from the angiogram image.
Figure 6. Output of different segmentation methods.
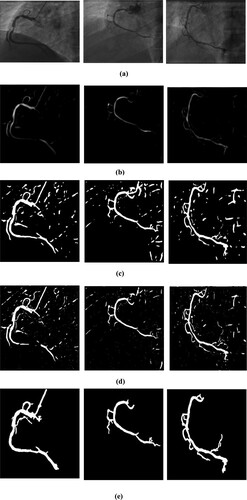
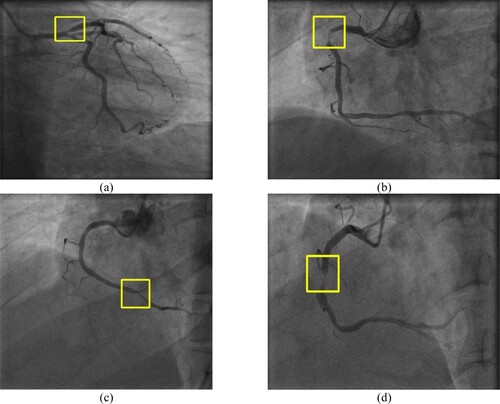
Figure shows the final result of the computational method; 7(a) is a left artery image of paitent_1 in that the stenosis is detected in the left anterior descending (LAD). Figure (b) is the right artery of the patient_2 and the stenosis is in the proximal right coronary artery (RCA). Figure (c) is the right artery of the patient_3 and the detected stenosis is in the posterior descending artery (PDA). Figure (d) is the right artery of patient_4 and stenosis is in Mid RCA. This proposed stenosis detection method locates the stenosis in the angiogram image effectively.
Figure 7. Results of the proposed stenosis detection method.
4.1. Performance metrics
To assess and compute the method’s effectiveness, the outcome of the segmentation method is compared by means of ground truth, which the experts manually segment. Performance measures like accuracy, sensitivity, precision and F-measure are computed in this research work. The accuracy stated the ability of the method to differentiate the artery and non-artery region. The accuracy, true positive, true negative, false positive and false negative standards are needed to evaluate the method. Accuracy is Mathematically defined as:
(3)
(3) where
– Number of pixels is appropriately recognized as an artery.
– Number of pixels is inappropriately recognized as an artery.
– Number of pixels is appropriately recognized as a non-artery.
– Number of pixels is inappropriately recognized as a non-artery.
The sensitivity stated as the method correctly detected artery pixel and it is mathematically defined as:
(4)
(4) Precision measures the segmentation eminence by describing the integrity of the positive detection related to the ground truth. Mathematically defined as:
(5)
(5) F-measure calculates how the segmented output is close to the ground truth. Mathematically defined as:
(6)
(6) Table specifies the performance comparison of three segmentation methods with the proposed method. The author implemented three existing methods and the proposed method on the same dataset in this research. Table indicates the input images and the performance metrics such as the accuracy (Acc), sensitivity (Sen), precision (Pre), F-Measure (Fm) of the proposed and existing techniques. Table displays the average value for accuracy, sensitivity, precision, and F-measure calculated and shown. From that average value, the proposed method has 0.96 accuracy. The proposed method produces 0.52 sensitivity, which is higher than other methods, and 0.77 precision, which is high compared to other methods. Then F-measure is 0.61 on average, which is also high compared to other methods. From Table , it shows that the proposed segmentation method gave better outcomes than the other three methods. Mostly, a higher accuracy value represents the region of interest/artery extracted from the proposed method better than other segmentation methods. Figure presents the graphical evolution of average of performance metrics with the existing method.
Figure 8. Comparison of the average values of the F-Measure, precision, sensitivity and accuracy.
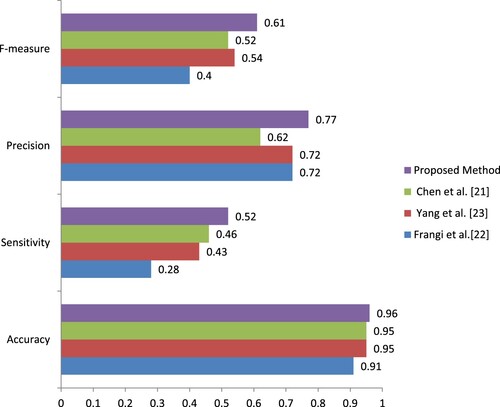
Table 2. Performance evaluation of the proposed segmentation method with three state-of-the-art methods on the dataset.
Similarity Checking is one of the main metrics used to evaluate the segmentation method. In this research Jaccard, MCC and Dice coefficients are computed to check the similarity metrics. By using these metrics, the author can prove the proposed method result is close to the ground truth.
Figure calculates the Jaccard similarity coefficient (Jaccard) measures between the ground truth and the segmented images from three existing and proposed methods. The graph shows that the proposed method has a higher value than other methods, which specifies that the proposed method performs well compared to the three methods.
Figure 9. Jaccard similarity coefficient.
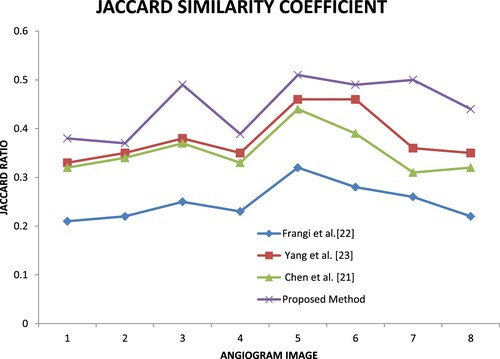
Figure shows the Dice similarity coefficient (Dice) ratio for the four methods.
Figure 10. Dice similarity coefficient.
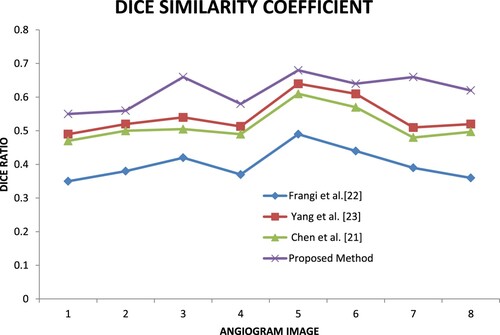
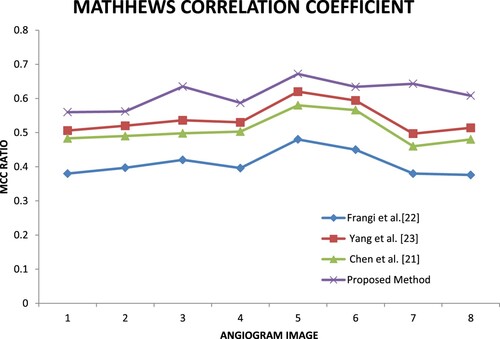
Figure shows the Matthews correlation coefficient (MCC) for the four methods. Most of the MCC ratio values of the proposed method are higher than the other three methods.
Figure 11. Matthews correlation coefficient.
To assess the performance of the proposed stenosis detection method, 100 angiogram images are used in the experiment. Accuracy, specificity, sensitivity, F1-score, precision and computational time are utilized to evaluate the performance of this proposed stenosis detection method. Table shows the evaluated results of the current research work.
Table 3. Performance evaluation for the proposed stenosis detection method.
5. Conclusion
The proposed computational method fusion the geometrical features to detect stenosis in the location of the coronary angiogram image. This method performs automatically without any human involvement. Keyframe extraction, pre-processing, artery segmentation and spotting the stenosis are the four phases carried out in this method with a less computational time of 0.42 s. This method can be an assistant tool for the medical expert during the diagnosis of stenosis in the coronary artery. Accuracy, specificity, sensitivity, F1-score and precision are figured and assessed with the existing method. This method helps the cardiologist.
Acknowledgements
The authors thank Dr R. Ramesh MD, DM, Sr. Consultant & Interventional Cardiologist and Dr M. Murugan Chairman of Rahavendar Hospital, Madurai for their substantial support.
Disclosure statement
No potential conflict of interest was reported by the author(s).
References
- Zreik M, Van Hamersvelt RW, Wolterink JM, et al. A recurrent CNN for automatic detection and classification of coronary artery plaque and stenosis in coronary CT angiography. IEEE Trans Med Imaging. 2018;38(7):1588–1598.
- Bache RJ. “Coronary artery disease: regulation of coronary blood flow,” in Coronary artery disease, Springer, London, 2015, p. 57–67.
- Cho ZH, Jones JP, Singh M. Foundations of medical imaging. Wiley; New York: Wiley; 1993.
- Cruz-Aceves I, Cervantes-Sanchez F, Hernandez-Aguirre A, et al. A novel Gaussian matched filter based on entropy minimization for automatic segmentation of coronary angiograms. Comput Electr Eng 2016;53:263–275. doi:10.1016/j.compeleceng.2016.05.002.
- Wan T, Shang X, Yang W, et al. Automated coronary artery tree segmentation in X-ray angiography using improved Hessian based enhancement and statistical region merging. Comput Methods Programs Biomed 2018;157:179–190. doi:10.1016/j.cmpb.2018.01.002.
- Cui H, Xia Y, Zhang Y. 2D and 3D vascular structures enhancement via improved vesselness filter and vessel enhancing diffusion. IEEE Access. 2019;7:123969–123980. doi:10.1109/ACCESS.2019.2938392.
- Ma G, Yang J, Zhao H. A coronary artery segmentation method based on region growing with variable sector search area. Technol Heal Care. 2020;28(S1):S463–S472. doi:10.3233/THC-209047.
- Dash S, Verma S, Kavita KM, et al. A hybrid method to enhance thick and thin vessels for blood vessel segmentation. Diagnostics (Basel. 2021 Oct 30;11(11):2017, doi:10.3390/diagnostics11112017. PMID: 34829365; PMCID: PMC8621384.
- Qian Y, Wang Z, Chen L, et al. Vascular enhancement with structure preservation from noisy X-ray angiogram images by employing non-local Hessian-based filter. Optik (Stuttg). 2021;232(February):1–12. doi:10.1016/j.ijleo.2021.166523.
- Compas CB, Syeda-Mahmood T, McNeillie P, et al. Automatic detection of coronary stenosis in X-ray angiography through spatio-temporal tracking. 2014 IEEE 11th International Symposium Biomedical Imaging, ISBI 2014, p. 1299–1302, 2014. doi:10.1109/isbi.2014.6868115.
- Zifan A, Liatsis P. Patient-specific computational models of coronary arteries using monoplane X-Ray angiograms. Comput Math Methods Med. 2016;2016:1–12. doi:10.1155/2016/2695962.
- Saad IA. Segmentation of coronary artery images and detection of atherosclerosis. J Eng Appl Sci 2018;13(17):7381–7387.
- Nandhu Kishore AH, Jayanthi VE. Automatic stenosis grading system for diagnosing coronary artery disease using coronary angiogram. Int J Biomed Eng Technol 2019;31(3):260–277. doi:10.1504/IJBET.2019.102974.
- Wu W, Zhang J, Xie H, et al. Automatic detection of coronary artery stenosis by convolutional neural network with temporal constraint. Comput Biol Med 2020;118(February):103657. doi:10.1016/j.compbiomed.2020.103657.
- Ovalle-Magallanes E, Avina-Cervantes JG, Cruz-Aceves I, et al. Transfer learning for stenosis detection in X-ray coronary angiography. Mathematics. 2020;8(9):1–20. doi:10.3390/math8091510.
- Danilov VV, Klyshnikov KY, Gerget OM, et al. Real-time coronary artery stenosis detection based on modern neural networks. Sci Rep. 2021;11:7582. doi:10.1038/s41598-021-87174-2.
- Sheena CV, Narayanan NK. Key-frame extraction by analysis of histograms of video frames using statistical methods. Procedia Comput Sci. 2015;70:36–40. doi:10.1016/j.procs.2015.10.021.
- Peng B, Wang Y, Yang X. A multiscale morphological approach to local contrast enhancement for ultrasound images. Proceedings – 2010 International Conference Computer and Information Science ICCIS 2010, vol. 80, p. 1142–1145, 2010, doi:10.1109/ICCIS.2010.282.
- Emin Tenekeci M, Pehlivan H, Kaya Y. Improving performance of coronary artery segmentation using calculated vessel location from the angiogram, 2018.
- Cervantes-Sanchez F, Cruz-Aceves I, Hernandez-Aguirre A, et al. Coronary artery segmentation in X-ray angiogram using gabor filters and differential evolution. Appl Radiat Isot 2018;138:18–24. doi:10.1016/j.apradiso.2017.08.007.
- Chen K, Yin Q, Jia X, et al. Image enhancement based improved multi-scale Hessian matrix for coronary angiography. Int J Comput Appl. 2015;126(10):1–4. doi:10.5120/ijca2015906196.
- Frangi AF, Niessen WJ, Vincken KL, et al. Multiscale vessel enhancement filtering. Int Conf Med Image Comput Comput Interv. 1998;1:130–137.
- Yang J, Huang M, Fu J, et al. Frangi based multi-scale level sets for retinal vascular segmentation. Comput Methods Programs Biomed 2020;197:105752. doi:10.1016/j.cmpb.2020.105752.