
 ?Mathematical formulae have been encoded as MathML and are displayed in this HTML version using MathJax in order to improve their display. Uncheck the box to turn MathJax off. This feature requires Javascript. Click on a formula to zoom.
Abstract
This paper presents a novel, cost-effective multisensory system designed for animal monitoring in research settings. The system aims to objectively assess animal welfare and discomfort during experiments, addressing the need for affordable monitoring solutions in research laboratories. Developed and validated in compliance with European regulations on animal experimentation and in accordance with the requirements of the Animal Research Centre at the University of Alcala´ in Madrid.
The system integrates Raspberry Pi 4 Model B and Arduino Uno boards with various sensors, including temperature, humidity, ammonia, airborne particles, and an RGB camera. A user-friendly web interface allows remote monitoring and management of the system. This innovation promises to improve the efficiency and feasibility of animal research, enabling more precise and ethical experimentation while advancing scientific knowledge and animal welfare.
1. Introduction
Animals are widely used in experimentation procedures Fox and Bennett [Citation1], before experimentation in humans Evans, Thornton, Chalmers, and Glasziou [Citation2], or simply for observing their behaviour under certain controlled conditions Dawkins [Citation3].
As the laboratory mouse is the most commonly used animal species in experimentation Reitman [Citation4], it was the reference in our studies to translate our results to other species and types of habitats in the future. The ethical and legal regulatory issues which are taken into account before using animals on research projects in Europe must implement the principles of the Three Rs Carbone [Citation5] and European Directive 2010/63/EU Council of European Union [Citation6], to be authorized by the competent authority.
One of the most important aspects is how to objectively evaluate the severity of procedures involving animals, something that is not always possible van Vlissingen, Borrens, Girod, Lelovas, Morrison, and Torres [Citation7]. Severity refers to the level of impact an individual animal can suffer in an experiment. It refers, however, not only to the impact during experimentation but also to how it affects the rest of its life. In compliance with the EU Directive, all projects with animals should be assigned a level of severity Bronstad, Newcomer, Decelle, Everitt, Guillen, and Laber [Citation8]: non-recovery, mild, moderate, or severe.
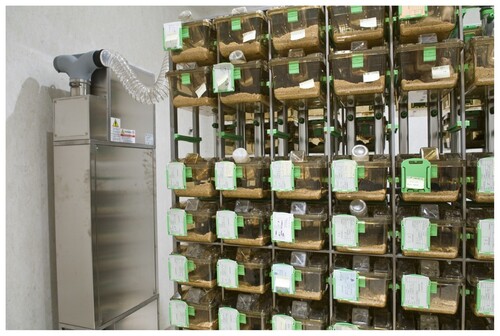
Additionally, it is a legal obligation that the welfare of all animals in a laboratory animal facility (Figure ) is revised every day, seven days a week. However, it should be noted that even a small lab animal facility can house easily as many as two thousand mice, so it is not always possible to properly implement the current regulation. Furthermore, the welfare of the animals is only assessed during the researcher’s working day, without knowing what happens during the rest of the day.
Figure 1. Animal Experimentation Centre of the University of Alcalá.
The observational follow-up of animal welfare by staff during an experiment is a tool for evaluating the level of suffering, distress, and pain experienced by the animals Ruxton [Citation9], although that observation depends on the training and experience of the people tasked with carrying it out and is not always reliable.
Furthermore, a maximum limit of severity should be established in advance of the procedures to establish the early humane end-point moment, before the expected animal suffering becomes unacceptable OECD [Citation10]. A humane end-point is defined as the earliest indicator in an animal-based experiment where an animal is experiencing severe pain, distress, and suffering or is close to impending death Orellana-Muriana [Citation11].
If it were possible to know in advance that an animal will unacceptably suffer at a certain moment in the experiment, an early human end-point could be applied, which would either result in stopping the experiment if the animal can recover or euthanizing it to end its suffering.
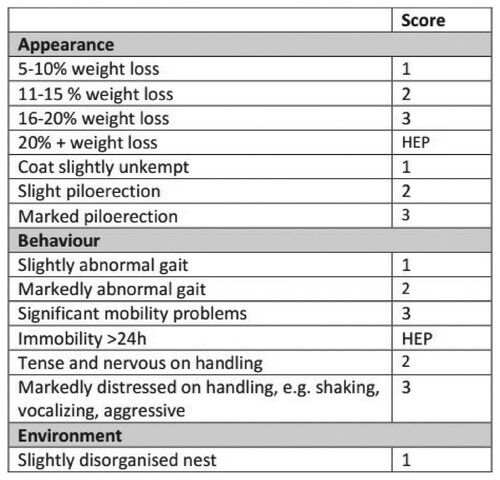
Severity has traditionally been assessed using numerical score sheets (Figure ), which show discomfort/suffering clinical signs observed in animals during experiments Bugnon, Heimann, and Thallmair [Citation12]. The higher the score, the more severe the sign moves away from normality, and therefore the total sum of the signs corresponds to the level of animal suffering and discomfort. The higher the sum, the more severe the consequences are for the animals Smith, Anderson, Degryse, Bol, Criado, Ferrara, Franco, Gyertyan, Orellana, Ostergaard, Varga, and Voipio [Citation13]. The HEP (HIT Expert Probability) – where HIT stands for Heparin-Induced Thrombocytopenia – score is the first pre-test clinical scoring model for HIT based on broad expert opinion Cuker, Arepally, Crowther, Rice, Datko, Hook, Propert, Kuter, Ortel, Konkle, and Cines [Citation14].
Figure 2. Example of a score sheet (extracted from the European Directive 2010/63/EU).
All these issues make it necessary to develop new and objective observational devices based on sensors and artificial intelligence that work automatically 24 h a day, where the human factor should not be relevant, but it is also important that their financial cost is as low as possible so they can be widely used at animal facilities and by scientists around the world.
In summary, this paper first provide an overview of the theoretical framework that underpins our research. Following this, we will delve into the state of the art, outlining the software and hardware platforms for animal monitoring than can be found in the market. The subsequent sections will present our findings in detail, organized according to the key themes identified during analysis. We will then discuss the implications of these findings and their significance in relation to existing literature. Finally, we will conclude with recommendations for future research and practical applications. This structured approach will allow for a comprehensive exploration of the topic and facilitate a deeper understanding of the issues at hand.
2. State of the art
There are many highly effective devices and kits for animal monitoring that can be found in the market. All these devices have a common characteristic: they all use sensors to perceive the different magnitudes to be quantified. A sensor is an electronic device with the ability to detect the variation of a physical quantity, such as temperature, lighting, movement, pH, air quality, pressure, etc., and convert its value into an electrical signal, either analog or digital.
2.1. Hardware platforms
Regarding the hardware used for animal monitoring, two types of sensors can be distinguished [Citation15]:
Attached sensor, which is fitted on the outside (e.g. a heart rate belt) or inside (an implant, for example) of the animal’s body.
Non-attached (or non-invasive) sensor, which is set up in a (normally fixed) location from where it perceives a signal from the environment.
Circadian activity measurement.
Liquid and/or food measurements.
Body weight measurement.
Temperature, relative humidity, and light condition measurement.
Figure 3. BioBServe and CLAMS home cages.
Other similar kits are the IntelliCageFootnote3, which allows assessment of home cage behaviour and cognitive performance of up to 16 individual mice or rats separately while they live in a social environment; the Lafayette Learning SystemFootnote4, whose main goal is teaching operant conditioning, and which has a standard pre-drilled chamber for up to four levers and four stimulus lights; and the Stoelting OroFacial Pain Assessment DeviceFootnote5, which provides an automated measurement of orofacial pain assessment in the trigeminal nerve in rats and mice via hot or cold or mechanical stimulation.
In addition, different monitoring devices can also be found separately, such as the FLIR A65 thermal camera (Figure ), which is used at the Animal Research Centre of the University of Alcalá.
Figure 4. Flir A65 thermal camera.
Finally, some attempts to cover both commercial and homemade solutions can be found in the literature. In Voikar and Gaburro [Citation16] several solutions are proposed and developed to address the problems regarding the reproducibility of research findings on the one hand, and the appropriate welfare of the animals (based on the principle of 3Rs – reduce, refine, and replace) on the other hand.
2.2. Software infrastructures
Furthermore, the software that supports the hardware has to be considered. In this respect, different types of software can be found in the market:
Commercial software: the most common, copyrighted software, developed by a company to sell for profit.
Shareware: copyrighted software that consumers can use for a trial period after which they must pay.
Freeware: free of charge, but copyrighted.
Public domain: not copyrighted and can be used without restriction.
Open source: this software is provided with its source code. Certain other rights can usually be provided under an open-source license.
EthoLogFootnote6: a Windows freeware for tracking discrete and continuous events over time. It generates an output file with summary information [Citation17].
BorisFootnote7: an open-source basic event logging multi-platform software for video/audio coding and live observations.
ToxTracFootnote8: a free Windows programme optimized [Citation18] for tracking animals (Figure ), which includes useful statistics as output [Citation19].
OpenControlFootnote9: an open-source Visual Basic software that permits a Windowsbased computer to function as a system to run fully automated behavioural experiments [Citation20].
WaVEFootnote10: a free software solution for the control of visual neurophysiological and behavioural experiments, entirely based on the MATLAB platform. It can easily be customized to individual laboratory needs [Citation21].
EthoVision XTFootnote11: an applied video tracking shareware that tracks and analyzes the behaviour, movement, and activity of any animal. In addition to integrated visualization, it includes a useful heatmap [Citation22].
DeepLabCutFootnote12: a toolbox for markerless pose estimation of animals performing various tasks. It is embedded in a larger open-source eco-system, providing behavioural tracking for neuroscience, ecology, medical, and technical applications [Citation23].
idTrackerFootnote13: a video-tracking software that extracts a characteristic fingerprint from each animal in a video recording of a group. It then uses these fingerprints to identify every individual throughout the video. Tracking by identification prevents the propagation of errors, and the correct identities can be maintained indefinitely [Citation24].
TracktorFootnote14: an image-based tracking freeware designed to perform single-object tracking in noisy environments, or multi-object tracking in uniform environments while maintaining individual identities. Tracktor is code-based but requires no coding skills other than the user being able to specify tracking parameters in a designated location, much like in a graphical user interface [Citation25].
DANNCEFootnote15: a convolutional neural network (CNN) that calculates the 3D positions of user-defined anatomical landmarks on behaving animals from videos taken at multiple angles. The difference with other approaches such as DeepLabCut for 2D keypoint detection is that this neural network is fully 3D [Citation26].
Figure 5. BioBServe Spectator monitoring software.
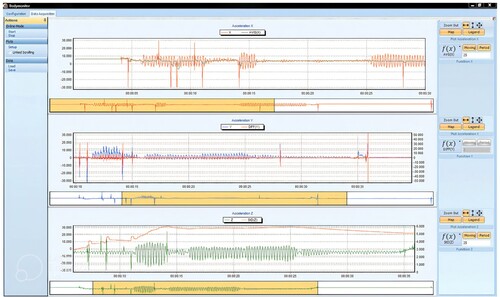
Figure 6. ToxTrac tracking software.
2.3. Low-cost systems
Finally, the literature includes some systems close to that proposed in this article, namely, a complete low-cost monitoring system that incorporates software with a user-friendly graphical user interface.
In Singh, Bermudez Contreras, Nazari, Sutherland, and Mohajerani [Citation27], Singh et al. present a low-cost solution for predicting the sleep/wake state of mice in their home cage using only video. The results were validated using hippocampal local field potential (LFP) and electromyography (EMG) data. Their approach provides a lowcost flexible methodology for high-throughput studies of sleep, circadian rhythm, and rodent behaviour with minimal experimenter interference.
In O’Leary, O’Leary, Cryan, and Nolan [Citation28], O’Leary et al. describe a low-cost touchscreen operant chamber that provides an affordable alternative for cognitive testing in a touchscreen operant paradigm for researchers with limited funding.
Sathiya describes, in Narayanan [Citation29], a low-cost system used for analyzing animal stress levels in terms of thermal humidity index. In this system, a PIC microcontroller senses the rumination activity, body temperature, and humidity. It includes a Graphical User interface (GUI), implemented using PHP language.
In Kumari and Yadav [Citation30], Kumari and Kumar present a prototype of a smart animal health monitoring system based on IoT for real-time monitoring of physiological parameters such as body temperature, heart rate, and rumination with surrounding temperature and humidity. The sensors are mounted on the animals’ bodies, providing information related to their health status. The user can easily access such data using the internet and an Android app.
Finally, examples of other low-cost systems not necessarily related to animals are given. In Zhang, Srinivasan, and Ganesan [Citation31], a Raspberry Pi-based indoor air quality monitoring system is presented that measures pollutants such as temperature, relative humidity, Particulate Matter (PM)2.5, PM10, Nitrogen dioxide (NO2), Sulfur dioxide (SO2), Carbon monoxide (CO), Ozone (O3), Carbon dioxide (CO2), and Total Volatile Organic Compounds (TVOCs). In Alarc´on-Paredes, Francisco-Garc´ıa, Guzm´an-Guzm´an, Cantillo-Negrete, Cuevas-Valencia, and Alonso-Silverio [Citation32], an Internet of Things (IoT)-based framework for non-invasive blood glucose monitoring is described using a visible laser beam and a Raspberry Pi Camera, all implemented in a glove. A series of photographs are taken of the user’s fingertip and histograms are computed, which are then processed by an artificial neural network (ANN) in a remote Flask server.
3. System hardware platform
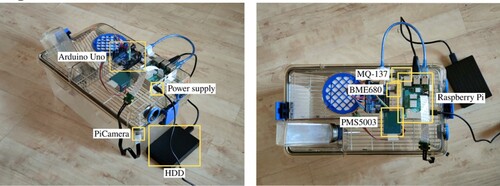
Sensory systems are typically composed of a central processing unit (CPU), sensors, and some kind of connectivity. In this work, the microcontroller Arduino UNO processes the analog signal from the sensors and sends the collected data to a Single Board Computer (SBC), the Raspberry Pi 4 Model B, via USB serial connection. The Raspberry Pi receives the data from the sensors via serial, as well as the frames from the PiCamera via CSI Bus, and send data of sensors via Wi-Fi. The video recorded by the PiCamera will not be retransmitted via WIFI because it is a very expensive operation but will be stored in a Hard Disk Drive (HDD) connected to the Raspberry Pi for later viewing.
In this work, it was decided to use two boards for the following reasons:
Arduino makes it easy to work with analog sensors without the need for a lot of wiring, which simplifies the overall electrical circuit. Also, as this board takes care of the sensor signal processing, it takes computational stress off the Raspberry Pi.
Raspberry Pi lets work with an operating system to perform more complex tasks such as communicating with a web server or recording quality videos 24/7. In addition, as future lines, is intended to apply Deep Learning algorithms to the camera frames to analyze the behaviour of the animals. For all these reasons, a Single Board Computer such as Raspberry Pi is necessary in these cases.
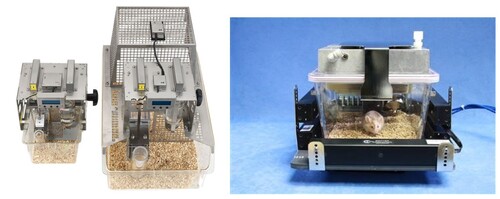
Cage for housing mice (Figure -a) by TecniplastFootnote16 (model 1285L), which is an individually ventilated cage commonly used in biomedical research and is used in the cage racks at the Animal Research Centre of the University of Alcalá (see Figure ).
Arduino Uno (Figure -b). It incorporates the ATmega4809 microcontroller, 14 digital I/O Pins and 6 Analog Input Pins. The microcontroller has 48KB of Flash Memory, 6,144 Bytes of SRAM and 256 Bytes of EEPROM.
Raspberry Pi 4 Model B (Figure -c), as the main low-power consumption (10W max.) board. It incorporates the Broadcom BCM2711 chipset, which includes four ARM Cortex-A72 1.8 GHz 64-bit processing units and 4GB LPDDR4-3200 SDRAM. It also provides wireless and Ethernet LANs, Bluetooth connection, HDMI and jack outputs, and four USB ports.
Rasbperry PiCamera v2.1 (Figure -d, Table ), which includes a Sony IMX219PQ CMOS 8-Mpx sensor and a lens size of 1/4”. It is connected to the Raspberry Pi board through the exclusive CSI bus, obtaining an extremely high data rate.
Arducam extension cable (Figure -e) to make it easier to place the camera into the cage.
MQ-137 sensor (Figure -f). It is connected to the Arduino Uno board and measures the concentration of ammonia (NH3) in the air with a sensitivity of 3%.
Breakout BME680 sensor by Bosch (Figure -g), which contains temperature, humidity, barometric pressure, and VOC (Volatile Organic Compound) gas sensing capabilities. It is connected to the Arduino Uno board and measures humidity with 3% accuracy and temperature with 1C accuracy. The other variables such as pressure or VOC are not used because they are not relevant in animal monitoring according to the Animal Experimentation Centre of the University of Alcalá.
PMS5003 sensor (Figure -h). It is connected to the Arduino Uno board and measures the value of dust particles suspended in the air, providing reliable reading of PM2.5 (particles of 2.5 micrometers in diameter or less measured in g/m3). The sensor uses a laser to detect the number of particles and particle size in the air it collects through a fan.
Figure 7. Block diagram of the system hardware.
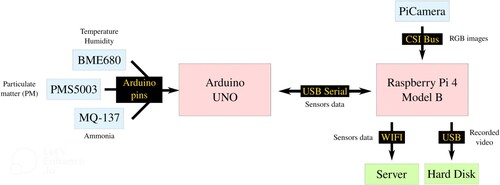
Figure 8. Hardware components: (a) Cage, (b) Arduino Uno, (c) Raspberry Pi, (d) PiCamera, (e) Extension cable, (f) MQ-137, (g) BME680, (h) PMS5003.
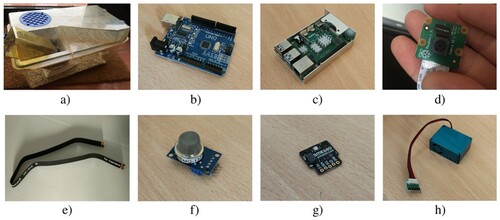
Table 1. PiCamera (v2.1 board) technical intrinsic parameters.
With all the components above, the resulting platform is a low-cost but complete animal monitoring system, and – as can be seen in Figure – it is also completely noninvasive, due to the small size of its components. While a similar system, such as those described in Section 2.1, can cost between e15,000 and e20,000 (and even just a device, such as the Flir camera, costs some e8,000), the cost of the system developed for this work does not reach e1000.
The prototype design (Figure ) is the result of testing different implementations and selecting the best for the common use of a standard mouse home cage, like the one used on the proposed hardware platform, in which all the components are assembled.
Figure 9. Prototype used in the experiments.
The sensors are located inside the cage glued to the lid and the necessary cables were inserted by drilling a hole in the filter of the lid.
The cages have a standard size and are connected to the cage rack ventilation. They should be frequently removed from the rack for animal supervision, feeding, and cleaning. This is why the cabling must not be problematic. In addition, since this system will have several cages working simultaneously, the number of cables will increase and so must be well organized. Taking all this into account, the system is designed in such a way that if the researcher wishes to install the system in another cage, he only has to change the lids, as all the hardware is installed in the cage lid.
4. System software infrastructure
To make the system fully functional, a simple and easy-to-use web server interface was developed (Section 4.1), as well as different scripts for both Arduino and Raspberry Pi to support the multiple sensors and communications (Section 4.2).
4.1. Web server app
The back-end of the web application was developed using the Python Flask 2.2.2 microframework and a SQL database. For the front-end, HTML5, Javascript, CSS, and Boostrap 5.2 web technologies were used. In this work, a local Flask test server was used, but in the future, there are intentions to deploy the web application in the cloud to make it accessible via the Internet.
A login/signup system for users was designed and the application was protected so that it can only be used by users accepted by the system administrator. The Python libraries used were werkzeug, flask-login, and session from Flask.
A Rest API was developed using the flask-restful module to receive data from the monitoring system installed in the cages and store them automatically in the database. The Rest API is protected using JWT tokens with the help of the flask-jwtextended library and there is only one user able to authenticate, in this case, the system installed in the cage. Each of the variables to be measured by the system (ammonia, temperature …) is a Rest API resource that supports an HTTP POST method to receive messages with two variables: value and datetime.
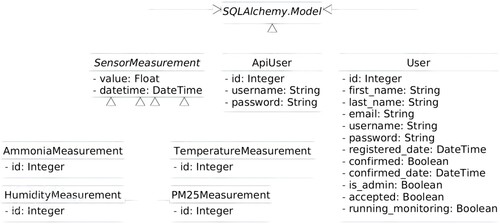
As for the database, this is controlled with the SQLAlchemy module. The database stores all the data received by the sensors, the users registered in the system, and the users who have access to the REST API. Figure shows a Unified Modelling Language (UML) diagram of each of the SQLAlchemy models.
Figure 10. UML diagram of SQLAlchemy models.
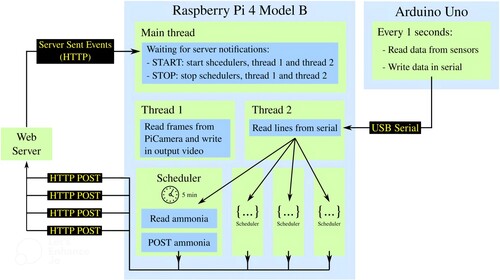
Finally, a notification communication protocol was implemented from the server to the client using Server-Sent Events (SSE) technology. This feature is concretely used to send Start/Stop notifications from the server to the Raspberry Pi so that laboratory animal researchers can start or stop monitoring remotely. In addition, different configuration parameters available in the web application, such as the sensors to be used, the data collection interval, or the desired recording quality of the PiCamera, are also sent via this notification protocol.
4.2. Sensors support
A main Arduino Sketch was developed which is responsible for processing the analog signals from the three sensors in the system (MQ-137, BME680, and PMS5003). The Sketch has the main loop in which it processes the data and sends it to the serial every second in a string with the format ammonia:temperature:humidity:pm25 where each variable separated by “:” is the value thrown by each sensor at that moment. The Adafruit _BME680Footnote17 library was used to obtain values from the BME680 sensor and its calibration is explained in Section 5.2. The PMSFootnote18 library was used to obtain values from the PMS5003 sensor in passive mode. The MQ-137 sensor involves a complex calibration and usage process which is detailed in Section 5.1.
On the Raspberry Pi side, Raspberry Pi Os is the operating system used in this system; it is completely flexible and allows for very little power consumption. It runs installed in a 32Gb Samsung class 10 A1 MicroSD card, due to its high read/write speeds. Different scripts were developed, using the Python language, to handle the following tasks:
The ServerCommunication class developed encapsulates the communication and authentication with the RestAPI of the web server with the help of the Python requests library. It also creates a callback to receive, from the server, the Start/Stop notifications or the configuration parameters selected by the user using the Server-Sent Events (SSE) technology over HTTP. The Python library used as a base was sseclient-py.
The ArduinoSerial class developed encapsulates the serial connection between the Raspberry Pi and the Arduino Uno with the help of the Python pyserial library. This class launches a thread that is responsible for constantly reading the data received through the serial.
The Camera class developed encapsulates all the control of the Raspberry Pi Camera with the help of the Python picamera2 library. The class launches a thread that reads the frames from the camera and records them in an output file that is stored on an HDD connected to the Raspberry Pi. Since long recordings will be made and this implies large file sizes, the user is offered the choice between three recording qualities: high (1640 × 1232px), medium (820 × 616px), and low (410 × 308px). Recording in low quality will make the files much lighter and therefore easier to handle. In addition, there is no loss of field of view if a low recording quality is chosen. It was programmed using the lores stream of the picamera2 library which allows us to reduce the number of pixels in the frames without losing field of view. Section 5.3 shows the size offered by each of the recording qualities.
The main programme launches a blocking callback using the ServerCommunication class that waits for a Start or Stop notification from the server indicating whether to start or stop monitoring. If the start order is received, the script launches a scheduler for each of the variables measured by the sensors (ammonia, temperature, humidity, and PM2.5) which is programmed so that every 5 min, or other user-selected interval time, the last value received by a specific sensor is collected using the ArduinoSerial class and sent to the server database through the Rest API using the ServerCommunication class. The script also initiates video recording using the Camera class if the user chose it in the web application. Finally, in case of receiving a stop notification, it would stop everything mentioned above.
Figure 11. Sensors support diagram.
5. Experiments
Several experiments were carried out to test and demonstrate the correct functioning of the system. As well as experiments necessary during its development to ensure that the system is being developed in the most optimal way possible.
5.1. MQ-137 sensor calibration
The MQ-137 ammonia sensor has a variable resistance that changes its value according to the gas concentration, if the concentration is high the resistance decreases, and if it is low the resistance increases. In addition to this resistor, the sensor includes another resistor called load resistor (RL) which is used to adjust the accuracy of the sensor. According to the datasheet, the sensor has a resistance of 47KΩ, but in this work, it was used a module that incorporates an electronic circuit with a customized load resistor with a value of 1KΩ as indicated in the Master’s thesis Antunes [Citation33].
Knowing all the above, it can be calculated the gas concentration from the variation of the resistance. To do this, the system is continuously guided by the information given in Figure from the datasheet. Figure shows the concentration of a gas in parts per million (ppm), concerning the resistance of the sensor (RS/R0) on a logarithmic scale. RS represents the variable resistance that changes depending on the concentration of a gas and R0 is the known resistance in the fresh air. Therefore, it can be concluded that calibrating the MQ-137 Ammonia sensor consists of finding the value of R0, under fresh air conditions, in the place where it is to be installed.
Figure 12. Sensitivity characteristics of the MQ-137 by the datasheet Hanwei Electronics CO. [Citation35].
![Figure 12. Sensitivity characteristics of the MQ-137 by the datasheet Hanwei Electronics CO. [Citation35].](/cms/asset/26b794c9-ddf5-4ef5-991d-52d6654c5948/taut_a_2331371_f0012_oc.jpg)
The procedure to follow to calibrate the sensor is partially based on the method proposed by Systems [Citation34]. It can be observed, looking at the sensor circuit (Figure ) provided in the datasheet Hanwei Electronics CO. [Citation35], that RS (located in the sensor between A and B) is in series with RL, therefore, using Ohm’s Law (V = I∗R), where V is voltage, I is current and R is resistance, Equation Equation1(1)
(1) can be obtained.
Figure 13. Electric parameter measurement circuit of the MQ-137 by the datasheet Hanwei Electronics CO. [Citation35].
![Figure 13. Electric parameter measurement circuit of the MQ-137 by the datasheet Hanwei Electronics CO. [Citation35].](/cms/asset/9ce14d0e-970b-4404-9857-085548d7bdd7/taut_a_2331371_f0013_oc.jpg)
Equation Equation2(2)
(2) is derived from this, from which the value of RS is obtained, where RL is the load resistance (1KΩ), VC is the input voltage to the sensor (5 V) and VRL is the analog value provided by the sensor and converted to a voltage.
(1)
(1)
(2)
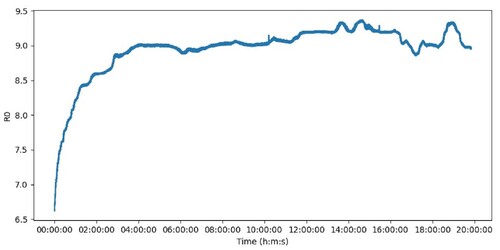
(2) Knowing the value of RS, and to obtain R0, it is used the ratio RS/R0 = 3.6, extracted from Figure , which refers to the fresh air resistance ratio. Because the sensor needs to warm up to function properly, the R0 value was calculated for hours until it stabilized in a certain range. Figure shows this process of heating the sensor and it can be observed that after 4 h the value of R0 has stabilized more or less at 9KΩ. This will therefore be the value of R0 in fresh air for that particular location.
Figure 14. Evolution of the R0 value over time.
Once calibration is complete, reliable values can be obtained from the sensor. This will be done using the NH3 line drawn in Figure . Simply use the equation of this line (Equation Equation3(3)
(3) ) and obtain the ppm value (x-axis) for a value of RS/R0 (y-axis), which is known.
(3)
(3) Therefore, the final equation to obtain a ppm value, after calculating the slope (m) and the intercept (b) of the line (Equation 3), is in Equation 4.
(4)
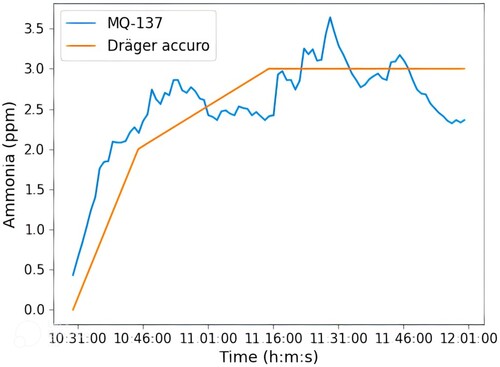
(4) Once the calibration process was completed, it was decided to compare the MQ137 sensor with the Dr¨ager accuroFootnote19 hand pump to validate the correct functioning of the sensor in this work. Dr¨ager accuro is the device currently being used at the Animal Experimentation Centre of the University of Alcalá to measure the ammonia concentration in the cages. It is a completely manual device that consists of activating a pump with the force of the hand so that the device colours a disposable Dr¨ager tube with the amount of ammonia measured. Figure shows the comparison between the MQ-137 sensor and Dr¨ager accuro from data collected during one and a half hours in a cage with five male mice. Due to the conditions of use of the Dr¨ager accuro as described above, it is not possible to collect data every minute as was the case with the system used in this work, but only four data were collected in the entire time span. Even so, Figure shows a great similarity between the two devices, which confirms the good performance of the system of this work in detecting ammonia using the Dr¨ager accuro hand pump as a reference.
Figure 15. Comparison between the MQ-137 sensor and Dr¨ager accuro.
5.2. BME680 sensor calibration
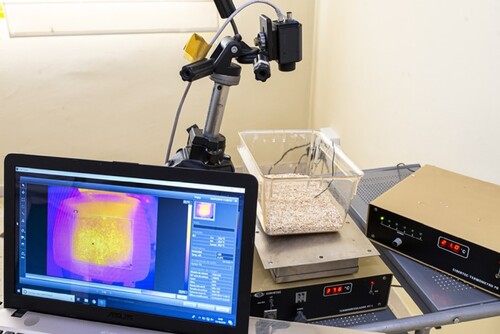
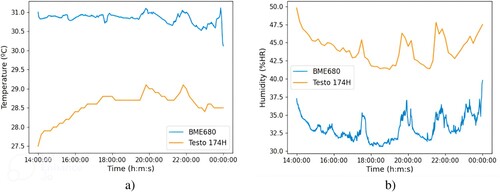
The BME680 sensor provides accurate temperature and humidity measurements (–1”C and –3% r.H). However, after carrying out a validation test comparing the output of the BME680 with that offered by the Testo 174H, a sensor used to control the temperature and humidity of the rooms at the Animal Experimentation Centre of the University of Alcalá, very different results were obtained. Figure shows the temperature and humidity comparison between BME680 and Testo 174H measured in a ventilated cage with five male mice.
Figure 16. Comparison between uncalibrated BME680 and Testo 174H sensors: (a) Temperature, (b) Humidity.
After observing the results in Figure , it was decided to calibrate the BME680 sensor to improve its measurements. The chosen method was the Two-Point Calibration, which involves taking two measurements with the non-calibrated sensor near the lower and upper ends of the measurement range. Additionally, two measurements are taken with a reference instrument. These four points are used to obtain two lines (Figure ) that represent the values of the non-calibrated sensor and the reference instrument. Finally, using Equation Equation5(5)
(5) , the corrected value is obtained.
(5)
(5) The Heraeus T5042Footnote20 oven and the Beko model CA 3200 refrigerator were used for temperature calibration, and the UniProtect NGFootnote21 air flow cabinet was used for humidity calibration which, within all our available material, were the instruments that could provide us with the most accurate reference data. Table shows the temperature and humidity data collected.
Figure 17. Example of Two Point Calibration graph.
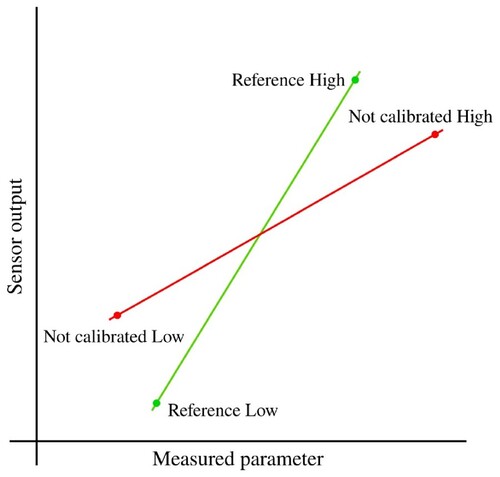
Table 2. BME680 and reference data for Two Point Calibration.
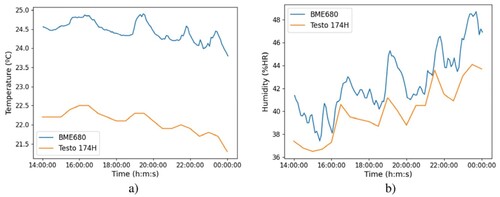
Once calibration was applied to the BME680 sensor using Equation 5, the comparison was repeated with the Testo 174H and it was concluded that the Testo 174H was giving erroneous values because the data did not match the accurately calibrated BME680. Even so, the values of both sensors are closer than in Figure . Figure shows the comparison between the Testo 174H and the calibrated BME680.
Figure 18. Comparison between calibrated BME680 and Testo 174H sensors: (a) Temperature, (b) Humidity.
5.3. Camera placement and sizes of recordings
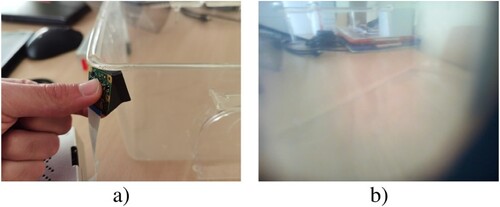
One of the objectives of this work is to minimize alterations to the laboratory animal cages when installing the system. The aim is to make the system compatible with universal cages in any research laboratory with minimal modifications. This means that installing the camera and achieving correct visualization is a complicated challenge.
From the outside of the cage, positioning the camera against the plastic does not give a clear image of what is going on inside the cage (Figure ). To solve this problem, a minimal hole was designed in the corner of the cage to see the inside of the cage through it. After carrying out tests, it can be concluded that it is necessary to make a hole that is too big to not see the edges of the cage, which is unfeasible when altering the cage is not a desirable solution.
Figure 19. Camera outside of the cage.
As an alternative, it was tried to install the camera directly inside, making a hole through which only the camera cable passes but, from this position, it is not possible to get a wide enough angle to see all the animals (Figure ).
Figure 20. Camera inside of the cage.
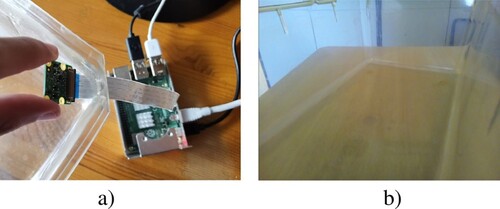
Knowing all of the above, the camera will continue to be kept on the outside of the cage in the way the researcher wants to position it. In this work, it is only used for recording purposes and, therefore, a high-quality image is not necessary. However, thinking about the future lines, in which the video frames will be processed, a 3D piece is being designed and developed. It will let place a low-cost wide-angle camera inside the cage and thus obtain a complete and high quality visualization of the whole cage.
5.4. Long-term test and size of camera recordings
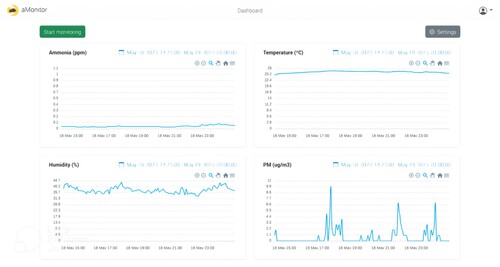
The experiment aims to demonstrate the system’s ability to run continuously for 24 h a day without encountering any errors that could cause it to stop. Figure shows the dashboard of the developed web application, allowing uninterrupted viewing of sensor-collected data for 24 h.
Figure 21. Web app dashboard with sensor data.
Additionally, to predict the size of the video recordings, an experiment was conducted. In this experiment, 1 h of video was recorded using each of the three available recording qualities mentioned in Section 4.2. Table displays the size in megabytes (MB) of 1 h of recording for high, medium, and low quality. For low quality, 1 h of recording consumes 267 MB, resulting in a total of 6,408 MB for a 24-hour recording.
Table 3. Recording sizes for high, medium and low qualities.
5.5. First steps with deep learning
In previous sections it was mentioned that, as future lines, is intended to process the frames collected by the Raspberry Pi Camera using Deep Learning and, in this way, obtain more information about animal behaviour. The detection of mice in real time in video was the first test to be achieved. For this purpose, it was decided to use the TensorFlowFootnote22 library because it offers the option of training different object detection architecturesFootnote23 and, in addition, it has support for embedded systems or systems with few resources with TensorFlow Lite.
To create a training dataset, the camera was placed outside the cage and 103 frames were captured and subsequently labelled with the Roboflow tool.
The first tests started using the Tensorflow Object Detection APIFootnote24, trying different architectures and configurations, always thinking in low-cost models. The problem is that the architecture available with the lowest latency (SSD MobileNet V2 FPNLite 320 × 320) after training it with our dataset and converting it to TensorFlow Lite, only offered a performance of 3.5 frames per second (FPS). Knowing this impediment, it was decided to use an Edge TPU to allow us to run the model inside it. The Google Coral USB Accelerator was used in this work.
The first approach was to run, on the Coral USB, the SSD MobileNet V2 FPN-Lite 320 × 320 model that was previously trained. After following the official Coral and TensorFlow Lite documentation, this was not possible. After performing all the necessary conversions, the model ended up being corrupted and giving erroneous results. Therefore, as an alternative, the process further was to train a TensorFlow Lite model directly.
To train a TensorFlow Lite object detection model, the TensorFlow Lite Model MakerFootnote25 library was used, which offers the possibility of training with EfficientDet-Lite architectures. In this work, EfficientDet-Lite-1 was used because it is the maximum architecture that fits onto the Edge TPU’s onboard memory. In this case, it runs satisfactorily on the Coral USB at 13 FPS on average and gives reasonable accuracy results (Table ). The training set was trained over 100 epochs to ensure robustness and accuracy. In Figure some examples of mice detection can be observed.
Figure 22. Examples of mice detection in test images.
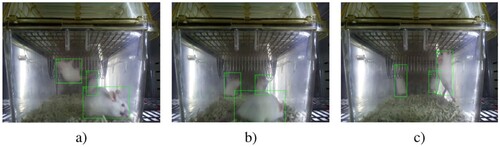
Table 4. EfficientDet-Lite-1 evaluation using COCO evaluation metrics.
6. Conclusions
A non-invasive and cost-effective system for animal monitoring was developed, suitable for deployment in any research facility. This system, built around a Raspberry Pi and Arduino Uno, replaces high-cost monitoring devices with affordable alternatives, ensuring functionality without requiring constant human oversight.
Despite its lower cost compared to market alternatives (detailed in Section 2.1), the system performs comparably in terms of functionality. Its affordability allows laboratories to deploy multiple units, enabling simultaneous monitoring of multiple cages and facilitating more precise experimental conditions.
This innovative system marks a significant advancement in animal monitoring. Continuous monitoring, complemented by visual and auditory alerts, not only improves animal welfare but also enhances the reliability of experiments involving these animals. The system is well-suited for both short-term and long-term studies.
Furthermore, a series of experiments were conducted to validate the system’s functionality, performance, and robustness. As outlined in Section 4, the software infrastructure underwent multiple redesigns to ensure optimal performance for continuous operation and compatibility with the Raspberry Pi ARM chipset, primarily constrained by CPU speed.
Summarizing, this complete monitoring system fulfils the proposed aims:
The system is capable of plausibly monitoring animals, thanks to the PiCamera and the MQ-137, BME680, and PMS5003 sensors.
The PiCamera allows 24/7 video recording to carry out subsequent research on animal behaviour.
The sensors collect data automatically 24/7 instead of researchers having to collect that data with manual sensors every so often.
The resulting prototype is completely non-invasive, due to the minimal size of all devices. Thus, its operation does not affect whatsoever on the animals.
The low cost of this platform will allow many animal research centres that cannot currently afford a single monitoring system to purchase not just one, but several, of these low-cost systems, thus enabling them to carry out more complete and conclusive experiments.
7. Discussion
The conclusions drawn from the study indicate the successful design and implementation of a non-invasive and low-cost system for animal monitoring in any animal research centre. By utilizing a Raspberry Pi as the main board and an Arduino Uno, the system was able to replace expensive monitoring devices with equivalent low-cost alternatives, resulting in a fully-functional system that operates automatically without human supervision.
Despite its lower cost compared to market alternatives, the system demonstrated similar performance and functionality. This affordability allows research laboratories to acquire multiple systems, enabling simultaneous monitoring of several home cages and facilitating more accurate experiments.
The proposed system represents a significant advancement in animal monitoring, as continuous monitoring combined with visual and auditory alarms enhances animal welfare and the reliability of experiments involving animals. The system is well-suited for both short-term and long-term steady studies.
To ensure the system’s functionality, performance, and robustness, a series of experiments were conducted. The software infrastructure underwent several redesigns until it was optimized for continuous 24/7 operation on the Raspberry Pi ARM chipset, considering the limitations imposed by CPU speed.
By offering a cost-effective solution with extensive monitoring capabilities, the developed system opens up possibilities for enhancing animal research and welfare in various laboratory settings. Future work could focus on further improving the system’s functionality, expanding its compatibility with different animal species, and integrating additional features such as artificial intelligence algorithms for advanced data analysis.
Disclosure statement
No potential conflict of interest was reported by the author(s).
Additional information
Funding
Notes
2 http://www.colinst.com/products/clams-hc-comprehensive-lab-animal-monitoring-system-for-home-cages
References
- Fox JG, Bennett BT. Chapter 1 - laboratory animal medicine: historical perspectives. In: JG Fox, LC Anderson, GM Otto, KR Pritchett-Corning, MT Whary, editor. Laboratory animal medicine (Third Edition), American college of laboratory animal medicine. Boston: Academic Press; 2015. p. 1–21.
- Evans I, Thornton H, Chalmers I, et al. (2011). Testing treatments: Better research for better healthcare. Pinter and Martin, 2nd edition. Includes bibliographical references and index.
- Dawkins M. Observing animal behaviour: design and analysis of quantitative data. Observing Anim Behav: Des Anal Quant Data. 2008;1:1–176.
- Reitman ML. Of mice and men – environmental temperature, body temperature, and treatment of obesity. FEBS Lett 2018;592(12):2098–2107. doi:10.1002/1873-3468.13070
- Carbone L. Re.: Russell and burch’s 3rs then and now. J Am Assoc Lab Anim Sci. 2015;54:351–352.
- Council of European Union. (2010). Council regulation (EU) no 2010/63/eu. http://data.europa.eu/eli/dir/2010/63/oj.
- van Vlissingen JF, Borrens M, Girod A, et al. The reporting of clinical signs in laboratory animals. Lab Anim 2015;49(4):267–283. PMID: 25957286. doi:10.1177/0023677215584249.
- Bronstad A, Newcomer CE, Decelle T, et al. Current concepts of harm-benefit analysis of animal experiments - report from the aalasfelasa working group on harm-benefit analysis - part 1. Lab Anim 2016;50(1 suppl):1–20. PMID: 27188275. doi:10.1177/0023677216642398
- Ruxton G. Observing animal behaviour: design and analysis of quantitative data, marian stamp dawkins. Anim Behav. 2008;75:1597–1598. doi:10.1016/j.anbehav.2008.01.003
- OECD. (2002). Guidance document on the recognition, assessment and use of clinical signs as human endpoints for experimental animals used in safety evaluation.
- Orellana-Muriana J. Oxford handbook of innovation, chapter animal models in cancer research: assessment of severity and the application of humane endpoints. animal models of brain tumors. In: Martínez Murillo R, Martínez A, editors. Neuromethods, vol 77. Totowa, NJ: Humana Press; 2012.
- Bugnon P, Heimann M, Thallmair M. What the literature tells US about score sheet design. Lab Anim 2016;50(6):414–417. PMID: 27909190. doi:10.1177/0023677216671552
- Smith D, Anderson D, Degryse A-D, et al. Classification and reporting of severity experienced by animals used in scientific procedures: Felasa/eclam/eslav working group report. Lab Anim 2018;52(1 suppl):5–57. PMID: 29359995. doi:10.1177/0023677217744587
- Cuker A, Arepally G, Crowther MA, et al. The HIT Expert Probability (HEP) score: a novel pre-test probability model for heparin-induced thrombocytopenia based on broad expert opinion. J Thromb Haemostasis. 2010;8(12):2642–2650. doi:10.1111/j.1538-7836.2010.04059.x
- Yates H, Chamberlain B, Baldwin W, et al. Assessing animal emotion and behavior using mobile sensors and affective computing. In: P Mallick, S Borah, editors. Emerging trends and applications in cognitive computing. Hershey, PA, USA: IGI Global; 2017. p. 49–77.
- Voikar V, Gaburro S. Three pillars of automated home-cage phenotyping of mice: novel findings, refinement, and reproducibility based on literature and experience. Front Behav Neurosci. 2020;14:193, doi:10.3389/fnbeh.2020.575434
- Ottoni E. Etholog 2.2: a tool for the transcription and timing of behavior observation sessions. Behav Res Methods. 2000;32:446–449.
- Rodriguez A, Zhang H, Klaminder J, et al. Toxid: an efficient algorithm to solve occlusions when tracking multiple animals. Sci Rep. 2017;7:14774–14782. doi:10.1038/s41598-017-15104-2
- Rodriguez A, Zhang H, Klaminder J, et al. Toxtrac: a fast and robust software for tracking organisms. Methods Ecol Evol. 2018;9:460–464. doi:10.1111/2041-210X.12874
- Aguiar P, Mendonca L, Galhardo V. Opencontrol: a free opensource software for video tracking and automated control of behavioral mazes. J Neurosci Methods. 2007;166(1):66–72. doi:10.1016/j.jneumeth.2007.06.020
- Meyer T, Constantinidis C. A software solution for the control of visual behavioral experimentation. J Neurosci Methods. 2005;142(1):27–34. doi:10.1016/j.jneumeth.2004.07.009
- Yoshikawa T, Fyall A, Green J, et al. Refinement of the CNS-FOB method via the use of automated noldus EthoVision® XT 7.0 video-tracking system in rats. J Pharmacol Toxicol Methods. 2011;64(1):e20–e21. Eighth Annual Focused Issue on Methods in Safety Pharmacology. doi:10.1016/j.vascn.2011.03.075
- Nath T, Mathis A, Chen AC, et al. Using deeplabcut for 3d markerless pose estimation across species and behaviors. bioRxiv. 2018;1.
- P´erez-Escudero A, Vicente-Page J, Hinz R, et al. Idtracker: tracking individuals in a group by automatic identification of unmarked animals. Nat Methods. 2014;11.
- Sridhar VH, Roche DG, Gingins S. Tracktor: image-based automated tracking of animal movement and behaviour. Methods Ecol Evol. 2019;10(6):815–820. doi:10.1111/2041-210X.13166
- Dunn T, Marshall J, Severson K. Geometric deep learning enables 3d kinematic profiling across species and environments. Nat Methods. 2021;18(5):564–573. doi:10.1038/s41592-021-01106-6
- Singh S, Bermudez Contreras E, Nazari M, et al. Low-cost solution for rodent home-cage behaviour monitoring. PLoS One. 2019;14:e0220751.
- O’Leary J, O’Leary O, Cryan J, et al. A low-cost touchscreen operant chamber using a raspberry pi. Behav Res Methods. 2018;50.
- Narayanan LS. Animal health monitoring system using raspberry pi and wireless sensor. Int J Sci Res Educ. 2015;3.
- Kumari S, Yadav SK. Development of iot based smart animal health monitoring system using raspberry pi. Int J Adv Stud Sci Res. 2018;3.
- Zhang H, Srinivasan R, Ganesan V. Ecodesign strategy for demand-oriented electrical and electronic products. Sustainability. 2021;13(1):24, doi:10.3390/su14010024
- Alarcón-Paredes A, Francisco-García V, Guzmán-Guzmán IP, et al. An iot-based non-invasive glucose level monitoring system using raspberry pi. Appl Sci. 2019;9(15.
- Antunes, A. M. S. (2019). Development of an ammonia portable low-cost air quality station. Master’s thesis, Universidade de Lisboa.
- Systems J. (2023). Jaycon systems. Accessed on 03-01-2023.
- Hanwei Electronics CO L. (2023). Datasheet mq-137. Accessed on 03-01-2023.