
 ?Mathematical formulae have been encoded as MathML and are displayed in this HTML version using MathJax in order to improve their display. Uncheck the box to turn MathJax off. This feature requires Javascript. Click on a formula to zoom.
Abstract
During the packaging process, it is essential to detect the steel stamping characters inside the box to identify any missing or repeated characters. Currently, manual detection suffers from low efficiency and a high false detection rate. To address these challenges, a steel stamping character recognition and analysis system based on machine vision has been developed. The enhanced YOLOv7 detection method was employed for character identification, complemented by a statistical analysis approach to achieve automated judgment and detection. To address the issue of size disparity between large and small characters, a small size anchor box and a larger detection head were integrated. Furthermore, modifications were made to the output structure of the YOLOv7 prediction network to enhance multi-scale detection capabilities. The inclusion of the location attention convolution module bolstered global feature extraction, thereby enhancing the detection accuracy of similar characters. Moreover, the utilization of a hash table was used to improve the efficiency of mapping steel stamping character recognition sequences. The experimental results demonstrate that the enhanced model achieves an accuracy of 99.83%, with a processing efficiency of 10.5 ms per single frame. These findings align with the performance criteria for automatic recognition and analysis of steel stamping characters.
1. Introduction
Currently, the utilization of machine vision detection technology in industrial production and inspection process is becoming increasingly widespread. It plays a critical role in improving production efficiency, reducing costs and maintaining product quality standards. As image processing algorithms continue to demonstrate improved detection capabilities and hardware performance achieves breakthroughs, the deployment cost of machine vision systems has significantly decreased. This reduction has accelerated the adoption and proliferation of machine vision systems in various sectors such as spare parts assembly [Citation1], electronics manufacturing [Citation2], food inspection [Citation3], packaging [Citation4], industrial robotics [Citation5] and beyond.
Recent rapid advances in deep learning technology have opened up new perspectives and avenues for industrial machine vision detection [Citation6]. Among these, object detection methods [Citation7] have gained significant traction in engineering endeavours due to their broad applicability and straightforward implementation. Prominent object detection network architectures include the well-known YOLO series [Citation8–10].
Moreover, the integration of deep learning with traditional machine vision has garnered significant attention. For instance, a research paper proposes a recognition method that combines deep learning and multi-signal fusion [Citation11]. Another study establishes a deep learning model for recognizing the wear state of milling cutters [Citation12], specifically designed to extract character information from complex structures. Machine learning also boasts extensive applications in the realm of materials science. Notably, Hao Wang and his colleagues achieve high predictive accuracy in Time-Temperature-Transformation (TTT) diagrams of stainless steel through a combination of machine learning algorithms [Citation13] and develop a comprehensive machine learning model for predicting TTT diagrams of high-alloy steels by integrating Random Tree, Random Forest, Bagging, k-Nearest Neighbor, and Random Committee techniques [Citation14]. Furthermore, a scholarly article [Citation15] introduces a hybrid machine learning model for forecasting the phase transformation temperature and hardness of low alloy steel, achieving a remarkable classification model accuracy of up to 100%. Likewise, another research endeavour [Citation16] employs various machine learning approaches to determine an appropriate model for predicting SH-CCT diagrams for Ni-Cr–Mo steels, demonstrating strong agreement with experimental data, as evidenced by a robust correlation coefficient and minimal error value. Additionally, deep learning finds widespread application in diverse fields such as medicine [Citation17], agriculture [Citation18], energy [Citation19], and beyond. However, when faced with specialized application scenarios featuring complex backgrounds, substantial variations in target changes, and diverse detection requirements, attaining optimal detection results using a uniform deep learning network model algorithm proves challenging. Consequently, adapting and enhancing the network model to cater to different detection needs becomes imperative to ensure more effective detection outcomes.
Steel stamping is a widely used for engraving individual numbers, letters, or special symbols on nameplates, metalwork, ornaments, and various objects. During the production process, steel stamps of diverse characters and sizes are collated and packed into boxes based on specific product specifications. Subsequently, the steel stamping characters within each box undergo verification to identify any potential omissions or duplicates. With more than a dozen product specifications for steel stamping, each specification entails a distinct set of steel stamping characters, leading to a substantial verification workload. Currently, manual inspection remains the predominant method for steel stamp verification in the majority of production enterprises, with some companies resorting to multiple verification processes, ultimately resulting in escalated labour costs and diminished productivity.
In response to these challenges, this paper presents a machine vision approach for automated recognition and analysis of steel stamping characters. Firstly, a machine vision image acquisition system was developed to establish a comprehensive dataset, involving the design of an optimal lighting scheme tailored to the stamping material and the capture of sample images under varied conditions. Secondly, the YOLOv7 object detection network [Citation20] was employed to train the model for recognizing steel stamping characters. To address the size disparity between large and small characters, a small anchor box and a large-scale detection head were integrated, accompanied by modifications to the output structure of the YOLOv7 prediction network. Thirdly, to mitigate issues related to misrecognition of similar characters, a location attention convolution module was introduced to enhance global feature extraction and improve the accuracy of detecting similar characters. Lastly, to tackle the challenge of traversing characters with high statistical time complexity, a hash table with low complexity was implemented to enhance the mapping efficiency of sequences for steel stamping character recognition. The proposed enhanced method for steel stamping character recognition based on YOLOv7 and the utilization of a hash table for statistical analysis of characters contribute to automated character recognition and detection, thereby boosting production efficiency and reducing labour costs.
2. Components of steel stamping detection system and data set
2.1. Structure of steel stamping visual detection equipment
The steel stamping visual detection equipment comprises an equipment rack, an image acquisition unit, a character recognition and analysis unit, a human–computer interaction unit, and other essential components. The image acquisition unit is composed of an industrial camera, an industrial lens, a flat light source, and a light source controller, as illustrated in Figure .
Figure 1. Structure of steel stamping character visual detection equipment. 1. Rack 2. Industrial Lens 3. Industrial Camera 4. Light Source Controller 5. Character Recognition and Analysis Unit 6. Flat Light Source 7. Detection Workbench 8. Touch Screen.
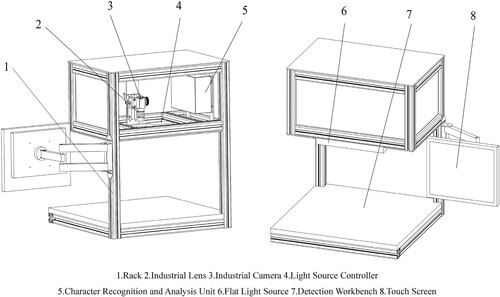
The equipment rack is constructed using aluminum alloy profiles and sheet metal parts, housing the electric control box, testing table, brackets, and additional elements. Within the electric control box are the image acquisition unit and the character recognition and analysis unit. The industrial camera utilized in the image acquisition unit is the Hikvision MV-CA016-10GM, boasting a resolution of 1440 × 1080 pixels. The MVL-MF1618M-5MPE lens features a focal length of 16 mm. The flat light source measures 320 mm x 240 mm, while the light source controller, MV-LE100-120W24-4D, operates at 120W and 24 V.
The character recognition and analysis unit for steel stamping comprise character detection using the YOLOv7 model and character sequence sorting analysis employing a hash table. This unit runs on an industrial control computer with GPU hardware acceleration and interfaces with a PLC control system equipped with an automatic feeding conveyor and an infrared trigger sensor. As the conveyor delivers steel stamping products to the detection workbench, the infrared sensor triggers the PLC control system to prompt the industrial camera to capture images. These images are then processed by the steel stamping character model for detection, with the recognized character sequence subsequently outputted. The identified character sequence undergoes sorting analysis to ascertain its conformity. Product specification information is configured via the software interface, with the specification parameters remaining consistent for each batch of products.
2.2. Flow of steel stamping character visual detection system
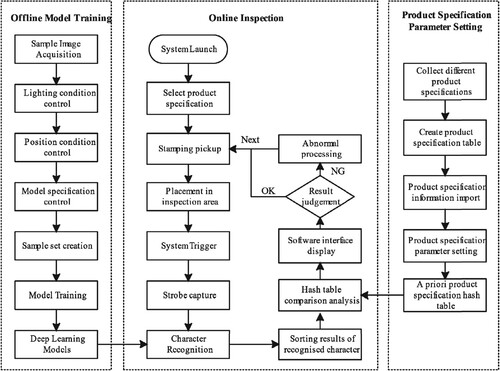
The steel stamping character visual detection system comprises three main components: offline model training, product specification parameter setting, and online detection, as depicted in Figure .
Offline Model Training: This initial stage involves creating a dataset of steel stamping samples and conducting model training. The dataset is generated by producing steel stamping samples, which are then utilized for offline model training with the aim of developing a recognition model for steel stamping characters.
Product Specification Parameter Setting: In this phase, product specification parameter setting entails collecting and inputting information regarding existing product specifications. The system processes the imported product specification data to create a priori product specification hash table. Product specifications can be selected and configured through the software interface.
Online Detection: Online detection encompasses the recognition and analysis of steel stamping characters in real-time. Upon the arrival of a steel stamping product at the designated detection area, the system activates the light source and industrial camera to capture images. Subsequently, the system utilizes the offline training model file for image recognition and produces the character recognition sequence. This sequence is then compared against the priori product specification hash table for judgment processing. Consistency between the character recognition sequence and the priori product specification indicates the correctness of the current steel stamping combination; any disparities signify an abnormal combination. Anomalous characters are flagged, and both the image and judgment results are displayed on the software interface for review.
Figure 2. Flow chart of recognition and analysis system of steel stamping character.
2.3. Steel stamping character data set
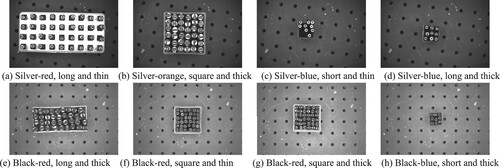
There are over a dozen distinct product specifications for steel stamping. This study gathers eight representative types of specifications, each varying in factors such as metal surface painting, type and size of character mold utilized. Table presents the specifics of each product specification along with the corresponding number of collected samples.
Table 1. Stamp product specifications and image numbers.
To accommodate the practical detection environment in the field, various image acquisition schemes have been devised. These schemes encompass four key elements: steel stamping product specifications, placement position, placement angle, and light intensity.
Steel stamping product specifications: The steel stamping production specifications consist of eight distinct types (refer to Figure ).
Placement position: The placement position of the steel stamping production is classified into nine categories, spanning the entire image field of view. These positions include upper left, upper middle, upper right, middle left, centre, middle right, lower left, lower middle, and lower right.
Placement angle: The steel stamping productions are randomly positioned at angles ranging from 0 to 360 degrees.
Light intensity: The light intensity is regulated using a light source controller within the parameter range of 0 to 255, segmented into five levels: 50, 100, 150, 200, and 255. A lower value indicates darker illumination, whereas a higher value signifies brighter lighting conditions.
Figure 3. Sample images of steel stamps in different specifications. (a) Silver-red, long and thin (b) Silver-orange, square and thick (c) Silver-blue, short and thin (d) Silver-blue, long and thick (e) Black-red, long and thick (f) Black-red, square and thin (g) Black-red, square and thick (h) Black-blue, short and thick.
By amalgamating these four criteria, a total of 3199 sample images have been amassed. This comprehensive dataset enables robust analysis and effective training of the steel stamping visual detection system.
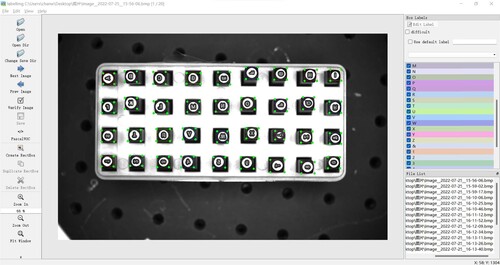
Upon sample collection, LabelImg was employed as the tool for sample production. Each sample undergoes labelling using a horizontal rectangular box assigned to each character. Within this rectangular box, numbers, letters, or symbols are annotated to correspond with the respective character. For instance, if the steel stamping character model is “M”, the corresponding label for the character will be denoted as “M”, as illustrated in Figure .
Figure 4. The tool LabelImg to label steel stamping characters.
Subsequently, the dataset of 3199 steel stamping samples was randomly partitioned into training, validation, and test sets in a ratio of 7:2:1. The distribution of image samples across the sets is as follows:
Training set: 2239 images
Validation set: 640 images
Test set: 320 images
2.4. System design and deployment considerations
Ethical considerations, data privacy, and potential biases play a pivotal role in the deployment of machine vision systems, particularly within industrial settings. Upholding responsible and ethical practices is essential to safeguard individuals’ rights, prevent discrimination, and uphold trust in these systems. Key ethical considerations encompass minimizing harm, averting unfair discrimination, and upholding privacy rights. Machine vision systems heavily rely on extensive visual data for training and operational purposes, raising concerns about inadvertent bias absorption from the training data, potentially resulting in biased outcomes.
In this study, the data under scrutiny pertains to various types of steel stamping characters, devoid of personal images, identifiable information, or sensitive business data. Ensuring a diverse representation of steel stamping products and a balanced distribution of classes within the dataset further mitigates biases. The deployment of the detection system is confined to a single device interfacing with the internal production management system, with no integration of data into external networks. Consequently, meticulous consideration of these factors has guided the design and implementation of the machine vision detection system, aligning with applicable requirements and ethical standards.
3. Steel stamping recognition and analysis methods
3.1. Enhanced YOLOv7-based steel stamping character recognition method
The rationale behind improving the algorithm model stems from various considerations. Firstly, in actual system deployment, fixed camera and lens parameters constrain modifications to the captured image's field of view. Additionally, significant size discrepancies exist among different steel stamping characters, with smaller characters being prone to recognition errors. To address these challenges, the network model incorporates small-size anchor boxes and large-scale predictions. Furthermore, enhancements are made to the output structure of the YOLOv7 prediction network to boost the model's multi-scale detection capabilities and enhance prediction performance, particularly for small-size character models.
3.1.1. Enhancement of small-size anchor box
Anchor boxes serve as representations of the actual label positions of target objects within the dataset. The alignment between preset anchor boxes and real label boxes crucially impacts the model's prediction and regression accuracy. To enhance this alignment, the K-Means clustering method [Citation21] is employed for statistical clustering on the dataset samples.
Upon comparing different sets of anchor box sizes, it is observed that compared to the four sets of anchor box sizes, the existing three sets lack data on small-sized anchor boxes (as depicted in Table ). Consequently, the coverage of real label box data in the samples is compromised. As a remedy, the original three sets of anchor boxes are expanded to four sets, introducing small-size preset anchor boxes to enhance alignment with the real label box positions.
Table 2. Anchor box sizes of steel stamping samples.
3.1.2. Enhancement of large-scale feature prediction
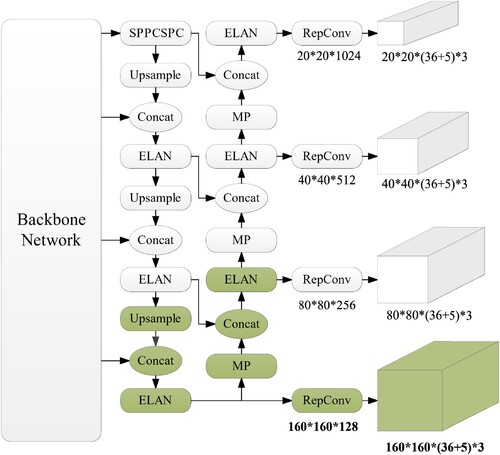
In order to complement the small-size anchor boxes, a large-scale feature prediction structure is introduced to both the bottleneck and prediction network. Building upon the original scales of 20 × 20, 40 × 40, and 80 × 80, a 160 × 160 large-scale prediction header is incorporated to enhance feature extraction capabilities for small-size targets.
Illustrated in Figure , within the bottleneck network, additional modules are integrated, including the UpSample module, Concat feature splicing module, and ELAN (Extended Efficient Layer Aggregation Network) module [Citation20]. Following traversal through the ELAN module, the network diverges into branches. One branch undergoes reparameterization via the RepConv convolution module [Citation22] to derive large-scale prediction features sized at 160 × 160 × (36 + 5) × 3. Simultaneously, the other branch proceeds through the MP (MaxPooling) downsampling module, Concat feature splicing module, and ELAN module to yield three scale prediction features of 80 × 80, 40 × 40, and 20 × 20. Notably, Figure showcases the structural depiction of the large-scale feature prediction network implemented in this study, denoted by the green background blocks.
Figure 5. Enhanced YOLOv7 structure of large-scale feature prediction network.
3.1.3. Location attention module
Despite advancements, challenges persist due to factors like metal material variations, processing techniques, character mirror effects, leading to issues such as similar character appearances and subtle feature discrepancies. Notably, common recognition interferences include confusions between characters like “1” and “I”, “7” and “T”, “5” and “S”, “W” and “M”, among others. To mitigate these challenges, this study delves into the shared disparities among similar characters, pinpointing differences predominantly in localized regions. Consequently, the conclusion is drawn that enhancing features in specific areas can bolster the model's ability to differentiate similar characters, elevating overall detection accuracy.
Building on the aforementioned analysis outcomes and leveraging the existing feature enhancement module, this paper advocates for the integration of the CA (Coordinate Attention) location attention mechanism [Citation23] to refine the differentiation and recognition of similar characters. The CA location attention module encodes one-dimensional features across horizontal and vertical spatial dimensions while preserving critical location details.
By amalgamating spatial positional data from each channel feature, it generates spatially selective attention features, amplifying location-aware characteristics. Through this process, the CA location attention convolution module is introduced and seamlessly integrated into the YOLOv7 feature extraction backbone network. This strategic addition enhances local character feature representations, consequently enhancing the discrimination capability of similar characters. The network structure of the CA location attention convolution module is depicted in Figure .
Figure 6. Network structure of CA location attention convolution module.
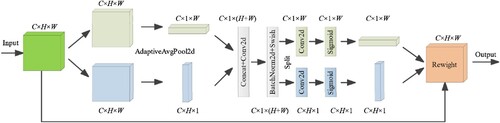
The input feature map possesses dimensions C × H × W. Initially, global average pooling (AdaptiveAvgPool2d) is implemented using pooling kernels of dimensions H × 1 and 1×W, yielding horizontal coded features with dimension C × 1×W and vertical coded features with dimensions C × H × 1, respectively. Subsequently, the coded features from both directions are concatenated (Concat), followed by sequential processing through a convolution module (Conv2d), batch normalization module (BatchNorm2d), and activation function module (Swish). This sequence produces a feature map with dimensions C × 1 × (W + H). The ensuing step involves splitting (Split) the feature map based on the original height and width parameters, resulting in two distinct feature maps post-split: C × 1×W and C × H × 1. Subsequent operations entail performing 1 × 1 convolution and applying the activation function (Sigmoid). Ultimately, attentional weights in both height and width directions are multiplicatively applied (Reweight) to the original feature map with dimensions C × H × W. The final output comprises a feature map incorporating attentional weight information, aligning its dimensions with those of the initial input feature map.
3.2. Statistical analysis method based on hash table
Upon predicting the steel stamping image, the improved model generates an unordered sequence of character recognition results denoted as X. To ascertain any disparities between this unordered sequence X and the predetermined ordered sequence Y of steel stamping characters, a data comparison process is initiated to detect potential omissions or duplications. In a bid to streamline the efficiency of comparing X and Y, this study employs a hash data structure to establish a hash table corresponding to the priori sequence Y. The character labels within the predicted sequence X are meticulously mapped to the predetermined sequence Y. This mapped data undergo accumulation and a single traversal to facilitate differential statistics calculation with a time complexity of O(n). The detailed algorithmic implementation unfolds as follows:
Step 1: Select the product specification and create a hash table for the predetermined sequence Y, tailored to the current product's character count. Initialize mapping data to 0.
Step 2: Acquire images for model prediction to generate the predicted sequence X.
Step 3: Initiate loop traversal with index i set to 0, iterating through the predicted sequence X.
Step 4: Retrieve the label of the i-th character in X, denoted as X[i].
Step 5: Utilize X[i] to locate the corresponding mapping data Y[X[i]] in the hash table for the sequence Y.
Step 6: Aggregate the mapping data Y[X[i]] by incrementing it by 1 in the hash table.
Step 7: Increment traversal index i by 1. If traversal is complete, proceed to step 8; else, return to step 4.
Step 8: Capture mapping statistics for each character from the hash table.
Step 9: Evaluate the mapping data within the hash table: absence of data (0) denotes a missing character, presence of data (1) signifies a normal character, while data exceeding 1 indicates character duplication.
4. Experimental results analysis and system implementation
4.1 Model training environment
The training environment for the steel stamping character dataset comprises:
Operating System: 64-bit Ubuntu 18.04
Processor: Intel Core [email protected] GHz with 20 cores
RAM: 32GB
Graphics Card: NVIDIA TITAN RTX with 24GB video memory
Deep Learning Framework: YOLOv7 with preloaded weights
Number of Batch Images: 24
Model Input Image Size: 640 × 640 pixels
Backpropagation Optimizer: Stochastic Gradient Descent (SGD)
Initial Learning Rate: 0.01
Cosine Annealing Parameter: 0.1
Image Preprocessing Enhancement Factor: 1.0
4.2. Experimental results and analysis
4.2.1. Experimental results of enhanced YOLOv7-based steel stamping character recognition method
In order to evaluate the efficacy of the enhanced large-scale feature prediction and integration of the CA positional attention module, this study undertakes a comprehensive quantitative and qualitative analysis of the improved method's performance. The assessment encompasses model evaluation metrics and practical test outcomes. Experimental datasets encompass YOLOv7 model training data, data post-enhanced large-scale feature prediction, data post-CA positional attention module inclusion, and data reflecting the amalgamation of both enhancements. Detailed experimental results are presented in Table .
Table 3. Experimental results of improved YOLOv7-based steel stamping character recognition method.
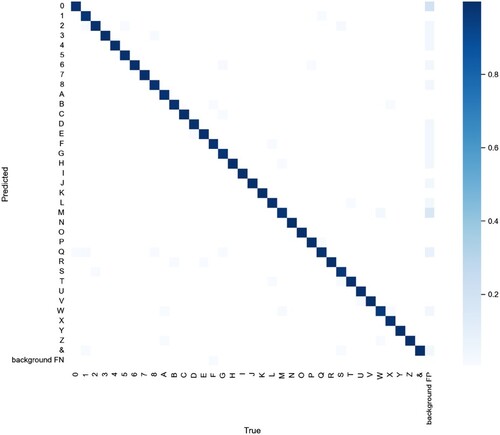
Figure illustrates the confusion matrix encompassing the steel stamping character classes, totalling 36 distinct classes inclusive of numbers 0-8, capital letters A-Z, and the special symbol “&”. Within the confusion matrix, the X-axis denotes the true class labels, while the columns represent predicted classes. Instances labelled as background FN signify non-recognition instances. The colour intensity within the matrix delineates the associated probabilities for each class: darker shades correspond to higher probabilities assigned. For instance, considering class “8”, the intersection between the true class and the predicted class exhibits the darkest colour, indicating the highest likelihood of accurate identification for class “8”. Notably, Figure portrays a clustered distribution along the diagonal axis across all classes, underscoring the improved model's adeptness in effectively fulfilling detection tasks for individual classes.
Figure 7. Confusion matrix of the steel stamping character classes.
Impact of enhanced large-scale feature prediction:
Concerning model evaluation metrics, the inclusion of large-scale feature prediction results in a recall rate (mr) of 99.1% and a model precision (mp) of 99.0%. This enhancement represents an increase of 0.8 and 0.4 percentage points, respectively, compared to the original model. Notably, the more substantial improvement in recall rate than in precision signifies enhanced coverage across different character sizes by the model.
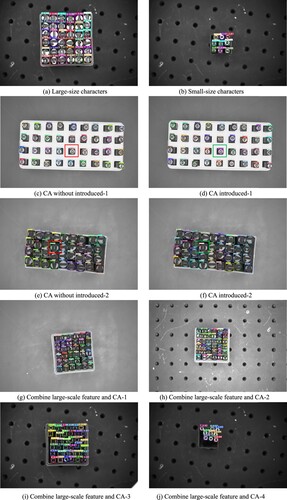
In terms of actual test results, depicted in Figure (a)-(b), proficient recognition of both large-size and small-size characters is accomplished within the same field of view. These empirical findings corroborate the observed trends in the evaluation metrics data, thus affirming the efficacy of the enhancement.
Figure 8. Enhanced recognition performance of steel stamping characters utilizing improved YOLOv7.
Introduction of CA location attention effect:
Regarding the model evaluation metric, the model precision (mp) rises to 99.3%, surpassing the original model by 0.7%, while the recall rate (mr) remains relatively stable.
Analysis of actual test results in Figure (c)-(f) reveals that in the absence of the CA location attention module, the character “M” in Figure (c) is misclassified as “N”, and the character “7” in Figure (e) and 8(f) is also inaccurately identified as “N”. However, upon integrating the CA location attention module, both the character “M” in Figure (d) and the character “7” in Figure (f) are correctly recognized. These test outcomes underscore the capacity of the CA location attention module to enhance the recognition performance of similar characters, aligning with the accuracy trend observed in the evaluation metric.
Combined impact of enhanced large-scale feature prediction and CA location attention:
The model precision (mp) is 99.2%, and the recall rate (mr) is 99.3%, aligning with the individual enhancements when introduced separately.
Figure (g)-(j) showcase improved recognition for both large and small-sized characters, as well as similar characters.
In conclusion, upon analyzing the model evaluation metric data and comparing actual test results, it can be deduced that the enhancement of large-scale feature prediction alongside the introduction of the CA location attention module boost the recognition performance of small-sized characters and enhance differentiation capability for similar characters. This validation underscores the effectiveness of the proposed model improvement in this study for the precise recognition of steel stamping characters.
4.2.2. Comparison of various model experiments
To further substantiate the efficacy of the proposed enhanced method for steel stamping character recognition, a comparative analysis was conducted using the same dataset against other object detection models. This comparison included widely employed models such as Faster R-CNN, SSD, YOLOv3, YOLOv5, and the original iteration of YOLOv7. By scrutinizing the experimental outcomes presented in Table , it is evident that the method proposed in this study outperforms other object detection techniques in terms of key performance metrics such as precision and recall on the specified dataset.
Table 4. Experimental results of the enhanced YOLOv7 and other object detection algorithms.
4.2.3. Validation and efficiency assessment of hash table statistical analysis method
In order to validate the effectiveness and operational efficiency of the statistical analysis method for hash table character sequences, this study conducts comparative experiments employing three distinct statistical methods. The first method adopts a nested double-loop statistical approach, where the outer loop signifies the sequence of predicted results and the inner loop represents the sequence of a priori character types. The second method employs a single-loop statistical approach, involving traversing the predicted result sequence once to tally the occurrences of each character stored in an array. The third method leverages the hash table statistical method proposed in this study, entailing a single traversal of the predicted result sequence, identification of the corresponding hash table, and subsequent data statistics on character mapping.
To ensure the validity of the comparative experiment, all three methods are evaluated using a standardized character sequence encompassing characters from 0 to 8, A to Z, and the symbol “&”, totalling 36 characters. Subsequently, two irregular characters are introduced by altering the font “Q” to “O” and transforming “3” into “8”. To accentuate the operational efficiency disparity among the three methods, the number of statistical cycles is fixed at 10,000. Each method is tasked with identifying missing and recurring characters, with the statistical outcomes presented in Table . The results demonstrate that all three statistical methods proficiently discern the missing and recurring characters, affirming their efficacy in character analysis.
Table 5. Results of hash table statistical analysis method and alternative statistical approaches.
Regarding operational efficiency, the hash table statistical method exhibits a time complexity of O(n) and consumes a mere 0.174 s. This method notably outperforms the nested double-loop statistical approach and surpasses the single-loop statistical method by more than 1 fold, underscoring the superior efficiency of the hash table statistical methodology.
4.3. Implementation of steel stamping visual detection system
4.3.1. Steel stamping visual detection and analysis software
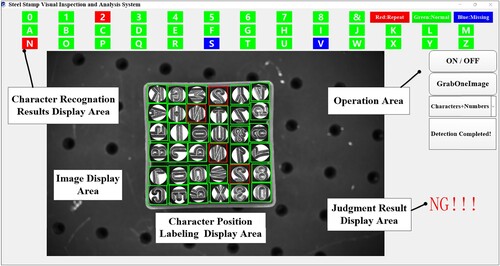
The steel stamping visual detection and analysis software encompasses image acquisition, character recognition, character sequence sorting statistical analysis, database storage, and other vital functionalities. The software interface comprises five primary sections: character recognition results display area, image display area, position labelling area, operation area, and judgment results area.
The character recognition results display area showcases outcomes derived from the hash table statistical analysis of the character sequence. It employs three distinct background colours to signify the frequency of each character. A green background indicates a character occurring once, blue denotes characters occurring less than once, and red highlights characters appearing more than once. This section facilitates swift identification of missing or duplicated characters.
The image display area presents the current test image, while the position labelling area delineates the locations of recognized characters within the image. Anomalies are highlighted with a red rectangular box, whereas normal characters are denoted by a green rectangular box. This feature aids in pinpointing the positions of irregular characters effectively.
The operation area enables the selection of steel stamping product specifications and offers control functions for the system. Meanwhile, the judgment results area exhibits the current test product recognition outcomes. A display of “OK” signifies normalcy across all tests, whereas the presence of an abnormal character prompts the display of “NG”. For instance, as illustrated in Figure , characters such as “S” and “V” are depicted with a blue background to indicate their absence, while characters like “2” and “N” are flagged with a red background to denote repetition. Simultaneously, the image display area showcases red rectangular boxes marking the positions of each irregular character.
Figure 9. Software interface of the steel stamping visual detection and analysis system.
4.3.2. Online testing of the steel stamping visual detection system
During the online detection phase, 100 units each of eight distinct steel stamping product specifications are randomly sampled from the qualified production batch, amounting to a total of 800 identified and analyzed qualified steel stamping products by the system. Each product corresponds to one of the available eight specifications and undergoes recognition and analysis within the system. The recorded recognition data for each product encompasses the count of accurately recognized characters, missed characters, and erroneously detected characters.
As depicted in Table , the analysis reveals that among the 800 randomly selected qualified steel stamping products, constituting a cumulative total of 20,700 characters, no characters are missed during the recognition process, signifying comprehensive character recognition by the system. However, there are 35 instances of misdetected characters, indicating errors in the system's classification of character types. Upon statistical scrutiny of the online test findings, it is determined that the overall accuracy rate for steel stamping characters stands at an impressive 99.83%. This underscores the system's adherence to requisite performance standards for real-time online testing.
Table 6. Online test results of steel stamping products.
5. Conclusion
This study introduces a steel stamping detection and analysis system based on machine vision technology to achieve efficient and precise detection as well as statistical analysis of steel stamping characters. The system integrates the enhanced YOLOv7 method with the hash table statistical analysis approach to automate the recognition and analysis of steel stamping characters.
To address challenges related to variations in the sizes of steel stamping characters, a small-size anchor box and a large-scale detection head are added. Furthermore, an improved YOLOv7 prediction network output structure is proposed to enhance the model's multi-scale detection performance. To mitigate issues arising from recognition interference among similar characters, the CA location attention convolution module is introduced to augment the model's accuracy in differentiating similar characters. The model achieves a precision rate of 99.2%, with a single-frame image inference duration of 10.2 ms, meeting stringent real-time operational requirements.
Subsequently, a steel stamping visual detection system is designed and developed. Through online testing, the character recognition accuracy of the proposed visual detection method reaches 99.83%, fulfilling the performance benchmarks for automated detection and analysis of steel stamping characters.
In the next phase, we plan to develop an automated product loading and sorting system employing a six-axis robotic arm. Integration of the visual steel stamp character recognition and detection system proposed in this study into the system will facilitate automated sorting operations. By executing hand-eye calibration, the conversion of the image coordinate system to the robot coordinate system will be accomplished. Ultimately, the robot gripper will be deployed to identify and replace abnormal characters with normal ones, streamlining the automation of steel stamping product sorting processes.
Disclosure statement
No potential conflict of interest was reported by the author(s).
Additional information
Funding
References
- Bo H, Fei Z, Jia W, et al. Research on automatic assembly system based on machine vision. Manuf Technol Machine Tool. 2022;9:117–122.
- Yiquan W, Langyue Z, Yubin Y, et al. Research status and the prospect of PCB defect detection algorithm based on machine vision. Chin J Sci Instrum. 2022;43(08):1–17.
- Dan L, Ping L, Dongtai L, et al. Integrated inspecting and grading system of the egg quality based on machine vision. J Chin Inst Food Sci Technol. 2020;20(11):247–254.
- Yaonan W, Xuebing L, Hui Z, et al. Research progress and application review of machine vision technology in packaging industry. Packag J. 2022;14(02):1–14+107.
- Bin Z, Feng X, Kai T, et al. Trajectory planning for spray-painting robot and quality detection of paint film based on machine vision: a review. Control Decis. 2023;38(01):1–21.
- Lixin Z, Runzhe X, Yinguang B, et al. Review on survey of deep learning in target detection. Sci Technol Eng. 2021;21(30):12787–12795.
- Zou Z, Shi Z, Guo Y, et al. Object detection in 20 years: a survey. arXiv preprint arXiv. 2023;111(3):257–276. doi:10.1109/JPROC.2023.3238524
- Redmon J, Farhadi A. Yolov3: an incremental improvement. arXiv preprint arXiv. 2018:1804.02767. doi:10.48550/arXiv.1804.02767
- Bochkovskiy A, Wang CY, Liao HYM. Yolov4: optimal speed and accuracy of object detection. arXiv preprint arXiv. 2020:2004.10934. doi:10.48550/arXiv.2004.10934
- Wu W, Liu H, Li L, et al. Application of local fully convolutional neural network combined with YOLOv5 algorithm in small target detection of remote sensing image. PLoS One. 2021;16(10):e0259283.
- Dianfang M, Xianli L, Caixu Y, et al. Study on wear state recognition of milling cutter via deep learning and multi-signal fusion. Mech Sci Technol Aerosp Eng. 2021;40(10):1581–1589.
- Mingjun H, Xiaolong S, Yuanjie W, et al. Multi-region distributed word-casting recognition of the castings based on machine vision. Spec Cast Nonferrous Alloys. 2022;42(10):1225–1231.
- Huang X, Wang H, Xue W, et al. Study on time-temperature-transformation diagrams of stainless steel using machine-learning approach. Comput Mater Sci. 2020;171:109282. doi:10.1016/j.commatsci.2019.109282
- Huang X, Wang H, Xue W, et al. A combined machine learning model for the prediction of time-temperature-transformation diagrams of high-alloy steels. J Alloys Compd. 2020;823:153694. doi:10.1016/j.jallcom.2020.153694
- Geng X, Mao X, Wang H, et al. A hybrid machine learning model for predicting continuous cooling transformation diagrams in welding heat-affected zone of low alloy steels. J Mater Sci Technol. 2022;107:207–215. doi:10.1016/j.jmst.2021.07.038
- Geng X, Wang H, Ullah A, et al. Prediction of continuous cooling transformation diagrams for Ni-Cr-Mo welding steels via machine learning approaches. JOM. 2020;72:3926–3934. doi:10.1007/s11837-020-04057-z
- Kanimozhi T, Vijay Franklin J. An automated cervical cancer detection scheme using deeply supervised shuffle attention modified convolutional neural network model. Automatika. 2023;64(3):518–528. doi:10.1080/00051144.2023.2196114
- Santhana Krishnan R, Julie EG. Computer aided detection of leaf disease in agriculture using convolution neural network based squeeze and excitation network. Automatika. 2023;64(4):1038–1053. doi:10.1080/00051144.2023.2241792
- Damodaran S, Shanmugam L, jothi Swaroopan NM. Overhead power line detection from aerial images using segmentation approaches. Automatika. 2024;65(1):261–288. doi:10.1080/00051144.2023.2296798
- Wang CY, Bochkovskiy A. LIAO HYM. YOLOv7: trainable bag-of-freebies sets new state-of-the-art for real-time object detectors. arXiv preprint arXiv; 2022:2207.02696. doi:10.48550/arXiv.2207.02696
- Xiaofei A, Pei W, Changhai L, et al. Corn straw coverage calculation algorithm based on K-means clustering and zoning optimization method. Trans Chin Soc Agric Mach. 2021;52(10):84–89.
- Ding X, Zhang X, Ma N, et al. Repvgg: making vgg-style convnets great again. Ieee/CVF Conference on Computer Vision and Pattern Recognition. Nashville, TN, USA: IEEE, 2021: 13733–13742.
- Hou Q, Zhou D, Feng J. Coordinate attention for efficient mobile network design. Ieee/CVF conference on Computer Vision and Pattern Recognition. Nashville, TN, USA: IEEE, 2021: 13713–13722.