
Introduction
Colony winter mortality has been monitored in Belgium according to the international guidelines developed by the COLOSS network from 2008 onwards (Nguyen et al., Citation2010; Van der Zee et al., Citation2013). At the time, the empirically considered reasonable winter mortality rate was 10% (Haubruge et al., Citation2006), which is much lower than the on average 20–30% winter mortality rates reported in Belgium between 2008 and 2010 (Ravoet et al., Citation2015). The high presence of clinical signs observed in the studied honey bee population clearly pointed towards the involvement of Varroa destructor mites and viruses infections (Nguyen et al., Citation2010). Both causes have repeatedly been identified as the main drivers behind winter mortality not only in Belgium but across the world (de Miranda & Genersch, Citation2010; Genersch, Citation2010; Johnson et al., Citation2009; Meixner et al., Citation2014; Nazzi et al., Citation2012; Rosenkranz et al., Citation2010).
Nowadays, much effort has been made to understand the mechanisms behind resistance or tolerance to the varroa mites, virus infections and the interaction between both stressors. Research resulting in breeding programs aimed at a sustainable natural coexistence between the honey bee and its stressors (Le Conte et al., Citation2020). To date, 22 European countries have honey bee selection programs in place (Le Conte et al., Citation2020). So far, progress has been slow, partly because of the local character of the resistance traits (Büchler et al., Citation2014; Francis et al., Citation2014; Meixner et al., Citation2014). The most frequently implemented traits in European breeding programs related to varroa resilience are mite infestation, suppressed mite reproduction (SMR), varroa sensitive hygiene, recapping, or hygienic behavior (Mondet et al., Citation2020). Breeding programs usually include one to four of these traits in their program. Which colonies are subsequently selected as the breeding stock depends on the trait scores of each queen and on how each trait score is weighted compared to the other measured traits. Some breeding programs additionally include the variability in trait scores of related colonies (sister queens and half-sister queens or along the mother line and father lines) to improve the genetic selection potential (Bienefeld et al., Citation2007; Uzunov et al., Citation2017).
In 1972, the first trait selection protocols were developed by Friedrich Ruttner for swarming tendency, honey production, temperament and quietness on the comb (Ruttner, Citation1972). The current Flemish honey bee breeding program was launched in 2017 and combines the traits developed by Ruttner with resilience parameters to different stressors. These are hygienic behavior, the ‘suppressed in-ovo infestation’ trait (SOV), mite non-reproduction (MNR) and the varroa index, which is a measure of mite population growth between early spring and summer. The SOV trait describes the virus status of a pooled sample of 10 drone eggs and represents the presence of vertical transmission of viruses at the time of sampling. This trait was found heritable and was shown to be related with decreased virus infections in almost all developmental stages in the colony (de Graaf et al., Citation2020). Additionally, the decrease in population size over winter and spring growth is measured to monitor colony development.
This study evaluates whether a simple selection program can predict winter mortality. For each trait, the test results from the beekeeping season 2021 are ranked and divided in quarters (based on boxplot distributions). Analyses were conducted on both the mean trait scores for colonies that survived or died during the winter of 2021–2022 as well as on the mortality rate of each of the trait score quarters. This approach allows for an evaluation of the breeding strategy in predicting winter mortality as well as an interpretation of the effectiveness hereof for the different quarters, eventually improving our understanding of honey bee breeding strategies that are aimed at reducing colony mortality.
Methods
Data was collected as part of the Flemish honey bee breeding program. All trait measurements were taken between autumn 2020 and summer 2021. Data on mortality were collected in early spring 2022 (after the winter following on the testing year). Each honey bee queen was born in 2020 and was tested during her first entire beekeeping season. Beekeepers were not restricted in their choice of beekeeping practices, but all beekeepers treated against the varroa mite in both summer and winter. The traits selected for in this breeding program were based on Uzunov et al. (Citation2017) and included testing for three traits on behavior, five on resilience and two on productivity, which sets the total on ten tests.
For behavioral traits, each queen was scored for gentleness, calmness and swarming tendency following the protocol described by Büchler et al. (Citation2013). Traits related to resilience were the winter index, varroa index, hygienic behavior, MNR and the SOV trait. Detailed protocols for hygienic behavior (measured on 24 h) and SOV are described in Büchler et al., Citation2013 and Claeys Bouuaert et al., Citation2022, respectively. For measuring MNR, the protocol as described by Mondet et al., Citation2020 was followed. Hereafter, a short description of each trait related to resilience or productivity included in the selection program is provided.
Hygienic Behavior
Performed as a pin test where 50 red-eyed pupae are perforated with a needle and the percentage of fully cleaned cells is calculated after returning the brood to the colony for 24 h.
SOV
The SOV trait describes the virus status of a pooled sample of 10 drone eggs collected in early spring. Each sample was screened for the presence of ABPV, DWV (all genotypes), BQCV and SBV by RT-qPCR as described in the protocol.
MNR
Briefly, for each capped drone brood sample, a maximum of either 35 single infested cells or 200 cells was opened and data was collected on the number of daughters in cells infested with one mother mite. The percentage MNR was calculated as the proportion of single infested cells without offspring.
Winter Index
The winter index is described as the number of frames populated by bees in October divided by the number of frames populated in February, thus representing the decrease of the population size over winter.
Varroa Index
The varroa index is described as the number of phoretic mites collected by the sugar method on 30 g of nurse bees’ mid-summer divided by average daily mite fall over three weeks during early spring. This parameter represents the increase in varroa population during spring and summer.
Honey Yield
As honey yield depends heavily on the location, data is represented as the percentage honey collected compared to the apiary average.
Spring Growth
Spring growth was calculated as the increase in brood area (measured in dm2) between February and April.
Quarters were calculated for each trait in order to rank queens relative to the tested population in that year based on the boxplot distribution of each list of trait scores. Statistical analyses of the mortality rate in each quartile and for each trait were used to analyze the importance of each trait on the mortality rate. Data cleaning and statistics were performed in Rstudio 4_1_1 and Excel. All tests were checked for and complied with the required assumptions.
Results
Data Description
Each of the 45 beekeepers involved in the breeding program participated with an average of 7.1 queens (between 2 and 36). This resulted in a total of 322 queens. On average, 6 of the 9 traits were tested for each queen, as not all beekeepers performed all tests. The average winter mortality in the tested population was 34%. The number of queens per beekeeper did not influence the mortality rate (Spearman, r(43) = −.08, p = .60), indicating that the data were not influenced by a few breeders.
Of the 224 queens tested for hygienic behavior, the percentage of cleaned cells was measured after the prescribed 24 h in only 103 cases. For the remaining 121 queens, scores were measured after 4 to 22 hours or after 36 hours. Only the data collected after 24 h are included in further analyses.
Data on MNR could not be used for further analyses, as for none of the 116 tested colonies sufficient single infested cells could be collected to correctly asses MNR (threshold of 35 single infested cells per sample).
Relationships between Traits and Mortality
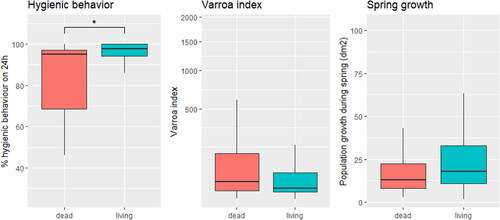
provides an overview of the number of queens tested for each trait, the average scores for queens that survived and died during winter along with the p-value for the difference in the mean score between queens that died or survived over winter. Colonies that died during winter showed lower spring growth (Mann–Whitney U test, W = 2312, p-value = .09), a higher varroa index (Mann–Whitney U test, W = 3099.5, p-value = 0.08) and significantly lower levels of hygienic behavior (Mann–Whitney U test, W = 681, p-value < .01).
a Table 1. Overview of the traits tested in the Flemish honey bee breeding program. For each trait, the number of tested queens is provided together with the average trait score for colonies that died or survived over winter and the significance level of the difference between the two. Significant differences are highlighted in bold.
shows a boxplot of hygienic behavior, varroa index and spring growth for those queens that died or survived the winter following data collection. All three traits were selected for further analyses based on the (relatively) large difference between those colonies that died or survived over winter. No correlation existed between spring growth and varroa index (Spearman, r(112) = .05, p = .61), or between varroa index and hygienic behavior (Spearman, r(80) = −.07, p = .537).
a Figure 1. Boxplot of the trait scores for hygienic behavior, the varroa index and spring growth. Data are provided for colonies that survived and died over winter. Significant differences are indicated with *.
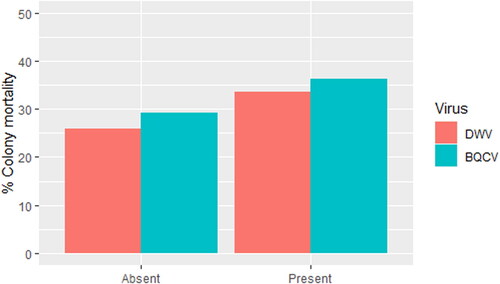
Of the 247 queens tested for SOV, 161 of the egg samples were infected with DWV and 58 with BQCV. Only three samples were infected with both DWV and BQCV. No samples were infected with SBV or ABPV. shows that winter mortality was higher for queens of which DWV or BQCV was found in the samples (25.9% when DWV was absent and 33.5% when DWV was present; 29.3% when BQCV was absent and 36.2% when BQCV was present), but these differences were not significant (DWV: X2 (1) = 0.73, p-value = .39; BQCV: X2 (1) = 0.38, p-value = .54).
a Figure 2. Winter mortality for colonies where DWV or BQCV was present or absent in the egg samples collected as part of the SOV phenotyping.
Relationships between Quarters and Mortality
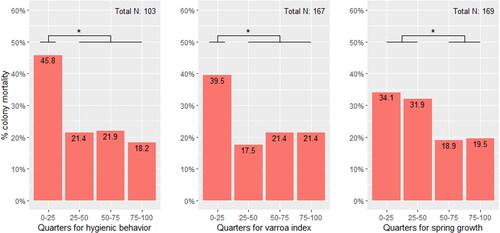
shows the relation between winter mortality and the different quarters for hygienic behavior, varroa index and spring growth. For hygienic behavior and the varroa index, the increased mortality is only significant in the lowest quarter (hygienic behavior: X2 (1) = 4.98, p-value < .05; varroa index: X2 (1) = 5.38, p-value < .05). No differences can be found when comparing the 25–50, 50–75 or 75–100 quartiles for these traits. The same trend is shown for spring growth, but with significant different mortality rates when comparing the lowest two quarters (0–25 and 25–50) with the highest two quarters (50–75 and 75–100; X2 (1) = 3.38, p-value < .05).
a Figure 3. Overview of the percentage mortality for each quarter for hygienic behavior, the varroa index and spring growth. The total number of samples is indicated at the top right of each trait graph. Significant differences are indicated with *.
Discussion
The high winter losses observed in 2021–2022 for the beekeepers involved in the Flemish beekeeping program provided an opportunity to relate the selection traits to winter mortality. Important to note is that the winter mortality in the studied population was 14% higher compared to the overall winter losses across Belgium in the same winter (34% compared to ± 20%; unpublished results). Interestingly, the winter mortality across Belgium was similar to the winter mortality in the studied population when excluding the weakest quarter(s) of hygienic behavior, varroa index and spring growth. It thus appears that a winter mortality of 15–20% was the average background mortality regardless of trait scores during the winter of 2021–2022. For comparison, the average winter mortality was 16.4% in 2019–2020 (unpublished results) and 7.3% in 2018–2019 (Gray et al., Citation2020).
When looking at the three traits related to winter mortality in this study, hygienic behavior and the varroa index reflect the varroa mite population growth and spring growth is a part of colony development. Both factors have repeatedly been associated with winter mortality in previous studies (Clermont et al., Citation2015; Dainat et al., Citation2012; Ellis et al., Citation2010; Genersch et al., Citation2010; Gray et al., Citation2020; Hernandez et al., Citation2022; Potts et al., Citation2010; Van der Zee et al., Citation2013). Winter mortality was highest in the lowest quarter, which indicates that the colonies with the largest mite population growth or slow spring growth are the first to die. Moreover, the data shows a lack of differentiation in winter mortality between the average and best scoring quarters. Colonies with the highest scores for hygienic behavior, the varroa index or spring growth did not have a higher chance of surviving winter compared to colonies that score averagely on these traits.
In the studied population, the variance in each quarter strongly reduces with each quarter (shown by the distribution in the boxplots, ). This trend represents a population in which the average colony scores well on the different traits and only few colonies score much lower. In this situation, a strategy to exclude the weakest colonies from further breeding (negative selection) compared to breeding only from the best colonies might be more effective. To what extent heritability of the desired traits and the consistency hereof (across offspring) differs across trait scores have currently not yet been investigated, but would be an important consideration for breeding programs when including a large proportion of the population in the breeding pool. As this study only includes data from one winter, repeated studies over multiple years are needed to confirm the selection patterns observed in this study. For breeding programs aimed at reducing the need for treatment against the varroa mite, applying the same assessment strategy as presented in this study could be of value to increase our understanding of the shift in selection that takes place under increased natural selection pressure.
Both the varroa index and spring growth can be referred to as holistic traits. Such parameters represent the eventual result of a large array of underlying traits. In the situation where many traits can be tested and where the general breeding score for those traits is high, holistic parameters have the advantage of a lower workload while still indirectly incorporating all underlying traits in the selection process. Together with the strategy of only excluding the weak, holistic traits can facilitate a larger genetic variability in future generations as the number of colonies from which further breeding is advised increases. This is an important advantage, as genetic variability in a population is associated with improved disease resistance, homeostasis, colony fitness and decreased winter mortality (Büchler et al., Citation2014; Francis et al., Citation2014; Mattila & Seeley, Citation2007; Meixner et al., Citation2014; Tarpy et al., Citation2013).
Virus infections, specifically infections with DWV, have repeatedly been associated with colony mortality (Di Prisco et al. Citation2011; Dainat et al., Citation2012; Nazzi et al., Citation2012; Cornman et al., Citation2012; Francis et al., Citation2013). As the SOV status is associated with decreased virus levels in adult bees (de Graaf et al., Citation2020), the assumption was that a beneficial SOV status would also result in higher winter survival. The lower, but non-significant mortality rate in colonies with virus-free eggs at the time of sampling indicates both the potential of implementing traits related to virus resilience in breeding programs as well as the need for further improvements to the SOV phenotyping protocol to fully understand the role of vertical transmission of viruses in the frame of winter mortality. As described in the SOV protocol, samples are collected in spring (de Graaf et al., Citation2020). Recent research showed that the probability of virus infections in eggs decreased in samples collected in summer compared to spring (Claeys Bouuaert et al., Citation2022). Currently, no research has evaluated the SOV status in autumn, the season in which DWV is most prominent in adult honey bees (Bradford et al., Citation2017; Porrini et al., Citation2016; Tentcheva et al., Citation2004). Further research comparing the SOV status in different seasons with the probability of colony mortality over winter could improve our understanding of the role that vertical transmission of viruses plays in colony winter mortality.
This study shows that comparing mortality across the distribution of trait scores can improve our understanding of the relation between each trait and colony mortality, which gives valuable information that can be used to improve or adjust breeding programs or to assess new traits.
Disclosure Statement
The authors report there are no competing interests to declare.
Additional information
Funding
References
- Bienefeld, K., Ehrhardt, K., & Reinhardt, F. (2007). Genetic evaluation in the honey bee considering queen and worker effects—A BLUP-animal model approach. Apidologie, 38(1), 77–85. https://doi.org/10.1051/apido:2006050
- Bradford, E. L., Christie, C. R., Campbell, E. M., & Bowman, A. S. (2017). A real-time PCR method for quantification of the total and major variant strains of the deformed wing virus. Plos One, 12(12), e0190017–19. https://doi.org/10.1371/journal.pone.0190017
- Büchler, R., Andonov, S., Bienefeld, K., Costa, C., Hatjina, F., Kezic, N., Kryger, P., Spivak, M., Uzunov, A., & Wilde, J. (2013). Standard methods for rearing and selection of Apis mellifera queens. Journal of Apicultural Research, 52(1), 1–30. https://doi.org/10.3896/IBRA.1.52.1.07
- Büchler, R., Costa, C., Hatjina, F., Andonov, S., Meixner, M. D., Conte, Y. L., Uzunov, A., Berg, S., Bienkowska, M., Bouga, M., Drazic, M., Dyrba, W., Kryger, P., Panasiuk, B., Pechhacker, H., Petrov, P., Kezic´, N., Korpela, S., & Wilde, J. (2014). The influence of genetic origin and its interaction with environmental effects on the survival of Apis mellifera colonies in Europe. Journal of Apicultural Research, 53(2), 205–214. https://doi.org/10.3896/IBRA.1.53.2.03
- Claeys Bouuaert, D., S., L. De, Brunain, M., Dahle, B., Blacquière, T., Dalmon, A., Dezmirean, D., Elen, D., Filipi, J., Giurgiu, A., Gregorc, A., Kefuss, J., Locke, B., M., J. R. De, Oddie, M., Panziera, D., Parejo, M., Pinto, M. A., & Graaf, D. C. d (2022). Dynamics in vertical transmission of viruses in naturally selected and traditionally managed honey bee colonies across Europe. bioRxiv. Cold Spring Harbor Laboratory. https://doi.org/10.1101/2022.03.25.485775
- Clermont, A., Pasquali, M., Eickermann, M., Kraus, F., Hoffmann, L., & Beyer, M. (2015). Virus status, varroa levels, and survival of 20 managed honey bee colonies monitored in Luxembourg between the summer of 2011 and the spring of 2013. Journal of Apicultural Science, 59(1), 59–73. https://doi.org/10.1515/jas-2015-0005
- Cornman, S. R., Boncristiani, H., Dainat, B., Chen, Y., VanEngelsdorp, D., Weaver, D., & Evans, J. D. (2013). Population-genomic variation within RNA viruses of the Western honey bee, Apis mellifera, inferred from deep sequencing. BMC Genomics, 14(1), 154. https://doi.org/10.1186/1471-2164-14-154
- Cornman, S. R., Tarpy, D. R., Chen, Y., Jeffreys, L., Lopez, D., Pettis, J. S., VanEngelsdorp, D., & Evans, J. D. (2012). Pathogen webs in collapsing honey bee colonies. PloS One, 7(8), e43562. https://doi.org/10.1371/journal.pone.0043562
- Dainat, B., Evans, J. D., Chen, Y. P., Gauthier, L., & Neumann, P. (2012). Predictive markers of honey bee colony collapse. PloS One, 7(2), e32151. https://doi.org/10.1371/journal.pone.0032151
- de Graaf, D. C., Laget, D., De Smet, L., Claeys Boúúaert, D., Brunain, M., Veerkamp, R. F., & Brascamp, E. W. (2020). Heritability estimates of the novel trait ‘suppressed in ovo virus infection’ in honey bees (Apis mellifera). Scientific Reports, 10(1), 1–10. https://doi.org/10.1038/s41598-020-71388-x
- de Miranda, J. R., & Genersch, E. (2010). Deformed wing virus. Journal of Invertebrate Pathology, 103, S48–S61. https://doi.org/10.1016/j.jip.2009.06.012
- Di Prisco, G., Pennacchio, F., Caprio, E., Boncristiani, H. F., Evans, J. D., Chen, Y., Prisco, G., Di, Pennacchio, F., Caprio, E., Boncristiani, H. F., Evans, D., Di Prisco, G., Pennacchio, F., Caprio, E., Boncristiani, H. F., Evans, J. D., Chen, Y., Boncristiani Jr, H. F., Evans, J. D., & Chen, Y. (2011). Varroa destructor is an effective vector of Israeli acute paralysis virus in the honeybee, Apis mellifera. The Journal of General Virology, 92(Pt 1), 151–155. https://doi.org/10.1099/VIR.0.023853-0
- Ellis, J. D., Evans, J. D., & Pettis, J. (2010). Colony losses, managed colony population decline, and colony collapse disorder in the United States. Journal of Apicultural Research, 49(1), 134–136. https://doi.org/10.3896/IBRA.1.49.1.30
- Francis, R. M., Amiri, E., Meixner, M. D., Kryger, P., Gajda, A., Andonov, S., Uzunov, A., Topolska, G., Charistos, L., Costa, C., Berg, S., Bienkowska, M., Bouga, M., Büchler, R., Dyrba, W., Hatjina, F., Ivanova, E., Kezic, N., Korpela, S., … Wilde, J. (2014). Effect of genotype and environment on parasite and pathogen levels in one apiary—A case study. Journal of Apicultural Research, 53(2), 230–232. https://doi.org/10.3896/IBRA.1.53.2.14
- Francis, R. M., Nielsen, S., & Kryger, P. (2013). Varroa–Virus interaction in collapsing honey bee colonies. PLoS One. 28(12), 2958–2966. https://doi.org/10.1111/mec.15080
- Genersch, E. (2010). Honey bee pathology: Current threats to honey bees and beekeeping. Applied Microbiology and Biotechnology, 87(1), 87–97. https://doi.org/10.1007/S00253-010-2573-8
- Genersch, E., Von Der Ohe, W., Kaatz, H., Schroeder, A., Otten, C., Büchler, R., Berg, S., Ritter, W., Mühlen, W., Gisder, S., Meixner, M., Liebig, G., & Rosenkranz, P. (2010). The German bee monitoring project: A long term study to understand periodically high winter losses of honey bee colonies. Apidologie, 41(3), 332–352. https://doi.org/10.1051/apido/2010014
- Gray, A., Adjlane, N., Arab, A., Ballis, A., Brusbardis, V., Charrière, J.-D., Chlebo, R., Coffey, M. F., Cornelissen, B., Amaro da Costa, C., Dahle, B., Danihlík, J., Dražic´, M. M., Evans, G., Fedoriak, M., Forsythe, I., Gajda, A., de Graaf, D. C., Gregorc, A., … Brodschneider, R. (2020). Honey bee colony winter loss rates for 35 countries participating in the COLOSS survey for winter 2018–2019, and the effects of a new queen on the risk of colony winter loss. Journal of Apicultural Research, 59(5), 744–751. https://doi.org/10.1080/00218839.2020.1797272
- Haubruge, E., Nguyen, B. K., Widart, J., Thomé, J., & Depauw, E. (2006). Le dépérissement de l’abeille domestique. Apis mellifera L., 1758 (Hymenoptera : Apidae): faits et causes probables. Notes Fauniques de Gembloux, 59(1), 3–21.
- Hernandez, J., Hattendorf, J., Aebi, A., & Dietemann, V. (2022). Compliance with recommended Varroa destructor treatment regimens improves the survival of honey bee colonies over winter. Research in Veterinary Science, 144, 1–10. https://doi.org/10.1016/J.RVSC.2021.12.025
- Johnson, R. M., Pollock, H. S., & Berenbaum, M. R. (2009). Synergistic interactions between in-hive miticides in Apis mellifera. Journal of Economic Entomology, 102(2), 474–479. https://doi.org/10.1603/029.102.0202
- Le Conte, Y., Meixner, M. D., Brandt, A., Carreck, N. L., Costa, C., Mondet, F., & Büchler, R. (2020). Geographical distribution and selection of European honey bees resistant to Varroa destructor. Insects, 11(12), 873–834. https://doi.org/10.3390/insects11120873
- Mattila, H. R., & Seeley, T. D. (2007). Genetic diversity in honey bee colonies enhances productivity and fitness. Science (New York, N.Y.), 317(5836), 362–364. https://doi.org/10.1126/SCIENCE.1143046
- Meixner, M. D., Francis, R. M., Gajda, A., Kryger, P., Andonov, S., Uzunov, A., Topolska, G., Costa, C., Amiri, E., Berg, S., Bienkowska, M., Bouga, M., Büchler, R., Dyrba, W., Gurgulova, K., Hatjina, F., Ivanova, E., Janes, M., Kezic, N., … Wilde, J. (2014). Occurrence of parasites and pathogens in honey bee colonies used in a European genotype–environment—Interactions experiment. Journal of Apicultural Research, 53(2), 215–229. https://doi.org/10.3896/IBRA.1.53.2.04
- Mondet, F., Beaurepaire, A., McAfee, A., Locke, B., Alaux, C., Blanchard, S., Danka, B., & Le Conte, Y. (2020). Honey bee survival mechanisms against the parasite Varroa destructor: A systematic review of phenotypic and genomic research efforts. International Journal for Parasitology, 50(6–7), 433–447. https://doi.org/10.1016/j.ijpara.2020.03.005
- Mondet, F., Parejo, M., Meixner, M. D., Costa, C., Kryger, P., Andonov, S., Servin, B., Basso, B., Bien´kowska, M., Bigio, G., Ca˘uia, E., Cebotari, V., Dahle, B., Dražic´, M. M., Hatjina, F., Kovacˇic´, M., Kretavicius, J., Lima, A. S., Panasiuk, B., … Büchler, R. (2020). Evaluation of suppressed mite reproduction (SMR) reveals potential for varroa resistance in European. Insects, 11(9), 595–517. https://doi.org/10.3390/insects11090595
- Nazzi, F., Brown, S., P., S., Annoscia, D., Del Piccolo, F., Di Prisco, G., Varricchio, P., Vedova, G., Della, Cattonaro, F., Caprio, E., & Pennacchio, F. (2012). Synergistic parasite-pathogen interactions mediated by host immunity can drive the collapse of honeybee colonies. PLoS Pathogens, 8(6), e1002735. https://doi.org/10.1371/journal.ppat.1002735
- Nguyen, B. K., Mignon, J., Laget, D., De Graaf, D. C., Jacobs, F. J., VanEngelsdorp, D., Brostaux, Y., Saegerman, C., & Haubruge, E. (2010). Honey bee colony losses in Belgium during the 2008–9 winter. Journal of Apicultural Research, 49(4), 337–339. https://doi.org/10.3896/IBRA.1.49.4.07
- Nguyen, B. K., Van der Zee, R., Vejsnaes, F., Wilkins, S., Le Conte, Y., & Ritter, W. (2010). COLOSS working group 1: Monitoring and diagnosis. Journal of Apicultural Research, 49(1), 97–99. https://doi.org/10.3896/IBRA.1.49.1.15
- Porrini, C., Mutinelli, F., Bortolotti, L., Granato, A., Laurenson, L., Roberts, K., Gallina, A., Silvester, N., Medrzycki, P., Renzi, T., Sgolastra, F., & Lodesani, M. (2016). The status of honey bee health in Italy: Results from the nationwide bee monitoring network. PloS One, 11(5), e0155411. https://doi.org/10.1371/JOURNAL.PONE.0155411
- Potts, S., Roberts, S., Dean, R., Marris, G., Brown, M., Jones, R., Neumann, P., & Settele, J. (2010). Declines of managed honey bees and beekeepers in Europe. Journal of Apicultural Research, 49(1), 15–22. https://doi.org/10.3896/IBRA.1.49.1.02
- Ravoet, J., De Smet, L., Wenseleers, T., & de Graaf, D. C. (2015). Vertical transmission of honey bee viruses in a Belgian queen breeding program. BMC Veterinary Research, 11(1), 61. https://doi.org/10.1186/s12917-015-0386-9
- Rosenkranz, P., Aumeier, P., & Ziegelmann, B. (2010). Biology and control of Varroa destructor. Journal of Invertebrate Pathology, 103, S96–S119. https://doi.org/10.1016/j.jip.2009.07.016
- Ruttner, H. (1972). Technical recommendations for methods of evaluating performance of bee colonies. In F. Ruttner (Ed.), Controlled mating and selection of the honey bee (87–92).
- Tarpy, D. R., Vanengelsdorp, D., & Pettis, J. S. (2013). Genetic diversity affects colony survivorship in commercial honey bee colonies. Die Naturwissenschaften, 100(8), 723–728. https://doi.org/10.1007/s00114-013-1065-y
- Tentcheva, D., Gauthier, L., Zappulla, N., Dainat, B., Cousserans, F., Colin, M. E., & Bergoin, M. (2004). Prevalence and seasonal variations of six bee viruses in Apis mellifera L. and Varroa destructor mite populations in France. Applied and Environmental Microbiology, 70(12), 7185–7191. https://doi.org/10.1128/AEM.70.12.7185-7191.2004
- Uzunov, A., Brascamp, E. W., & Büchler, R. (2017). The basic concept of honey bee breeding programs. Bee World, 94(3), 84–87. https://doi.org/10.1080/0005772X.2017.1345427
- Uzunov, A., Büchler, R., Bienefeld, K., & Van Laere, O. (2017). Protocol van de prestatietest. Smartbees, 1–13. https://www.researchgate.net/publication/316154565_Protocol_van_de_prestatietest?channel=doi&linkId=58f334e2aca27289c217ccc8&showFulltext=true
- Van der Zee, R., Gray, A., Holzmann, C., Pisa, L., Brodschneider, R., Chlebo, R., Coffey, M. F., Kence, A., Kristiansen, P., Mutinelli, F., Nguyen, B. K., Noureddine, A., Peterson, M., Soroker, V., Topolska, G., Vejsnaes, F., & Wilkins, S. (2013). Standard survey methods for estimating colony losses and explanatory risk factors in Apis mellifera. Journal of Apicultural Research, 52(4), 1–36. https://doi.org/10.3896/IBRA.1.52.4.18