Abstract
Capsule Frass fall was later and of longer duration in woods to the north and west of Britain compared with those in the southeast.
Aims Defoliating caterpillars are a major food resource for woodland breeding birds and our aims were to quantify large-scale patterns in the timing and duration of the spring peak in abundance of these caterpillars in oak woodlands in Britain.
Methods We deployed traps to collect caterpillar frass at regular intervals through spring in 19 oak woods distributed through England, Wales and Scotland. Models of the temporal patterns of the rate of frass fall were used to explore relationships with geographic variables and average local temperature.
Results The date of peak frass fall in 2010 ranged from 20 May to 18 June and was significantly related to altitude, latitude and local April–May temperature. The duration of the peak ranged from 20 to 53 days and was correlated with the date of the peak and April–May temperature. Limited data from 2008 and 2009 indicated considerable between-year variation in the date of the peak, which was consistent with the relationship with local temperature found in 2010.
Conclusions The date of peak frass fall was later and the duration of the peak longer in the north and west of Britain compared with the southeast which will have considerable implications for nesting woodland birds such as Pied Flycatchers. The date of the peak was well modelled by local April–May temperature offering the prospect of good predictive models. However, the duration of the peak was less well modelled by local temperature and may be determined by other factors.
Defoliating caterpillars of trees and shrubs are a key resource for woodland birds in the breeding season at temperate latitudes (Perrins Citation1991, Fuller Citation1995). These caterpillars, largely the larvae of macro- and micro-moths, have a short peak of abundance in the few weeks after leaf opening of deciduous trees. Many woodland breeding birds are thought to have adapted their egg-laying dates such that the period when they are feeding their young corresponds to the caterpillar peak (Perrins Citation1970, Citation1979, Citation1991, Siikamäki Citation1998, van Balen Citation1973). Oak (Quercus) trees are particularly important as they hold especially high densities of defoliators compared with other species (Veen et al. Citation2010).
In recent years much attention has been directed to the timing of breeding in birds in relation to this resource peak, particularly looking at the implications for the response to spring warming and climate change (see Both [Citation2010] for a review). Although changes in the relative timing of the birds' breeding and the abundance of caterpillars have been suggested as a factor in the declines of some woodland birds (Fuller et al. Citation2005), the evidence is equivocal. For instance, Great Tits Parus major in Britain have adjusted their laying dates to match the earlier caterpillar peak in the recent decades of warm springs (Charmantier et al. Citation2008), whereas the same species in the Netherlands appears to have been less able to respond (Visser et al. Citation1998, Citation2006). For long-distance migrants this phenological mismatch may be a particular problem (Fuller et al. Citation2005). For instance, there is now considerable evidence that Pied Flycatchers Ficudela hypoleuca in the Netherlands exhibit population trends in individual woods that are related to the timing of their laying dates and caterpillar peaks. Population declines are greater in woods with an early caterpillar peak and lower or non-existent in woods with a late caterpillar peak (Both & Visser Citation2001, Both et al. Citation2006).
Although there have been many individual projects in Britain and elsewhere looking at the timing of the caterpillar peak (Maziarz & Wesołowski Citation2010, Naef-Daenzer & Keller Citation1999, Perrins Citation1991, Seki & Takano Citation1998, Sisask et al. Citation2010, van Balen Citation1973, Veen et al. Citation2010), only in the Netherlands have extensive studies been reported (Visser et al. Citation2006, Both et al. Citation2006). Variation in the abundance of defoliating caterpillars in woodlands can be measured by the volume of frass (the material that plant-eating insects pass as waste after digestion) which falls from the canopy (Tinbergen Citation1960, Tinbergen & Dietz Citation1994). In the present study we describe the results of the first extensive systematic programme of frass trapping in oak woods in Britain and explore the geographic patterns and correlates of the timing and duration of the frass peak.
METHODS
Many designs of frass trap have been published (Liebhold & Elkington Citation1988, Seki & Takano Citation1998, Tinbergen Citation1960, Tinbergen & Dietz Citation1994, Zandt Citation1994), but in this study we deployed simple, inexpensive traps consisting of a standard plastic seed tray (approximately 35cm × 25cm) lined with permeable horticultural fleece folded and stapled to be a good fit. Each trap was covered in plastic horticultural netting (black 1.5-cm mesh) and pegged to the ground below an oak tree (1–2 m from the trunk). The permeable fleece allowed any rain water to drain away through holes in the bottom of the tray.
Traps were operated in a total of 19 woods spread geographically from Devon (southern England) to Highland Scotland (). The woods were selected based on their domination by oak (Quercus robor and Q. petraea were not differentiated in this study) with the traps positioned under oak trees. Four traps per wood, spaced at least 100 m apart, were recommended but in the event 62 individual traps were operated (mean 3.3 per wood). The grid reference and altitude of each trap were recorded and the easting and northing of each wood determined to the nearest kilometre from the grid reference (with the southeast corner of UK Ordnance Survey 100-km square ‘TV’ as origin). The start of the trapping period was designed to be well in advance of the frass peak and varied with region (25 April in southeast England, mid-May or later further north and west). Each trap was visited on average every five days to replace the fleece liner, the interval varying between 2 and 12 days (mean = 5.4 days). The number of collecting intervals through the season varied between sites from 5 to 16 with an average of 7.8.
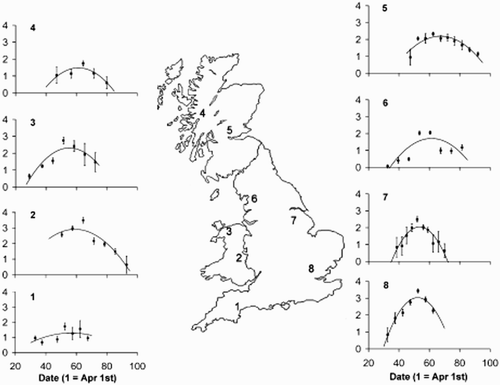
Figure 1. The localities included in this study and the overall mean temporal pattern of frass fall for each locality. For each locality the log10 (mean frass fall (mg/m2) + 1) in each time period was used to calculate and an overall quadratic regression; error bars represent ± 2 se. The traps were distributed as follows: (1) Devon, 1 wood, 4 traps, 2010; (2) mid-Wales, 4 woods, 11 traps, 2009 and 2010; (3) north Wales, 2 woods, 4 traps, 2010; (4) Lochaber, 1 wood, 4 traps, 2010; (5) Stirling, 1 wood, 4 traps, 2010; (6) north Lancashire, 3 woods, 12 traps, 2010; (7) Nottinghamshire, 2 woods, 8 traps, 2010; (8) Hertfordshire, 5 woods, 19 traps, 2008–10.
The frass samples were air-dried and sorted by the first author. Having removed the obvious rubbish, such as leaves and twigs, the remaining material was passed through a 1.2-mm mesh sieve and both the retained fraction and the rest examined under a binocular microscope (×7 magnification) and the caterpillar frass extracted and weighed to the nearest mg.
For four of the woods in Hertfordshire, data were available from the same 16 trap sites for 2008 and 2009 as well as 2010. For two sites in mid-Wales data were available for 2009 as well as 2010. These extra data were used to examine year-to-year variations in the temporal patterns of frass production and to test whether relationships found in 2010 could be generalized to other years.
The frass fall was often very sharply peaked in time so a log transformation was used to allow the fitting of a simple quadratic model. The mass of frass for each trap interval was converted to mg per day per m2 and was attributed to the day of the mid-point of the interval. This was then log (n + 1) transformed and quadratic regression used to identify the date of peak frass production. The start and end dates were defined arbitrarily as the dates when the modelled frass production was 10% of the peak value. As we were looking at the overall temporal pattern of frass fall, no attempt was made to convert this to caterpillar biomass or to correct for the effect of temperature on this relationship (Tinbergen & Dietz Citation1994). The fit of the quadratic model was examined by eye and in some cases the series truncated to exclude periods of low frass at the beginning and end of the time series, which would have the effect of spreading the fitted distribution. To avoid the possibility of pseudo-replication the peak dates and durations of frass fall for each trap were averaged to give mean figures for each wood.
Temperature data were provided by the UK Meteorological Office for weather stations as close as possible to each of the woods (usually within 20 km). To allow for differences in altitude between the frass traps and the weather stations a standard environmental lapse rate of 0.065°C per m altitude difference was applied (International Civil Aviation Organisation). Altitude-corrected daily maximum and minimum temperatures were used to calculate daily averages which in turn were used to calculate monthly means.
RESULTS
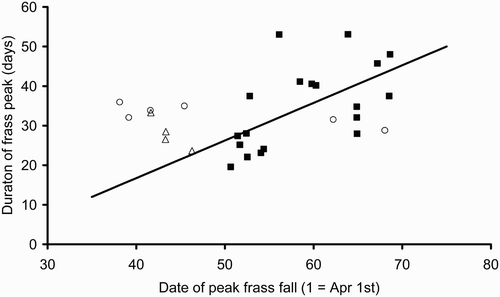
In 2010, the peak date of frass production showed a significant relationship with altitude and northing such that production was later at higher altitudes and further north (peak day = 36.5 + 0.0781 * altitude + 0.0349 * northing; F 2,16 = 23.38, P < 0.001, R 2 = 74.5%). Inclusion of westing did not lead to a significant improvement in the model. The duration of the frass peak (i.e. the mean number of days between 10% points of the quadratic model) was significantly related to westing but not altitude or northing (duration = 21.4 + 0.0589 * westing; F 1,17 = 13.54, P = 0.002, R 2= 50.0%). For the 2010 data, there was a significant relationship between the peak date and the duration of the peak () (duration = –21.3 + 0.951 * peak day; F 1,17 = 8.71, P = 0.009, R 2 = 33.9%). Those sites with a later date of frass peak also had a longer duration of frass fall.
Figure 2. Duration of the frass peak versus the date of the peak in 2010 (▪), 2009 (○) and 2008 (▵). The regression equation is derived from 2010 data only (duration = –21.3 + 0.951 * peak day; F 1,17 = 8.71, P = 0.009, R 2 = 33.9%).
There was significant variation between years in the date of peak frass production for the Hertfordshire sites (F 2,10 = 30.62, P < 0.001). Both 2008 and 2009 were early years and 2010 was later by about 10 days (mean = 43.6 ± 1.9 sd [2008], 41.1 ± 3.2 sd [2009], 52.1 ± 1.3 sd [2010]). By contrast, there was no difference in the peak dates for the mid Wales sites in 2009 and 2010 (F 1,4 = 0.12, P = 0.75; mean = 65.2 ± 4.1 sd [2009], 63.4 ± 6.2 sd [2010]).
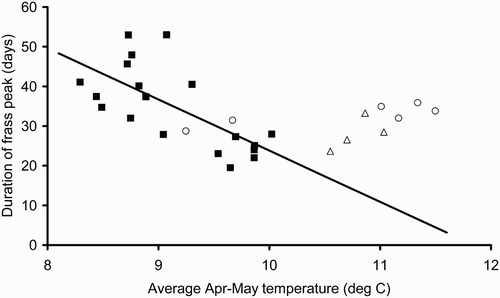
In 2010 and for all years combined there were significant negative relationships between the date of peak frass fall and the average April–May temperature at each site (2010: peak day = 136.9 – 8.53 * Apr/May temp; F 1,17 = 20.61, P < 0.001, R 2 = 54.8%; all years: peak day = 140.4 – 8.84 * Apr/May temp; F 1,27 = 105.6, P < 0.001, R 2 = 79.6%) (). Our data suggest the relationship is consistent across years with the 2008 and 2009 results falling well within the 2010 regression line. In 2010 the duration of the frass peak was also highly correlated with April–May temperature (duration = 152.8 – 12.9 * Apr/May temp; F 1,17 = 15.08, P = 0.001, R 2 = 47.0%) but the 2008 and 2009 data did not lie on this regression line ().
Figure 3. Date of the peak frass fall versus mean April–May temperature for 2010 (▪), 2009 (○) and 2008 (▵). The regression equation is derived from 2010 data only (peak day = 136.9 – 8.53 * Apr/May temp; F 1,17 = 20.61, P < 0.001, R 2 = 54.8%).
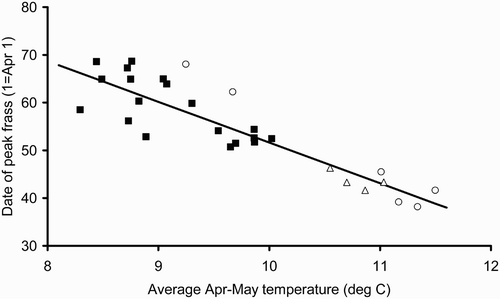
Figure 4. Duration of the frass peak versus mean April–May temperature for 2010 (▪), 2009 (○) and 2008 (▵). The regression equation is derived from 2010 data only (duration = 152.8 – 12.9 * Apr/May temp; F 1,17 = 15.08, P = 0.001, R 2 = 47.0%).
DISCUSSION
These data have revealed clear patterns with the peak date and duration of frass fall dependent on the geographic variables and strongly correlated with local April–May temperature. The temperature variable we have used is relatively crude to allow us to encompass in one variable the range of frass-fall periods in our study sites, yet the relationship with the peak date is still strong. Our results suggest that it should be possible to build better models at the site and regional scale so that frass fall peak dates can be predicted and retrodicted with some confidence.
Although the peak date and duration of frass fall were correlated, the relationship was not strong and the model of the duration of the peak with temperature was not consistent between years. Caterpillars are likely to develop more rapidly at higher temperatures and so the duration of the frass peak would be expected to be shorter as temperature increased. Although the regression of duration with temperature in 2010 was highly significant, the data for 2008 and 2009 did not follow this relationship (). For the Hertfordshire sites, the duration of the frass peak was similar in all three years, despite the date of the peak shifting by 10 days or so and the average temperature being around 1°C higher.
The reasons for this are unclear but other factors could be coming into play. It is possible that our measure of temperature is too crude, being the average over two months, to provide insights at the site level. It is possible that the relationship is non-linear and that 20–30 days is the minimum duration even as the average temperature rises above 10°C. It is known that the timing of frass fall is dependent on the tree species (Veen et al. Citation2010, Sisask et al. Citation2010) but this is unlikely to be important in our case because we focussed on oak trees in oak woods. Two species of oak were present in our sites, Quercus robor and Q. petraea, but both species were present on the Hertfordshire sites and we found no clear differences. We have made no attempt to determine the species of defoliating caterpillars involved in each of our woods but it is possible that there are regional patterns in this. Many species are involved including the most abundant ones, the Winter Moth Operopthera brumata, Green Oak Tortrix Tortrix viridana and Mottled Umber Erranis defoliaria (J. Mallord, pers. comm.). It is possible that geographic patterns of the relative abundance of these species and differences in their ecology are affecting the relationships between the peak date and duration of the frass fall.
What are the implications for nesting insectivorous birds? Three factors are important in relation to the food availability: the timing of the caterpillar peak; its duration; and the absolute abundance of caterpillars. This paper has focussed on the first two factors but it is clear in that the intensity of frass fall varied by more than two orders of magnitude between our study sites. Defoliating caterpillars of oaks and other species are known to follow long-term cycles with periodicities of 10 years or more (Harding Citation2000, Hogstad Citation2005, Perrins Citation1991). So it is only in the ‘low’ years that the timing may be important for the birds. In the peak years there is likely to be a super-abundance of food (Perrins Citation1991). For instance, Maziarz & Wesołowski Citation(2010) reported peak values of frass fall matching or exceeding the highest ones found in our study and found that, even though they nested too late to match the frass peak, Wood Warblers Phylloscpus sibilatrix experienced no problems feeding their young.
Pied Flycatchers have become a focal species for the study of relative timing of nesting and food peaks in the Netherlands (Both & Visser Citation2001, Both et al. Citation2006). Our data show that in 2010 woods within the breeding range of Pied Flycatchers (essentially those in the north and west of Britain [Gibbons et al. Citation1993]) had significantly later and longer frass peaks than those outside the range (within Pied Flycatcher range: peak day = 62.6 ± 5.0 sd; outside range: 52.5 ± 1.4 sd; F 1,17 = 26.4, P < 0.001; within Pied Flycatcher range: duration of peak = 40.9 ± 7.8 sd; outside range: 24.1 ± 3.0 sd; F 1,17 = 28.9, P < 0.001). The mean first-egg date of Pied Flycatchers in Britain is now around 10 May (British Trust for Ornithology data) meaning that on average young will be in the nest from 31 May until 15 June or so (days 61–76). So, even in 2010, in the lowlands the caterpillar peak had already passed before the flycatchers would have been feeding young, whereas within the Pied Flycatcher range the match would still be good. The Hertfordshire data suggest that in 2008 and 2009 the mismatch would have been even greater in the lowlands.
This simple technique has the potential to provide useful results on both the temporal patterns and absolute abundance of frass fall and is relatively straightforward to implement. In view of the importance of this area in relation to future projections of climate change, coordinated studies of frass fall over more sites and more years, preferably linked to the collection of nest record data, are clearly merited.
ACKNOWLEDGEMENTS
We acknowledge the UK Meteorological Office for making their weather data available and Mike Reed, Allan Goddard and Andy Holtham for assisting in the field. The owners of the sites, Natural England, the National Trust, the Woodland Trust, Welwyn Hatfield Borough Council, the Herts and Middlesex Wildlife Trust, the RSPB, Sir Simon Bowes Lyon, W.H. Thomas and Karl Oyston are thanked for allowing access to their land. We thank two anonymous referees for their helpful suggestions for greatly improving the first draft of this paper.
REFERENCES
- Both , C. 2010 . “ Food availability, mistiming and climatic change ” . In Effects of Climate Change on Birds , Edited by: Moller , A. P. , Fiedler , W. and Berthold , P. 129 – 147 . Oxford , , UK : Oxford University Press .
- Both , C. and Visser , M. E. 2001 . Adjustment to climate change is constrained by arrival date in a long-distance migrant bird . Nature , 411 : 296 – 298 .
- Both , C. , Bouwhuis , S. , Lessels , C. M. and Visser , M. E. 2006 . Climate change and population declines in a long distance migratory bird . Nature , 441 : 81 – 83 .
- Charmantier , A. , McCleery , R. H. , Cole , L. R. , Perrins , C. , Kruuk , L. E.B. and Sheldon , B. C. 2008 . Adaptive phenotypic plasticity in response to climate change in a wild bird population . Science , 320 : 800 – 803 .
- Fuller , R. J. 1995 . Bird Life of Woodland and Forest , Cambridge , , UK : Cambridge University Press .
- Fuller , R. J. , Noble , D. G. , Smith , K. W. and Vanhinsbergh , D. 2005 . Recent declines in populations of woodland birds in Britain: a review of possible causes . Br. Birds , 98 : 116 – 143 .
- Gibbons , D. W. , Reid , J. B. and Chapman , R. A. 1993 . The New Atlas of Breeding Birds in Britain and Ireland: 1988–1991 , London , , UK : T & A D Poyser .
- Harding , D. 2000 . “ Two decades of data on oak defoliation in a Worcestershire woodland NNR ” . In Long-term Studies in British Woodland Edited by: Kirby , K. J. and Morecroft , M. D. English Nature Science Vol. 34: 87–97. English Nature, Peterborough, UK
- Hogstad , O. 2005 . Numerical and functional responses of breeding passerine species to mass occurrence of geometrid caterpillars in a subalpine birch forest: a 30-year study . Ibis , 147 : 77 – 91 .
- Liebhold , A. M. and Elkington , J. S. 1988 . Techniques for estimating the density of late-instar Gypsy Moth Lymantria dispar populations using frass drop and frass production measurements . Environ. Entomol. , 17 : 381 – 384 .
- Maziarz , M. and Wesołowski , T. 2010 . Timing of breeding and nestling diet of Wood Warbler Phylloscopus sibilatrix in relation to changing food supply . Bird Study , 57 : 540 – 552 .
- Naef-Daenzer , B. and Keller , L. F. 1999 . The foraging performance of great and blue tits (Parus major and P. caeruleus) in relation to caterpillar development and its consequences for nestling growth and fledging weight . J. Anim. Ecol. , 68 : 708 – 718 .
- Perrins , C. M. 1970 . The timing of birds' breeding seasons . Ibis , 112 : 242 – 255 .
- Perrins , C. M. 1979 . British Tits Collins, London , , UK
- Perrins , C. M. 1991 . Tits and their caterpillar food supply . Ibis , 133 ( suppl ) : 49 – 54 .
- Seki , S.-I. and Takano , H. 1998 . Caterpillar abundance in the territory affects the breeding performance of great tit Parus major minor . Oecologia , 114 : 514 – 521 .
- Siikamäki , P. 1998 . Limitation of reproductive success by food availability and breeding time in pied flycatchers . Ecology , 79 : 1789 – 1796 .
- Sisask , E. , Mänd , R. , Mägi , M. and Tilgar , V. 2010 . Parental provisioning behaviour in Pied Flycatchers Ficedula hypoleuca is well adjusted to local conditions in a mosaic of deciduous and coniferous habitat . Bird Study , 57 : 447 – 457 .
- Tinbergen , L. 1960 . The natural control of insects in pinewoods. I. Factors influencing the predation by songbirds . Arch. Néerland Zool. , 13 : 259 – 343 .
- Tinbergen , J. M. and Dietz , M. W. 1994 . Parental energy expenditure during brood rearing in the great tit (Parus major) in relation to body mass, temperature, food availability and clutch size . Funct. Ecol. , 8 : 563 – 572 .
- van Balen , J. H. 1973 . A comparative study of the breeding ecology of the Great Tit Parus major in different habitats . Ardea , 61 : 1 – 93 .
- Veen , T. , Sheldon , B. C. , Weissing , F. J. , Visser , M. E. , Qvarnström , A. and Sætre , G.-P. 2010 . Temporal differences in food abundance promote coexistence between two congeneric passerines . Oecologia , 162 : 873 – 884 .
- Visser , M. E. , van Noordwijk , A. J. , Tinbergen , J. M. and Lessells , C. M. 1998 . Warmer springs lead to mistimed reproduction in great tits (Parus major) . Proc Roy. Soc. B. , 265 : 1867 – 1870 .
- Visser , M. E. , Holleman , L. J.M. and Gienapp , P. 2006 . Shifts in caterpillar biomass phenology due to climate change and its impact on the breeding biology of an insectivorous bird . Oecologia , 147 : 167 – 172 .
- Zandt , H. S. 1994 . A comparison of three sampling techniques to estimate the population size of caterpillars in trees . Oecologia , 97 : 399 – 406 .