Abstract
Capsule Structural aspects were common across a range of different habitat types and there was evidence that this breeding habitat was limited in extent.
Aims To characterize Grasshopper Warbler breeding habitat in Britain and to use this assessment to test whether it was limiting the breeding population.
Methods In 2005 singing Grasshopper Warblers were surveyed at four groups of sites in southwest Scotland, during four night-time periods through the season, to quantify which period would afford best detection. Breeding habitat characteristics were measured at 210 Grasshopper Warbler singing positions and 210 systematically located comparison sites positioned across 22 sites in England and Scotland. In 2006 tests were conducted using two different procedures to determine whether the preferred breeding habitat was limited. First, by using the 2005 data to map predicted suitable habitat at 15 sites in southwest Scotland before Grasshopper Warblers arrived, and then assessing the extent of actual occupation. Second, by visiting 30 BTO Common Birds Census (CBC) plots mainly in southern England that had lost their breeding Grasshopper Warblers to assess the current suitability of the habitat.
Results Grasshopper Warblers sang more in the first four weeks of the survey (in May) and during the dawn and pre-dawn hours, 05:00–08:00 hours. The breeding habitat across a variety of landscape types was characterized by four key attributes: the presence of more dense, dead vegetation and tussock-forming species at ground level; less dense vegetation at or above 2 m; softer soil; and potential song posts. Not all of the apparently suitable habitat was filled by Grasshopper Warblers, but almost all of the old CBC plots were no longer suitable as breeding habitat as a result of maturation, succession or management.
Conclusions It should be possible to detect about 85% of singing Grasshopper Warblers by surveying during the pre-dawn/dawn period in the month after their main arrival. It seems likely that the breeding habitat of Grasshopper Warblers is limited at least in some parts of Britain and there was good evidence for the importance of the structural aspects of their preferred habitat, including heterogeneity. The area of preferred Grasshopper Warbler habitat could be increased through strategic and active management in a number of settings.
Common Grasshopper Warblers Locustella naevia (hereafter Grasshopper Warblers) are a secretive Afro-Palearctic migrant that are the most widespread member of their genus across Europe. In Britain, although far from common, they are widely distributed as breeding birds, and are absent only from mountainous ground and outlying oceanic islands (Gibbons et al. Citation1993). Often the only indication of breeding presence is the distinctive reeling song of the males, but even this can be overlooked because the high frequency of the sound can be difficult to hear, especially from a distance, and because much of the singing activity occurs at night. Analyses of nest records and migration timing suggest that females may raise two or even three broods in one season (Glue Citation1990, Callion et al. Citation1990, Bayly & Rumsey Citation2007). Breeding birds leave Britain mainly in August and September, and the population probably winters in West Africa with stopover locations in the south of France and northern Iberia (Mead & Hudson Citation1985, Cramp Citation1992, Bayly & Rumsey Citation2007).
Grasshopper Warblers are currently red-listed as a UK species of conservation concern (Eaton et al. Citation2009), based on a rapid population decline during the last 25 years. UK population trend estimates from generic British Trust for Ornithology (BTO) surveys, Common Birds Census (CBC) and Breeding Bird Survey (BBS) show marked annual fluctuations, but an overall decline of 91% during the period 1969–2006, and a 25-year trend up to 2006 of –80%, although with a modest recovery in numbers during 1995–2008 (+24%) (Baillie et al. Citation2010). Underlying this overall recent increase is a contrast between continuing declines in England (–23%) and increases on the small samples of plots in Scotland and Wales (K. Risely, pers. comm.). Declines have also occurred more widely across Europe, with a long-term trend of –36% (1980–2008), but again with a modest recent recovery, of +8% during 1990–2008 (Škorpilová et al. Citation2010).
There are no proven causes for the rapid decline of the UK Grasshopper Warbler population, although three suggested causes, none of them mutually exclusive, are: habitat loss and/or degradation due to agricultural intensification; maturation of large areas of forestry plantations; and a decline in winter habitat availability due to the Sahelian drought (Marchant et al. Citation1990, Gibbons et al. Citation1993). To date, there is very limited evidence in support of any of these hypotheses. British Trust for Ornithology CBC data on the percentage of sites occupied by Grasshopper Warblers shows a much greater decline (from 22% to 4%) for woodland during the period 1968–1975 than for either farmland or other habitats. This may indicate that woodland succession has had a disproportionate effect on the overall trend estimates. Increased availability of newly planted forestry in Britain started in the 1950s, peaked in the 1970s and continued through to the late 1990s (Forestry Commission Citation2008). Analysis of rainfall data from the Sahel has also shown relationships between drought conditions during northern winters and subsequent UK population declines for this species (Mead & Hudson Citation1985, Newton Citation2004). Numbers were sustained in 1969–70, however, when other Sahel species declined (Marchant et al. Citation1990). There seems to have been a two- or three-year difference in the impact of the drought in the Sahel, relative to other trans-Saharan migrants such as Common Whitethroats Sylvia communis (Riddiford Citation1983, Gibbons et al. Citation1993).
The British breeding habitat of Grasshopper Warblers is very varied, and Glue Citation(1990) describes nest records from woodland, scrub, farmland, heathland, moorland, marshland, estuarine and even garden and parkland habitats. Within these broad categories, habitat preference is more restricted. In farmland, nesting habitat is mainly peripheral to cultivated fields, in associated drainage ditches, damp rough grazing, thick broad-based hedges associated with drainage ditches or in abandoned fields. Where Grasshopper Warblers are found to nest in cultivated fields, it is only in grass fields left for a late cut of hay (Glue Citation1990). In woodland and scrub habitats, Grasshopper Warblers avoided mature canopies and were usually in an open, thickly vegetated glade or clearing within a woodland, or a young plantation with a good ground cover of thick grasses (Glue Citation1990). Many young plantations have limited grazing pressure, especially if fenced against deer, and until canopy closure have a tall, luxuriant field layer with a litter of dead leaves. Such habitats are readily used by Grasshopper Warblers and other open-ground songbirds such as Whinchats Saxicola rubetra, European Stonechats Saxicola rubicola and Woodlarks Lullula arborea (Nature Conservancy Council Citation1986). Nests are well concealed and attached to more rigid-stemmed plants such as soft rush Juncus effusus, greater tussock sedge Carex paniculata and purple moor grass Molinia caerulea (Glue Citation1990).
The aim of this study was to seek to identify what the fine-scale characteristic habitats used by Grasshopper Warblers have in common, given that at a coarse scale the species can be found breeding in a wide array of habitat types. This could lead to a greater understanding of how habitat change may have driven population declines, and point the way to potential management solutions that could be encouraged within, for example, woodland grant or agri-environment schemes, that might facilitate population recovery. Despite the scale of Grasshopper Warblers' population decline, these schemes rarely, if ever, directly promote management designed to assist this species. I tested our habitat-association model and used it to look at whether Grasshopper Warblers were filling the habitat available. As a precursor to this, I also tested the ability to detect singing birds.
METHODS
Detection and monitoring
Surveys to assess when Grasshopper Warblers sing were undertaken at four site groups in southwest Scotland (). The sites were chosen, and grouped, on the following criteria: a history of occupancy by Grasshopper Warblers; a survey time of about 3 hours; and a travelling time between groups of about 15 minutes. In 2005, these four site groups were surveyed for 15 weeks from 1 May to the end of July. Each site group was surveyed during the following periods every week: 20:00–23:00, 23:00–02:00, 02:00–05:00 and 05:00–08:00 hours. Visit timings were randomly allocated to any day each week, to avoid non-independence of the data, at least within each week. During each 3-hour survey visit to each site group, the route walked was the same, but the direction of travel was alternated. The observer mapped the precise position of each singing Grasshopper Warbler, which usually entailed taking several compass bearings and going off the survey route to get closer to the source of the singing. Clusters of singing locations or territories were estimated from summary maps showing all registrations. CBC methods were used to define clusters (Marchant Citation1983), with at least two registrations required as the basis of a territory. Random allocation of site survey visits to days per week meant that survey visits made to the same site could be less than one week apart; however, registrations had to be at least ten days apart to form an acceptable cluster of singing males. All distance measures between mapped registrations were made within mapping program MapInfo (Map Info Citation2007).
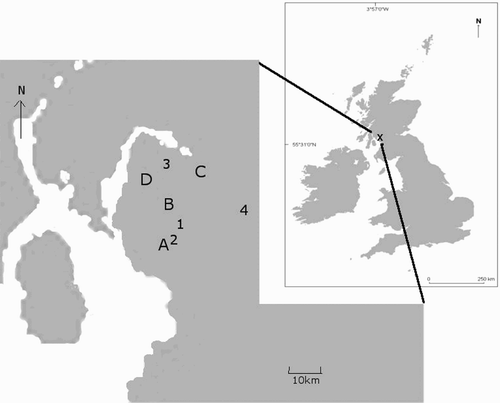
Figure 1. The location of four groups of sites in southwest Scotland at which Grasshopper Warblers were surveyed to assess which night-time period would detect the highest percentage of males (1–4) and four sites or site groups at which Grasshopper Warbler habitat occupancy was predicted (A–D). A and B were key sites, within 2 km of each of which were groups of near-key sites; C and D were groups of non-key sites. Site A and site 2 are the same.
To look at whether week, night-time survey period or site group had an effect on when individual males were likely to be detected, these variables were entered into a generalized logistic regression model with detected singing, or not, as the response variable. Individual territories were treated as non-independent repeated measures with associated autocorrelation accounted for within generalized estimating equations.
Breeding habitat characterization
Grasshopper Warbler breeding habitat was measured during 2005 at 22 different sites throughout England and Scotland (). These sites were chosen to account for a variety of habitat types and if observers were present who would accurately locate singing birds, usually as part of a survey for another species. Observers were asked to record the exact spot from which a Grasshopper Warbler was singing; a location accuracy of ±10 m was accepted.
Figure 2. The locations of 22 sites in England and Scotland. Habitat measures were made in 2005, throughout these sites, at 210 Grasshopper Warbler singing and comparison locations. The sites covered a range of different habitat types. The data collected from these sites to characterize breeding habitat was not used elsewhere.
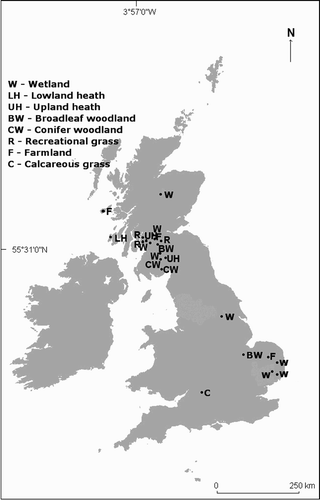
In total, 210 singing positions and the same number of systematically located comparison positions were measured within a variety of habitat types. The number of singing and comparison positions measured in each habitat type was as follows: 83 at eight wetland sites (reedbed, upland bog, coastal marsh, flooded meadow, reservoir edge); 15 at two broadleaf plantation sites; 15 at two conifer plantation sites; 15 at three farmland sites; 20 at one lowland heath site; 15 at two upland moor sites, 17 at three recreational semi-improved grassland sites and 30 at one calcareous grassland site. The comparison positions were systematically located 150 m from each singing position in a randomly generated compass direction. The distance was set at 150 m because birds may feed up to an estimated 100 m from the nest (Cramp Citation1992). If a comparison position had no measurable vegetation, then another random direction was generated. The habitat measures were taken from the end of June to early August and were assessed at four spatial scales. A descriptive list of variables is given in .
Table 1. A descriptive list of the habitat measures made at positions where Grasshopper Warblers were recorded singing, and at comparison positions.
Analyses to determine which measures best distinguished singing positions from comparison locations, were made using generalized linear mixed models, with binomial error structure and a logit link function. Site and observer were fitted as random effects. Univariate analyses of each measured variable gave their individual contributions, together with interactions between two groups relating to vegetation height (). Variable groups () were those that described similar aspects of vegetation or structure. Those variables with a significant individual contribution were examined for correlation (Pearson correlation r > 0.5) within and between groups. There was significant correlation within the variable group describing 25 m transect height structure (). One variable (mean25cm) that contributed most to the separation of singing and comparison positions was further considered within candidate models. The mean chequerboard measure was correlated with other variables within the vegetation density group and with variables in other groups (). Two candidate models resolved between-group correlation and contained independent variables representing each apparently important group ().
Table 2. Significant results from univariate and multivariate (models 1 and 2) generalized mixed models of Grasshopper Warbler habitat measures. The variables have been placed into groups that measure similar aspects, mainly of vegetation structure. The only group with no significant variables and not listed was ‘management and wider landscape’. The signed significance is shown for each variable, as is the presence of between-variable correlation (Pearson coefficient r > 0.5). The predictive accuracy of the two models is given as the percentage correct classification of all measured positions as ‘singing’ or comparison: see text.
Stepwise modelling approaches have been criticised (e.g. Whittingham et al. Citation2006, Mundry & Nunn Citation2009). Nevertheless, the approach was felt to be valid in this case because the variable groups had biological meaning. The relative accuracy of each of the two models was estimated by calculating what percentage of all measured positions was correctly classified as either ‘singing’ or ‘comparison’. This was done using all the data, to create the model equations, and then further tested (in 100 runs) using 50 % of the data from ‘singing’ and ‘comparison’ groups randomly selected to construct the models, and then classify the remaining unseen data.
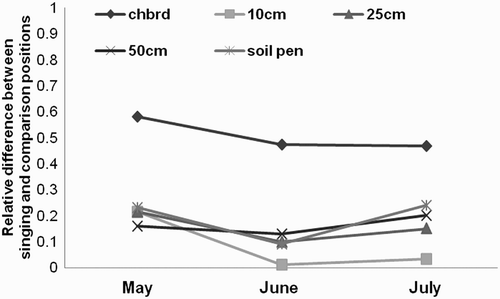
To assess how differences in habitat characteristics (of vegetation density and height structure) between singing and comparison positions changed with monthly growth of vegetation, measures were repeated in mid May, mid June and mid July, at 19 singing and comparison positions located within the first week of May at the four site groups (1–4) in . Of the habitat measures described in , the following were included: chbrd, soilpen, mean10cm, mean25cm and mean50cm. To compare the difference between singing and comparison position measures each month, the resulting differences were divided by the maximum singing position measure.
Predicting occupancy of suitable habitat
At the end of March and beginning of April 2006, two individual sites and four groups of sites (15 sites in total in southwest Scotland) were chosen for their potential occupancy by breeding Grasshopper Warblers (). They were categorized as follows: two key sites (the only ones with known regular history of breeding Grasshopper Warbler), two associated groups of sites near the key sites (i.e. patches of habitat within 2 km of the key sites that looked suitable for Grasshopper Warblers); and two groups of independent sites which looked similarly suitable. Except for the two key sites for which there was more information, sites were chosen by eye for their habitat suitability to Grasshopper Warblers. Habitat that looked like it might be attractive to arriving Grasshopper Warblers was that which provided an early cover of ground vegetation, a mix giving both cover (from dead unmanaged vegetation like grass) and vertical strength, adding structure. None of those sites that contributed data to the predictive habitat model in 2005 () were used to test occupancy in 2006 (). The rationale for locating sites in this way was to look not just at sites already known to have habitat suitable for Grasshopper Warblers (key sites), which we might assume more likely to become occupied to capacity, but also at the apparently suitable habitat nearby which may be less likely to reach capacity, plus a couple of groups of completely unknown sites with apparently suitable habitat for comparison.
A qualitative and quantitative assessment of habitat suitability was based on each site being split into units 100 m square and each unit assigned as suitable or unsuitable. For the qualitative assessment, transects were walked through the site that were at least 50 m apart, and a core map of suggested suitable habitat was drawn by eye within the site boundary. Using this map, each unit could then be attributed as suitable (if >50% covered by suitable habitat) or unsuitable. For the quantitative assessment, habitat measures were made in the centre of each square of a 100 m × 100 m grid drawn within the site boundary (excluding obviously unsuitable habitat such as very short grass or open water). These quantitative habitat measures were made during April and May 2006 and targeted the features highlighted as important for Grasshopper Warblers in 2005 (given in ).
The predicted probability of occupation of each central grid point by a singing Grasshopper Warbler was calculated by inputting the resulting mean habitat measures to the logistic regression equation that included the intercept and model parameter estimates from the six model 2 variables in , and back-transforming the value of the resultant response variable. Each unit was attributed as quantitatively suitable if it had an occupancy likelihood of >0.5.
All sites and groups of sites were surveyed for singing Grasshopper Warblers in May and June using the schedule that had been suggested, by the 2005 investigation, as likely to detect at least 85% of singing males: five weekly visits at 05:00–08:00 hours starting in the first week of May. Any 100-m square was considered occupied if it overlapped with a buffer of 50 m radius around each recorded Grasshopper Warbler singing location. A comparison of actual singing Grasshopper Warbler occupancy versus predicted occupancy (using both qualitative and quantitative assessment of habitat suitability) was then made using McNemar's non-parametric paired comparison tests of predicted and actual occupancy of the units for each site (McNemar Citation1947, Walker Citation2002). Any difference in distribution between the qualitative and quantitative classification of habitat units was assessed with a McNemar's test using all units within the site.
Revisiting CBC plots
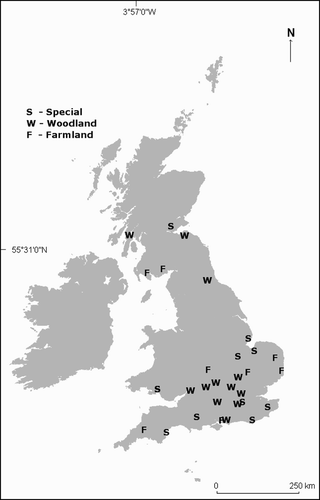
BTO CBC survey plots were identified which had held one or more Grasshopper Warbler territories in at least one year between 1965 and 2000 (), but which local observers confirmed had not had records of the species in the two years previous to the study. Thirty plots were visited to represent a range of geographic locations and habitats: woodland (11 plots with 47 previous territories), farmland (9 plots with 25 previous territories) and ‘other’ (largely dry, lowland grassland, 10 plots with 33 previous territories) (). When the 105 mapped Grasshopper Warbler territory positions were relocated at the 30 sites, both qualitative and quantitative assessments of current habitat suitability were made. For qualitative assessment, all territories were relocated using original maps; and potential habitat suitability was assessed by eye. Quantitative habitat measures were made within 80 territories and a figure for the likelihood of occupation of the area, based on these measurements was derived as described above. Grasshopper Warblers were heard to sing at 4 of the 30 sites whilst habitat measures were being made. These sites and their associated territories were then excluded (one farmland site with eight territories, two woodlands and one ‘other’ site with three territories in each) as the aim was to look specifically at sites that no longer held Grasshopper Warblers.
Table 5. The number of BTO Common Birds Census plots (or sites) visited and the number of territories that had originally been occupied by breeding Grasshopper Warblers. Current suitability was assessed by eye (qualitatively) and by habitat measures taken (as in ) from as near the middle of the original territory as possible (quantitatively).
Figure 3. British Trust for Ornithology Common Birds Census plots visited in 2006. These plots had all held breeding Grasshopper Warblers but, when revisited, had been unoccupied for at least two years. The 30 plots were split into woodland, farmland and ‘other’ habitat categories. There were 105 previously occupied territories throughout these plots that were visited to assess their current suitability for breeding Grasshopper Warblers.
Data were analysed using SAS version 9.2 (SAS Institute Inc. Citation2008).
RESULTS
Detection and monitoring
In all, 240 survey visits were made to four site groups. Half of these visits detected at least one singing Grasshopper Warbler. gives the numbers of birds detected at each site group. Clusters of singing males estimated to be the same individuals or territories during the season were on average 244 m (sd ±176 m, range 71–742 m, n = 24) away from an adjacent territory within the same site. The maximum distance between any two registrations of a singing male estimated to be within the same cluster was 118 m.
Table 3. Four groups of sites surveyed for singing Grasshopper Warblers from 1 May to the end of July. Locations in . The percentage of visits that detected at least one singing male, the maximum number of singing males heard on any one survey visit, and the estimated number of occupied territories detected during the survey period.
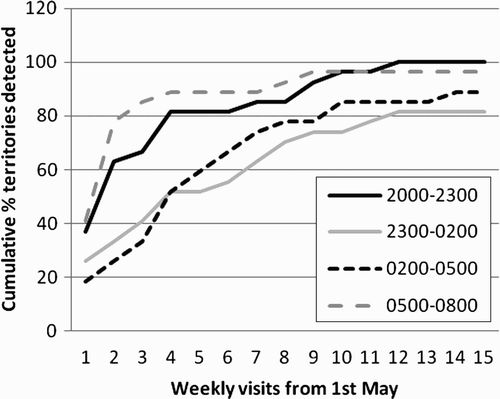
Males were heard to sing throughout the night-time survey period, with no significant difference in the overall mean number of males heard in different night-time survey periods throughout the season (night-time survey periods, mean ± se: 20:00–23:00 hours, 4.7 ± 0.9; 23:00–02:00 hours, 3 ± 0.5; 02:00–05:00 hours, 5.1 ± 0.5; 05:00–08:00 hours, 5.9 ± 1.1; F = 2.5, df = 3,15, P < 0.069). Singing Grasshopper Warblers were heard in each of the 15 weeks. More males were heard to sing in the first four weeks (in May) than later in the season () and in May males were more likely to be heard in the 05:00–08:00 hours period ().
Figure 4. The percentage of male Grasshopper Warblers present throughout the breeding season that were singing each week from 1 May. The singing males systematically surveyed at four groups of sites in southwest Scotland in 2005 occupied an estimated 24 territories.
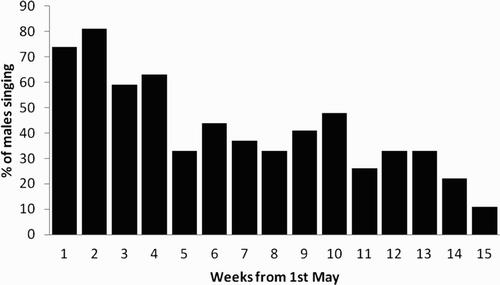
Figure 5. The cumulative percentage of Grasshopper Warbler territories detected during different diel time periods during weekly survey visits to sites in southwest Scotland in 2005. Each week every site was surveyed during each night-time period. The total number of territories detected across all site groups was 24.
Night period and week had an effect on the likelihood that each individual male would be heard on each visit (GENMOD GEE analysis, night period χ2 = 13.77, df = 3, P < 0.0032; week χ2 = 12.17, df = 14, P < 0.0005), with a significant interaction between night-time period and week, but no significant effect of site group (night period × week χ2 = 11.64, df = 3, P < 0.0115; site group χ2 = 1.5, df = 3, P = 0.68).
Three, weekly visits in the first three weeks of May, during the 05:00–08:00 hours night-time survey period detected 85.2 % of territories ().
Breeding habitat characterization
The candidate model that correctly classified the most singing and comparison positions () contained six variables, all of which had a positive association with singing positions: coverage of both tussocky and dead vegetation (from within the vegetation density group); the number of songposts more than 2 m high, soil penetrability, consistently good coverage of vegetation 25 cm high in the surrounding 25 m radius; and an interaction between good coverage of low vegetation (50 cm height ground vegetation) and poor coverage of high vegetation (more than 2 m height).
Of the 210 Grasshopper Warbler singing positions that had measures taken, 179 had tussocky vegetation present. Tussock structure was provided by grasses (e.g. tufted hair grass Deschampsia cespitosa), rushes (e.g. soft rush Juncus effusus) and sedges (e.g. greater tussock sedge Carex paniculata). In cases where tussocks were absent, other plants that seemed to provide equivalent vertical structure were reed Phragmites australis (14), bramble Rubus fruticosus (8), reed canary grass Phalaris arundinacae (4), heather Calluna vulgaris (2), juniper Juniperis communis (1), hawthorn Crataegus monogyna (1) and saw sedge Cladium mariscus (1). The association of singing positions with more-tussocky vegetation seems most likely in relation to its vertical strength in combination with dead vegetation. It was noticeable that dead vegetation (mostly grasses) in the surrounding areas without vertical structure was often lodged or flattened, with a less complex structure.
The vegetation density and height structure measures made at monthly intervals differed between singing and comparison positions (). The mean chequerboard measure of vegetation density at ground level shows the biggest difference and this was maintained even into July, when new vegetation growth was advanced.
Figure 6. Relative difference between 19 Grasshopper Warbler singing and comparison positions for a range of habitat measures through the season.
Occupancy of predicted suitable habitat
Twelve of the 15 sites that held habitat predicted to be suitable for singing Grasshopper Warblers were occupied in 2006; two of these were known regular sites. The density of occupied habitat varied between 0.16 and 0.85 estimated territories per ha of habitat assessed as suitable (). Across all units, from all sites, qualitative and quantitative methods were equally likely to predict a unit as suitable (McNemar's test S = 1.1, P = 0.38, n = 220). However, at all groups of sites there were more units of habitat assessed as suitable than were actually occupied ().
Table 4. Predicted habitat suitability and Grasshopper Warbler occupancy of 15 sites. These were two key sites (A & B on ) and two groups of sites within 2 km of key sites; and two groups of non-key sites (C & D on ). Habitat was predicted to be suitable by qualitative and quantitative criteria and measured in units 100 m square. McNemar's test was used to test for significant differences between predicted and actual occupancy (n = number of units). The density estimate is the estimated number of territories from singing male registrations within mapped, qualitatively suitable habitat.
CBC plots revisited
All of the originally occupied territories classed as woodland were categorized as currently unsuitable for Grasshopper Warblers in both qualitative and quantitative assessments ().
Of 42 now unsuitable woodland territories, 30 had progressed to mature woodland of which 21 had little or no understorey and 4 of these were grazed. Of the other 12 unsuitable woodland territories, 7 had been cleared and were being grazed by either cattle or horses, 4 had been cleared and were being used as footpaths, rides or access routes, and 1 was now a garden.
Of the 17 territories classed as farmland, 2 were qualitatively suitable and from habitat measures, 1 of these was the only one of 105 categorized as quantitatively suitable. The measure of quantitative suitability or predicted probability of occupation (see Methods) in this case was 0.669 (). Of the 15 farmland territories now classed as unsuitable, 7 were being grazed by either cattle or horses (likely to be a change from the original land use when Grasshopper Warbler territories were occupied); 2 had succeeded into mature scrub woodland; 2 had had a central hedge removed; 2 territories with ditches at the centre were dry with no wet or thick vegetation; and 2 territories had mature hedges grazed up close on one side and with a narrow strip of sparse vegetation on the other side.
Of the 30 territories classed as from ‘other’ habitats, 4 contained qualitatively suitable habitat; on quantitative criteria, however, none was classed as suitable (). Of the 26 territories in other habitats that were classed qualitatively as being unsuitable for Grasshopper Warblers, 12 had become dominated by mature woodland, and within this mature woodland 2 territories were additionally grazed and 5 had gained new paths, rides or clearings. Another 12 territories had been cleared and grazed and a further 2 were dominated by bracken Pteridium aquilinum.
DISCUSSION
Initial work to assess the most efficient time to survey Grasshopper Warblers greatly reduced the risk that detectability problems would confound the assessment of habitat associations that was the central aim of this study. Any use of these findings for monitoring purposes should take into consideration the latitude of the site, and more detailed study of singing activity should link singing activity directly to dusk and dawn as the season progresses, as in Kloubec & Ĉapek Citation(2005).
Grasshopper Warbler nests are concealed near the ground and attached to more-rigid vertical vegetation (Glue Citation1990), and birds seem to prefer to forage and travel around the nest, hidden within the ground vegetation (Cramp Citation1992). The preference found in this study for this type of cover at least 25 m from a known point of singing is therefore not surprising. It is not possible to say whether the importance of greater soil penetrability, and even the microhabitat provided by tussocks and dead vegetation, is as much related to the presence of food as to the ability of the birds to access that food, secure and unseen. The tussock structure of sedge and grass vegetation is known to increase plant species richness, add surface area and microhabitats, increase the cover of dead vegetation (Peach & Zedler Citation2006), and, for invertebrates, provide habitat and particularly winter refuges (Morris Citation2000).
In most cases it was quite clear why Grasshopper Warblers were no longer breeding in the CBC plots visited, with only one territory that was suitable and yet appeared to be unoccupied. The two main reasons for desertion were succession to a closed woodland canopy or management which had removed the critical basal vegetation ground layer. There is no reason why the CBC plots visited are not representative of habitat that has at some point been suitable for Grasshopper Warblers. If this is the case, these results suggest a significant loss of available breeding habitat caused by woodland succession and increased grazing pressure. An important caveat here is that we did not measure equivalent areas that were formerly unoccupied by Grasshopper Warblers, to test the possibility that other sites may have become suitable (e.g. through succession).
The habitat predicted as suitable was not completely filled, which suggests that, assuming our assessment of habitat suitability was correct, breeding habitat was not limiting the population, at least not in that year and study areas. However, this detailed prediction was in a restricted area compared to the CBC plots and in a part of Britain that has experienced recent reductions in grazing intensity that might benefit Grasshopper Warblers (SAC Citation2008). We were able to show that breeding habitat in Britain is a likely driver of population change, although there are also records of short-term variation in numbers reported at sites where there has been no apparent change in breeding habitat (e.g. Donald Citation2007). Realistically, to unravel the main influences on this species, we would have to examine longer-term availability of suitable breeding habitat alongside some assessment of population dynamics.
As a species that is known to have undergone a severe decline in numbers, and with the current trend unclear, we should as a minimum seek to maintain the existing amount of breeding habitat. In order to do this, two main approaches need consideration. The first is to acknowledge the importance of existing habitat in Britain, particularly wet, rush-dominated, or drier, tussock-grass-dominated sites. Despite providing vegetative structure, particularly important early in the breeding season, these habitats may not be within protected areas, and may be more liable to receive intensive management such as drainage, vegetation clearance or grazing. Even within protected areas where the importance of habitat heterogeneity is valued, the direct link with this type of habitat and its importance for Grasshopper Warblers may not have been made. The second approach would be to positively promote breeding habitat for Grasshopper Warblers, by design rather than by accident. This could involve a more strategic look at the availability of the successional habitats favoured by the species and to directly encourage the creation of more. For example, there may be aspects of forest management and the rotation of planting that could actively make the most of young plantations as habitat for Grasshopper Warblers (Sweeney et al. Citation2010). Links could be made with other species, for example Black Grouse Lyrurus (Tetrao) tetrix, and other habitat initiatives (for example, large-scale native woodland planting schemes). The type of habitat that could be targeted by land managers as providing potential breeding habitat could be any ground habitat with rigid vertical vegetation, around which dead vegetation can collect, providing structure in which birds can move around. Without tussocks or more rigid structure, even unmanaged land may not be suitable as winter flooding or snow fall can result in compaction of dead vegetation making it a lot less useful as early or breeding cover. The type of habitat preferred by this species is associated with reduced management and much of it exists because it has been left unmanaged for a specific reason, as is the case in young forestry plantations, or it is effectively set aside awaiting another purpose, sometimes development. It often has a negative label, even within protected nature reserves, for example ‘waste ground’, unmanaged, rank, abandoned, rush-infested or marginal. Without the positive justification for not managing an area of habitat, for example as Grasshopper Warbler habitat, it seems that it is human nature to want to manage it or tidy it up.
ACKNOWLEDGEMENTS
This project was funded by RSPB and Natural England through the ‘Action for Birds in England’ partnership programme: thanks to Phil Grice of Natural England for his support. Thanks to the BTO; John Marchant and Richard Thewlis for help and providing mapped CBC information. Thanks to the volunteers who assisted with data collection, to all those who provided details of Grasshopper Warbler locations, in particular Andy Stanbury, James How and Pete Moore. Thanks to John Tayton for data on CBC plots visited. Thanks to Richard Gregory, Jeremy Wilson, John Marchant and Phil Grice for comments on an earlier version of the manuscript.
REFERENCES
- Baillie , S. R. , Marchant , J. H. , Leech , D. I. , Renwick , A. R. , Joys , A. C. , Noble , D. G. , Barimore , C. , Conway , G. J. , Downie , I. S. , Risely , K. and Robinson , R. A. 2010 . Breeding Birds in the Wider Countryside: Their Conservation Status 2010 BTO Research Report 565. BTO, Thetford. (www.bto.org/birdtrends)
- Bayly , N. J. and Rumsey , S. J.R. 2007 . Grasshopper Warbler Locustella naevia autumn migration – findings from a study in southeast Britain . Ringing & Migration , 23 : 147 – 155 .
- Callion , J. , White , N. and Holloway , D. 1990 . Grasshopper Warblers raising two and three broods in Cumbria . Br. Birds , 83 : 506 – 508 .
- Cramp , S. 1992 . The Birds of the Western Palearctic , Edited by: Cramp , S. Vol. 6 , Oxford : Oxford University Press .
- Donald , C. 2007 . “ Grasshopper Warbler ” . In The Birds of Scotland: 1169–1171 , Edited by: Forrester , R. W. , Andrews , I. J. , McInerny , C. J. , Murray , R. D. , McGowan , R. Y. , Zonfrillo , B. , Betts , M. W. , Jardine , D. C. and Grundy , D. S. Aberlady : The Scottish Ornithologists' Club .
- Eaton , M. A. , Brown , A. F. , Noble , D. G. , Musgrove , A. J. , Hearn , R. D. , Aebischer , N. J. , Gibbons , D. W. , Evans , A. and Gregory , R. D. 2009 . Birds of Conservation Concern 3: the population status of birds in the United Kingdom, Channel Islands and Isle of Man . Br. Birds , 102 : 296 – 341 .
- Forestry Commission . 2008 . National Inventory of Woodland and Trees 1995–1999: Analysis of Management and Biodiversity Data , Edinburgh : Forestry Commission .
- Gibbons , D. W. , Reid , J. B. and Chapman , R. A. 1993 . The New Atlas of Breeding Birds in Britain and Ireland: 1988–1991 , London : T & AD Poyser .
- Glue , D. E. 1990 . Breeding biology of the Grasshopper Warbler in Britain . Br. Birds , 83 : 131 – 145 .
- Kloubec , B. and Ĉapek , M. 2005 . Seasonal and diel budgets of song: a study of Savi's Warbler (Locustella luscinioides) . J. Ornithol. , 146 : 206 – 214 .
- Map Info . 2007 . Map Info Professional User's Guide Version 9. Pitney Bowes Map Info Corporation, New York
- Marchant , J. H. 1983 . BTO Common Birds Census Instructions , Tring : BTO .
- Marchant , J. H. , Hudson , R. , Carter , S. P. and Whittington , P. A. 1990 . Population Trends in British Breeding Birds , Tring : BTO .
- McNemar , Q. 1947 . Note on the sampling error of the difference between correlated proportions or percentages . Psychometrika , 12 : 153 – 157 .
- Mead , C. J. and Hudson , R. 1985 . Report on bird ringing for 1984 . Ringing & Migration , 5 : 125 – 172 .
- Morris , M. G. 2000 . The effects of structure and its dynamics on the ecology and conservation of arthropods in British grasslands . Biol. Conserv. , 95 : 129 – 142 .
- Mundry , R. and Nunn , C. L. 2009 . Stepwise model fitting and statistical inference: turning noise into signal pollution . Am. Nat. , 173 : 119 – 123 .
- Nature Conservancy Council . 1986 . Nature Conservation and Afforestation in Britain , Peterborough , , UK : NCC .
- Newton , I. 2004 . Population limitation in migrants . Ibis , 146 : 197 – 226 .
- Peach , M. and Zedler , J. B. 2006 . How tussocks structure sedge meadow vegetation . Wetlands , 26 : 322 – 335 .
- Riddiford , N. 1983 . Recent declines of Grasshopper Warblers Locustella naevia at British bird observatories . Bird Study , 30 : 143 – 148 .
- SAC . 2008 . Farming's Retreat from the Hills , Edinburgh : Scottish Agricultural College .
- SAS Institute Inc . 2008 . SAS/STAT 9.2 User's Guide , Cary , NC : SAS Institute Inc .
- Škorpilová , J. , Voříšek , P. and Klvaňová , A. 2010 . Trends of common birds of Europe 2010, an update , PECBMS 2010. http://www.ebcc.info/index.php?ID=387
- Sweeney , O. F.McD. , Wilson , M. W. , Irwin , S. , Kelly , T. C. and O'Halloran , J. 2010 . Breeding bird communities of second rotation plantations at different stages of the forest cycle . Bird Study , 57 : 301 – 314 .
- Walker , G. A. 2002 . Common Statistical Methods for Clinical Research with SAS Examples , 2 , Cary , NC : SAS Institute Inc .
- Whittingham , M. J. , Stephens , P. A. , Bradbury , R. B. and Freckleton , R. P. 2006 . Why do we still use stepwise modelling in ecology and behaviour? . J. Anim. Ecol. , 75 : 1182 – 1189 .