
Abstract
Capsule Habitats in lowland South Iceland sustain bird populations of international importance, with highest densities in wet habitats.
Aims In areas important for biodiversity there is an urgent need to assess large-scale variation in the biodiversity value of habitats to inform management. We carried out a large-scale survey to assess the conservation value of sub-arctic, Icelandic bird habitats.
Methods Bird counts were carried out on 200 transects in the five most common vegetated habitat types in South Iceland. Based on these counts, breeding bird density and diversity were compared between habitats and total population sizes of common species in these habitats were calculated.
Results Overall, eight species (seven waders and Meadow Pipit) composed over 95% of all birds counted. The combined density of those species exceeded 275 birds/km2 in all habitats. The two wettest habitat types had the highest density of birds.
Conclusion Wet habitats in lowland South Iceland held particularly high densities of breeding birds, notably waders, which constitute populations of international importance. Wet habitat types are generally of higher value for more species, than dryer ones.
Habitats are being altered extensively at an accelerating rate to fulfil the ever-growing human need for resources. These changes are often the cause of a degradation of environmental conditions, and are one of the major drivers of biodiversity loss (Vitousek et al. Citation1997, Sala et al. Citation2000). Reducing the impact of land-use intensification on biodiversity is one of the most urgent challenges in conservation. Identifying areas which are important for biodiversity is key to developing land-use planning approaches that are able to consider impacts on biodiversity (Myers et al. Citation2000, Eken et al. Citation2004), but often there is a lack of information on which to build this identification. Rapid environmental changes are occurring in many poorly studied areas in the arctic and sub-arctic, as a result of agricultural intensification, fossil fuel mining and climate change (ACIA Citation2005). These changes are likely to have a major impact on many migratory populations throughout their range and, as migratory populations can be regulated by interactions between factors that operate in both winter and summer (Gill et al. Citation2001, Gunnarsson et al. Citation2005), the effects of habitat change in one season can have consequences for populations throughout their migratory ranges (Newton Citation2004).
Icelandic ecosystems support internationally important populations of 21 breeding bird species (Einarsson et al. Citation2002) and, for some species, are responsible for a large part of the world population (Wetlands International Citation2006). Iceland is of particular importance for breeding waders (Charadrii) in the northern hemisphere (Gunnarsson et al. Citation2006); and is thought to be the second most important breeding area for waders in Europe, after the vastly larger Russia (Thorup Citation2004). Nearly half of the species which occur in internationally important numbers in Iceland are waders, but wader populations have been declining worldwide in recent years; mostly because of habitat degradation and destruction (International Wader Study Group Citation2003). Reversing such declines requires information on the relative importance of different habitat types for individual species, and on the threats facing these habitats, to implement successful conservation. The global importance of Iceland for migratory wader populations is likely because of expanses of suitable open habitats, a sparse human population and fairly low-intensity agriculture (Gunnarsson et al. Citation2006). Despite the country being still quite sparsely populated, land-use intensity increased very rapidly during the last decades of the 20th century. About 55–75% of Icelandic wetlands have been drained to some extent (Óskarsson Citation1998) and nearly 97% of the wetlands in South Iceland, the largest lowland basin, have been partially or entirely drained (Thorhallsdottir et al. Citation1998). In the first decade of the 21st century, land-use changes accelerated greatly; conversion of natural landscapes into man-made surfaces in Iceland increased by about 20% between the years 2000 and 2006, and by over 30% in South Iceland, while in most European countries the increase was less than 5% during the same period (EEA Citation2010, Wald Citation2012). Man-made surfaces refer to roads, urban, industrial and recreation areas (EEA Citation2010). These rapid land-use changes make the assessment of landscape-scale biodiversity patterns matter of urgency.
The aim of this study was to assess the relative importance of key habitats in the lowlands of South Iceland for breeding birds, both in a national and an international perspective. South Iceland is the largest lowland basin and has 21% of the total lowland area in Iceland below 200 m a.s.l. (National Land Survey of Iceland Citation2013). Land-use changes have been most rapid in South Iceland due to the proximity to the capital (Wald Citation2012) and the density of breeding waders is also greatest there (Gunnarsson et al. Citation2006). We used data from ground surveys of birds and a digital land cover database to assess density, population sizes and distribution of common birds in the mosaic of lowland habitats in South Iceland.
METHODS
Study area
Bird counts were carried out in the lowlands of South Iceland. The boundaries of the study area were defined as within the two administrative regions (counties), Árnessýsla and Rangárvallasýsla, and below 200 m a.s.l. (). The landscapes in the lowlands of South Iceland are generally flat, only 2.5% of the area below 400 m a.s.l. has a gradient of more than 20° (Wald Citation2012). The area is one of the most important agricultural regions in Iceland, providing 36% of annual agricultural GDP in the year 2010 (FAI Citation2010) and about 10% of land below 400 m a.s.l. comprises cultivated hayfields (Wald Citation2012).
Figure 1. Map of South Iceland, including the study area, showing the position of study plots where bird abundance was surveyed. Sampling was restricted to areas below 200 m a.s.l.
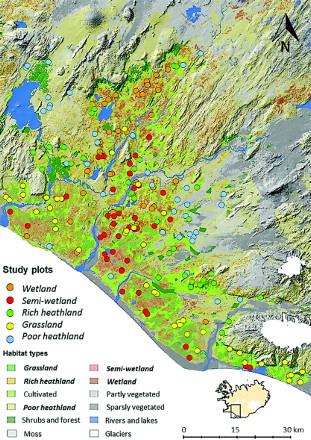
The land cover information used in the study was extracted from the Icelandic Farmland Database. This database uses satellite images with extensive ground truth verification to classify the surface of Iceland into 12 different classes (Arnalds & Barkarson Citation2003). The classification represents variables that reflect productivity, mostly vegetation cover, soil and drainage, and these variables are often strongly related to biodiversity (Noss Citation1990). The Icelandic Farmland Database classifies land down to the scale of 196 m2 (pixel size 14 × 14 m). Survey sites within the five most common vegetated habitat classes, which land-use intensification is likely to mostly affect, were selected by a stratified random method, employing ArcGis 10.1 GIS software. Sites were selected so they covered at least 20 ha of a single habitat type to reduce effects of adjacent habitats. For practical reasons, sites were selected so they were no more than 2 km from roads but not closer than 0.5 km to each other, which should be enough for independence of survey points. Previous studies have shown that the distribution of habitat types in lowland Iceland is comparable in respect to distance from roads (Gunnarsson et al. Citation2006). In total, 200 sites were surveyed, 40 of each habitat (). These five classes were wetland (total cover in the study area: 301 km2), semi-wetland (426 km2), rich heathland (420 km2), grassland (384 km2) and poor heathland (862 km2) () (habitat types in italics from now). These habitat types together comprised 2393 km2, or 58%, of the study area. Other habitat types in the area, not surveyed for practical reasons, were mainly agriculture (95% of which are hayfields), forests and sparsely vegetated (sandy areas) habitat types.
Table 1. Description of the five habitats from the Icelandic Farmland Database where counts of birds were conducted in this study (Arnalds et al. Citation2003).
Censuses
The surveys were conducted from the middle of May until the end of June, which is the peak breeding season for most species, in 2011 and 2012. Counts were performed during periods of greatest bird activity, in the morning from 06:00 to 13:00 and in the afternoon from 17:00 to 22:00 (Davíðsdóttir Citation2010). Surveys were only conducted when wind speed was lower than 6 m/s and in dry weather to avoid conditions of low bird detectability (Bibby et al. Citation2000). At each site, birds were counted along one line transect (Bibby et al. Citation2000). Transects were on average 511 m long (sd = 69.4 m). The total length of transects covered was 101 km. The perpendicular distances of birds from the transect line was recorded in four distance bands, 0–25, 25–50, 50–75, 75–100. The observer used binoculars with a built-in laser range-finder to determine distances to birds.
In 2012, invertebrate surveys were carried out simultaneously with the bird surveys on all the last 58 survey points (average 11.6 survey points per habitat, sd = 2.4) to relate bird abundance to variation in food abundance between habitats (Gunnarsson et al. Citation2005). The surveys were designed to sample the part of the invertebrate community that is the main food source for breeding birds, especially foraging chicks, by focusing sampling on foliar invertebrate communities. A sweep net (diameter 39 cm, mesh size 0.3 mm) was used to sample invertebrates with ten equal strokes through vegetation at three points on the line transect (at 25, 250 and 450 m). Invertebrates were sorted into broad groups and all individuals ≥3 mm were counted from the sweep net in the field and then released. The groups used were spiders (Araneae), beetles (Coleoptera), true bugs (Hemiptera), butterflies (Lepidoptera), flies (Diptera, Hymenoptera and Trichoptera) and larvae.
Data analysis
Bird densities were calculated using the length of transects and number of observations for each species and their observation distances (Bibby et al. Citation2000). Birds detected outside the 100 m belt were excluded from the analysis. Birds passing by were not recorded, only those using the habitat, on the ground or displaying over it. The density unit calculated was individuals/km2, a conservative measure which avoids biases associated with estimation of status (e.g. breeding or foraging). The programme Distance (version 6.0) was used to estimate bird density on the line transects. The programme models the decline in detectability of birds with increasing distance from the transect line and uses this information and transect length to calculate density. Density estimates were only calculated for the eight most common species, which were Oystercatcher Haematopus ostralegus, Golden Plover Pluvialis apricaria, Dunlin Calidris alpina, Snipe Gallinago gallinago, Whimbrel Numenius phaeopus, Black-tailed Godwit Limosa limosa, Redshank Tringa totanus and Meadow Pipit Anthus pratensis. This is because a minimum number of observations is required to derive sensible detection curves for individual species (Buckland Citation2001). These eight species comprised 95% of the total number of birds recorded on transects. For density analyses of the eight most common species, three key functions were calculated; uniform, half-normal and hazard-rate, with either cosine, simple or hermite polynomials adjustment terms. The key function with the lowest Akaike's Information Criterion (AIC) score was used. When producing a single density estimate of all species combined, for the comparison of habitats, the same detection curve for each bird species (calculated from its abundance across different distance bands) was used for all habitats. When producing density estimates for individual sites (used to model individual species density in different habitats), every species was assigned a specific detection curve for each habitat, based on lowest AIC scores.
Differences in bird densities between habitat types were modelled with generalized linear models with a negative binomial error distribution and a log link function to account for overdispersion (Zuur Citation2009). The explanatory variable was a 5-level factor of habitat type.
To assess variation in bird diversity between habitats, the total number of species, mean number of species and the Shannon–Wiener index were computed (Shannon Citation1948).
To estimate the relative importance of South Iceland for birds, regional population sizes of common species were estimated, for the surveyed habitat types. These population sizes are a minimum estimate for the study area because several habitat types were excluded from the surveys, which included only the five most common vegetated habitat types. Population estimates were derived by multiplying the density estimates and 95% confidence intervals obtained from the Distance programme by the total area of each habitat type in South Iceland, and then summing these across habitats to produce regional population estimates for the surveyed habitat types.
Statistical analyses, other than estimates of species density, were performed in the programmes SPSS (IBM Corp Citation2012) and R (R Development Core Team Citation2008).
RESULTS
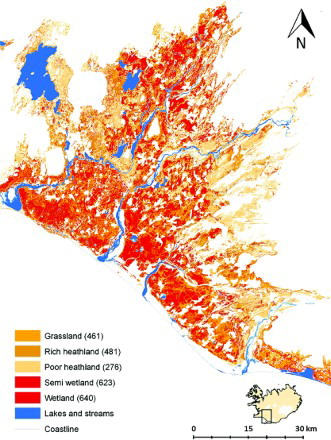
A total of 5128 birds of 22 species were recorded on the 200 sites surveyed. Most of the species were uncommon and eight species dominated: Oystercatcher, Golden Plover, Dunlin, Snipe, Whimbrel, Black-tailed Godwit, Redshank and Meadow Pipit made up 95% of the total number of individuals recorded. The average combined density of the eight most common species was highest in wetland and semi-wetland with around 630 individual birds per km2 (, ). Rich heathland and grassland were similar with bird density around 470 individuals per km2 but poor heathland had the lowest density with 275 individuals per km2 ().
Figure 2. Distribution of the combined density of the eight most common bird species in the five habitats from the Icelandic Farmland Database below 200 m a.s.l. Total density (individuals/km2) of the eight species per habitat is shown in parenthesis in the legend of the map.
The abundance of most individual species was similar to the combined pattern () but with some exceptions. Abundance was generally highest in wetland and semi-wetland for most species: Dunlin, Snipe, Whimbrel, Black-tailed Godwit and Meadow Pipit occurred in their highest densities in these two habitats (), but Whimbrel also occurred at similarly high densities in both heathland types. Oystercatcher and Redshank occurred in highest densities in grassland and the latter also in wetland and semi-wetland. Golden Plover occurred in highest densities in poor and rich heathland. All models predicting the abundance of individual species in different habitat types were highly significant with all species showing a significant difference in density between one or more habitats ( –).
Table 2. Comparison of measures of bird and invertebrate density (±se) and bird diversity in the five habitats surveyed in lowland South Iceland in 2011–2012.
Table 3. Results of generalized linear models (negative binomial with log link) predicting species abundance in different habitats (see ). Number of individual birds per transect was modelled with transect length in km as an offset variable. Reference habitat was wetland.
Table 4. Significance scores from a generalized linear model pairwise comparison of density of common species between habitats (). Habitats that were significantly different are shown, habitats with significantly higher densities are shown in bold and habitats with significantly lower densities are shown normal. W = wetland, SW = semi-wetland, RH = rich heathland, G = grassland, PH = poor heathland. Direction of relationships was determined with Least Significant Difference Post-Hoc tests.
Total number of species ranged from 14 in wetland to 20 in grassland. This was in contrast with the mean number of species which was highest in wetland, followed by semi-wetland, rich heathland and grassland which had a similar mean number of species, but poor heathland had the fewest (anova on average number of species; F 4,195 = 8.3 P < 0.0001). The Shannon–Wiener index ranged from 1.01 to 1.35; wetland had the highest score and poor heathland the lowest (anova on Shannon–Wiener index; F 4,195 = 3.66, P = 0.007) (). The abundance of large (>3 mm) invertebrates captured by sweep-netting varied significantly among the five habitats. Comparison of invertebrate density between habitats showed an overall significant difference (Kruskal–Wallis: H 4 = 15.0, P = 0.005). Overall variation between habitats was similar ranging from 83 to 96 invertebrates on average per transect. Only poor heathland showed a significant difference in invertebrate abundance with, on average, 35 invertebrates per transect (). There was not a significant correlation between the abundance of birds and invertebrates on individual transects across all habitats (Pearson r = 0.09, P = 0.49, df = 56).
Population size estimation showed that 25% or more of the Icelandic populations of Oystercatcher, Snipe, Whimbrel, Black-tailed Godwit and Meadow Pipit breed in the five surveyed habitat types in the lowlands of South Iceland, including over 50% of the Black-tailed Godwit population and at least 30% of Oystercatcher and Meadow Pipit populations (). Furthermore, the lowlands of South Iceland accommodate 10–20% of the estimated European populations of Dunlin, Whimbrel and Black-tailed Godwit.
Table 5. Estimated population sizes (individuals/km2) of the eight common species in the five surveyed habitat types in South Iceland. Proportions of estimated Icelandic and European populations in the five habitats in the study area are shown.
DISCUSSION
Iceland supports internationally important breeding bird populations of a range of ground-nesting species. The measures of avifauna in the five different habitats from the Icelandic Farmland Database showed that the wetter habitats are more important for bird biodiversity; wetland and semi-wetland have higher density of birds, higher mean number of species per transect and higher diversity index scores than other habitats in the study. Massive decline in area of wetlands in Iceland (Óskarsson Citation1998, Thorhallsdottir et al. Citation1998), and worldwide (OECD & IUCN Citation1996), further enhances the importance of these habitats for biodiversity on an international scale.
This study has shown that densities of the eight most common species are extremely high across the major vegetated, semi-natural habitats of lowland Iceland. All the five habitat types have very high densities of these species, in comparison to estimates from similar habitats in other countries. For example, density estimates on grasslands from the Netherlands (for Oystercatcher, Snipe, Black-tailed Godwit and Redshank), are on average 44% of density in Iceland (Teunissen & Van Paassen Citation2013). Density estimates from moorland, the largest extent of semi-natural habitat remaining in the UK for seven of the eight species involved (excluding the Black-tailed Godwit) are on average only 6% of the density recorded in Iceland (Grant & Pearce-Higgins Citation2012). So on a broad scale, density is relatively high in Iceland even though smaller areas of habitats with exceptional concentrations of waders can be found, for example, the machair habitat, on the north-west coast of the UK (Calladine et al. Citation2014). Overall, 22 species of birds were recorded in the five habitat types but only eight of them composed 95% of the recorded individuals: 7 species of wader and one passerine (Meadow Pipit). Densities of birds differed between habitat types although there was a general preference for wetter habitats. This is in agreement with other studies on habitat preferences of waders and the Meadow Pipit in Iceland (Gunnarsson et al. Citation2006, Citation2007) and other countries (Fuller et al. Citation2005, Smart et al. Citation2006). A few species did not fall into the general pattern. Grassland was significantly more favoured by two species; Oystercatcher and Redshank, and heathland habitats were preferred by the Golden Plover. Redshank and Oystercatcher are usually associated with agricultural grasslands and the results presented here are supported by previous studies in Iceland and elsewhere (Gunnarsson et al. Citation2006, Smart et al. Citation2006). Golden Plover occurs most frequently on heathland throughout its range (Byrkjedal & Thompson Citation1998) which was confirmed in this study.
Habitats did not only differ in density of species but also in diversity (). Considering species richness, there was a slight difference between the habitats which had the highest and the lowest total numbers of species recorded per habitat of 30%. Most species were found in grassland but fewest in wetland. Measures of mean number of species per transect in different habitats and the Shannon–Wiener index ranked wetland at the top and poor heathland with the lowest diversity which is more in accordance with the preference of most species for wetlands. A possible explanation for the highest overall number of species occurring in grassland could be higher heterogeneity of the grassland habitat, due to more intensive drainage and higher variation in grazing as habitat heterogeneity is closely linked to species richness (Benton et al. Citation2003). However, the total number of species in these habitats is relatively low, so absolute differences in species diversity between habitats are small.
The invertebrate survey yielded similar invertebrate catches between habitats but only poor heathland was significantly different with lower catches on average. This was in accordance with bird densities which were also lowest on poor heathland.
The estimated regional population sizes suggest that the lowlands of South Iceland support very large populations of most of the common species despite the fact that several other habitat types (e.g. agriculture, forests and sparsely vegetated habitat types) were not surveyed for practical reasons. Three of the common species, Golden Plover, Dunlin and Whimbrel, occur in internationally important numbers in Iceland (Einarsson et al. Citation2002) and the rest, Black-tailed Godwit, Redshank, Meadow Pipit, Snipe and Oystercatcher, are all species facing a decline in their European breeding range (Birdlife International Citation2004). Previous studies comparing density of waders in wet habitat types across different parts of Iceland suggest that the average density of waders in South Iceland is generally higher (up to five fold higher than in West and East Iceland) than elsewhere (Gunnarsson Citation2010). A recent study suggests that this large-scale variation is largely due to the fertilizing effects of volcanic dust which shows a gradient in deposition across Iceland (Gunnarsson et al. submitted). So it is evident that South Iceland supports a substantial part of the total Icelandic populations of many of the focal species and a large part of the European population of some. If subspecies were considered, the international conservation status would be increased, because most of the wader species in Iceland have a subspecies status (Guðmundsson & Skarphéðinsson Citation2012).
All of the five habitats have high densities but different habitats are disproportionally important for bird biodiversity. Wetland and semi-wetland have higher densities than the other habitats, and host a higher mean number of species, and more declining species. There have been major declines in wetlands, both in Iceland (Óskarsson Citation1998, Thorhallsdottir et al. Citation1998) and worldwide (OECD & IUCN Citation1996) so the scarcity of wetlands makes them relatively more important. Wetlands in the study area account for 16% of the total area of wetlands in Iceland (The Farmland Database Citation2013). Judging by both their higher biodiversity value and scarcity, it is evident that wetland and semi-wetland habitats have the highest conservation value. But it is also important to consider that different habitats are important for different species and though wetter habitats are of relatively greater importance for more species, drier habitats can be important for some, notably the Golden Plover.
ACKNOWLEDGEMENTS
We thank Jennifer A. Gill, two anonymous referees and the editor, Will Cresswell, for comments and advice that greatly improved the paper and Ólafur Karl Nielsen for assistance with Distance analysis. The authors would also like to thank the numerous landowners who granted us permission to work on their land.
Funding
This work was supported by the University of Iceland Research Fund; Pálmi Jónsson Nature Conservation Fund and the Icelandic Research Fund [grant number 130412-051].
References
- ACIA. 2005. Arctic Climate Impact Assessment. Cambridge University Press, New York.
- Arnalds, O. & Barkarson, B. 2003. Soil erosion and land use policy in Iceland in relation to sheep grazing and government subsidies. Environ. Sci. Policy 6: 105–113. doi: 10.1016/S1462-9011(02)00115-6
- Arnalds, O., Thorsson, J. & Thorarinsdóttir, E.F. 2003. Landnýting og vistvæn framleiðsla sauðfjárafurða. Fjölrit RALA. The Agricultural Research Institute, Reykjavík.
- Benton, T.G., Vickery, J.A. & Wilson, J.D. 2003. Farmland biodiversity: is habitat heterogeneity the key? Trends Ecol. Evol. 18: 182–188. doi: 10.1016/S0169-5347(03)00011-9
- Bibby, C.J., Burgess, N.D., Hill, D.A. & Mustoe, S. 2000. Bird Census Techniques. Academic Press, London.
- Birdlife International. 2004. Birds in Europe: population estimates, trends and conservation status. Birdlife Conservation Series No. 12. Birdlife International, Cambridge.
- Buckland, S.T. 2001. Introduction to Distance Sampling: Estimating Abundance of Biological Populations. Oxford University Press, New York.
- Byrkjedal, I. & Thompson, D.B.A. 1998. Tundra Plovers: The Eurasian, Pacific, and American Golden Plovers and Grey Plover. T & AD Poyser, London.
- Calladine, J., Pakeman, R.J., Humphreys, E., Huband, S. & Fuller, R.J. 2014. Changes in breeding wader assemblages, vegetation and land use within machair environments over three decades. Bird Study 61: 287–300. doi: 10.1080/00063657.2014.917604
- Davíðsdóttir, B. 2010. Þróun aðferða við vöktun algengra mófugla. Bsc, Agricultural University of Iceland.
- EEA. 2010. Corine land cover. Land accounts data viewer 2000–2006 [Online]. European Environment Agency. Available at: http://dataservice.eea.europa.eu/PivotApp/pivot.aspx?pivotid=501 [Accessed 7 October 2013].
- Einarsson, Ó., Kristinsson, H., Skarphéðinsson, K.H. & Ottósson, J.G. 2002. Verndun tegunda og svæða: tillögur Náttúrufræðistofnunar Íslands vegna Náttúruverndaráætlunar. The Icelandic Institute of Natural History, Reykjavík.
- Eken, G., Bennun, L., Brooks, T.M., Darwall, W., Fishpool, L.D., Foster, M., Knox, D., Langhammer, P., Matiku, P. & Radford, E. 2004. Key biodiversity areas as site conservation targets. BioScience 54: 1110–1118. doi: 10.1641/0006-3568(2004)054[1110:KBAASC]2.0.CO;2
- FAI. 2010. Hagtölur landbúnaðarins. In Bjarnadóttir, E. (ed.) The Farmers Association of Iceland, Reykjav´k.
- Fuller, R.M., Devereux, B.J., Gillings, S., Amable, G.S. & Hill, R.A. 2005. Indices of bird-habitat preference from field surveys of birds and remote sensing of land cover: a study of south-eastern England with wider implications for conservation and biodiversity assessment. Global Ecol. Biogeogr. 14: 223–239. doi: 10.1111/j.1466-822X.2005.00145.x
- Gill, J.A., Norris, K., Potts, P.M., Gunnarsson, T.G., Atkinson, P.W. & Sutherland, W.J. 2001. The buffer effect and large-scale population regulation in migratory birds. Nature 412: 436–438. doi: 10.1038/35086568
- Grant, M.C. & Pearce-Higgins, J.W. 2012. Spatial variation and habitat relationships in moorland bird assemblages: a British perspective. In Fuller, R.J. (ed.) Birds and Habitat, 1st edn: 207–236. Cambridge University Press, Cambridge.
- Guðmundsson, G.A. & Skarphéðinsson, K.H. 2012. Vöktun íslenskra fuglastofna – forgangsröðun tegunda og tillögur að vöktun. The Icelandic Institute of Natural History, Garðabær.
- Gunnarsson, T.G. 2010. Votlendi og vaðfuglar í ljósi landnotkunar. Náttúrufræðingurinn 79: 75–86.
- Gunnarsson, T.G., Gill, J.A., Newton, J., Potts, P.M. & Sutherland, W.J. 2005. Seasonal matching of habitat quality and fitness in a migratory bird. Proc. Roy. Soc. B – Biol. Sci. 272: 2319–2323. doi: 10.1098/rspb.2005.3214
- Gunnarsson, T.G., Gill, J.A., Appleton, G.F., Gíslason, H., Gardarsson, A., Watkinson, A.R. & Sutherland, W.J. 2006. Large-scale habitat associations of birds in lowland Iceland: implications for conservation. Biol. Conserv. 128: 265–275. doi: 10.1016/j.biocon.2005.09.034
- Gunnarsson, T.G., Appleton, G.F., Garðarsson, A.Ó., Atkinsson, P.W. & Gill, J.A. 2007. Búsvæðaval og stofnstærð þúfutittlings á láglendi. Bliki 28: 51–55.
- Gunnarsson, T.G., Arnalds, O., Appleton, G. & Gill, J.A. Submitted. Ecosystem recharge by volcanic dust drives large-scale variation in bird abundance. Submitted manuscript.
- IBM Corp. 2012. IBM SPSS Statistics for Windows. Version 21.0 ed. IBM Corp, Armonk, NY.
- International Wader Study Group. 2003. Waders are declining worldwide. Conclusions from the 2003 International Wader Study Group Conference. Wader Study Group Bulletin, Cádiz.
- Ministry for the Environment. 1992. Iceland: national report to UNCED. Ministry for the Environment, Reykjavík.
- Myers, N., Mittermeier, R.A., Mittermeier, C.G., Da Fonseca, G.A. & Kent, J. 2000. Biodiversity hotspots for conservation priorities. Nature 403: 853–858. doi: 10.1038/35002501
- National Land Survey of Iceland. 2013. Icelandic statistics [Online]. National Land Survey of Iceland. Available at: http://www.lmi.is/wp-content/uploads/2014/07/island_i_tolum.pdf [Accessed 13 October 2013].
- Newton, I. 2004. Population limitation in migrants. Ibis 146: 197–226. doi: 10.1111/j.1474-919X.2004.00293.x
- Noss, R.F. 1990. Indicators for monitoring biodiversity – a hierarchical approach. Conserv. Biol. 4: 355–364. doi: 10.1111/j.1523-1739.1990.tb00309.x
- OECD & IUCN. 1996. Guidelines for Aid Agencies for Improved Conservation and Sustainable Use of Tropical and Sub-tropical Wetlands. OECD, Paris.
- Óskarsson, H. 1998. Framræsla votlendis á Vesturlandi. In Ólafsson, J. S. (ed.) Íslensk votlendi – verndun og nýting: 121–129. University of Iceland Press, Reykjavík.
- R Development Core Team. 2008. R: A Language and Environment for Statistical Computing. R Foundation for Statistical Computing, Vienna.
- Sala, O.E., Chapin, F.S., Armesto, J.J., Berlow, E., Bloomfield, J., Dirzo, R., Huber-Sanwald, E., Huenneke, L.F., Jackson, R.B., Kinzig, A., Leemans, R., Lodge, D.M., Mooney, H.A., Oesterheld, M., Poff, N.L., Sykes, M.T., Walker, B.H., Walker, M. & Wall, D.H. 2000. Biodiversity – global biodiversity scenarios for the year 2100. Science 287: 1770–1774. doi: 10.1126/science.287.5459.1770
- Shannon, C.E. 1948. A mathematical theory of communication. Bell Syst. Tech. J. 27: 379–423. doi: 10.1002/j.1538-7305.1948.tb01338.x
- Smart, J., Gill, J.A., Sutherland, W.J. & Watkinson, A.R. 2006. Grassland breeding waders: identifying key habitat requirements for management. J. Appl. Ecol. 43: 454–463. doi: 10.1111/j.1365-2664.2006.01166.x
- Teunissen, W. & Van Paassen, A. 2013. Weidevogelbalans 2013. Sovon, Dutch Centre for Field Ornithology. Landscape Management Netherlands, Nijmegen.
- The Farmland Database. 2013. The farmland database [Online].The Agricultural University of Iceland, Reykjavík. Available at: www.nytjaland.is [Accessed 10 February 2013].
- Thorhallsdottir, T.E., Thorsson, J., Sigurdardottir, S., Svavarsdottir, K. & Johannsson, M.H. 1998. Röskun votlendis á Suðurlandi. In Ólafsson, J.S. (ed.) Íslensk votlendi – verndun og nýting: 131–142. University of Iceland Press, Reykjavík.
- Thorup, O. 2004. Breeding Waders in Europe 2000. International Wader Studies 14, International Wader Study Group, Thetford.
- Vitousek, P.M., Mooney, H.A., Lubchenco, J. & Melillo, J.M. 1997. Human domination of Earth's ecosystems. Science 277: 494–499. doi: 10.1126/science.277.5325.494
- Wald, E.C. 2012. Land-use development in South Iceland 1900–2010. Msc, The University of Iceland.
- Wetlands International. 2006. Waterbird Population Estimates, 4th edn. Wetlands International, Wageningen.
- Zuur, A.F. 2009. Mixed Effects Models and Extensions in Ecology with R. Springer-Verlag, New York.