
ABSTRACT
Capsule: Lower intensity mark-recapture studies, such as those undertaken by citizen scientists, provide an opportunity to improve the spatial representation of survival estimates for birds. Colonial nesting birds are particularly suited to this because, for many species, large numbers of breeding birds and chicks can be located relatively easily. The minimum level of recapture effort required to accurately estimate true survival rates and detect temporal variation largely depended on the respective ringing effort. Therefore, mark-recapture studies should consider both aspects of the field study when setting or adjusting minimum effort guidelines. Furthermore, achieving reliable estimation with short time-series required more intensive survey designs, highlighting the importance of longevity when planning these studies.
Aims: To provide minimum guidelines of field effort that can be used to manage smaller projects that monitor survival rates, such as those reliant on citizen scientists.
Methods: We conducted a sensitivity analysis that evaluated the statistical power associated with using different mark-recapture survey designs to estimate a fixed ‘true’ survival rate and detect sources of temporal variation and individual heterogeneity within the population.
Results: Isolating temporal variation with a good degree (90%) of certainty required the highest levels of survey effort. Based on the assessed survey designs, we recommend studies that have a ten-year trajectory and a recapture rate of 0.6, aim to mark at least 200 new adults per year. The recommended number of marked individuals will decrease if it is possible to achieve higher rates of recapture. Lower rates of juvenile survival and delayed reproduction mean that seabird mark-recapture survey designs that target both chicks and adults offer only marginal improvements in resolving the survival rates of adults, when compared to designs targeting adults only. However, collecting juvenile mark-recapture data provide access to age-specific vital rates that are also valuable for assessing the population dynamics of seabirds.
Conclusion: The addition of chicks is unlikely to improve the resolution of adult survival rates markedly, although for species with low natal dispersal and earlier ages of maturity, these data may allow the estimation of other vital rates, such as juvenile survival rates and age of maturity. Implementing minimum effort guidelines potentially enables the effective management of smaller mark-recapture studies, thus minimising the risk that studies fail to achieve the data conditions necessary for robust estimation of survival rates.
Intra-specific variation in population trends is widespread, however, few species have been studied in sufficient detail to robustly examine how geographic differences relate to individual demographic processes, such as survival and fecundity (but see Dhondt Citation2001, Frederiksen et al. Citation2005, Saracco et al. Citation2012, Robinson et al. Citation2014). Relying on abundance (count) data to understand the complex and dynamic processes that generate population dynamics may obscure key processes (Weegman et al. Citation2016). Furthermore, populations and species not included in long-term monitoring programmes are likely to lack the scientific evidence of decline required to support evidence-based policy actions. Consequently, there is a requirement to explore methodologies that expand spatial and taxonomic representation through statistical imputation (Kindsvater et al. Citation2018) and data collection.
Mark-recapture surveys apply unique marks or tags to individuals in order to gather longitudinal data that can be used to estimate survival probabilities (Lebreton et al. Citation1992), and identify drivers of change, such as climate, anthropogenic pressures and conservation measures (Grosbois et al. Citation2008, Frederiksen et al. Citation2014, Chevallier et al. Citation2015). Implementation of these surveys typically requires large logistic and financial commitments that limit application to a small number of sites where professional researchers conduct intensive fieldwork (Clutton-Brock & Sheldon Citation2010). Consequently, the spatial representation of this vital rate is often limited, for example, the four UK ‘key sites’ monitored as part of the Seabird Monitoring Program (Harris Citation1989; ). In contrast, estimates of abundance and fecundity are more readily available because these metrics require less skilled effort to collect (Mavor et al. Citation2006).
Figure 1. Map of seabird mark-recapture studies conducted annually in the UK as part of the Seabird Monitoring Program Key Sites (triangles), and as part of a national citizen-science program implemented by the British Trust for Ornithology (cross-hairs) (Projection: British National Grid).
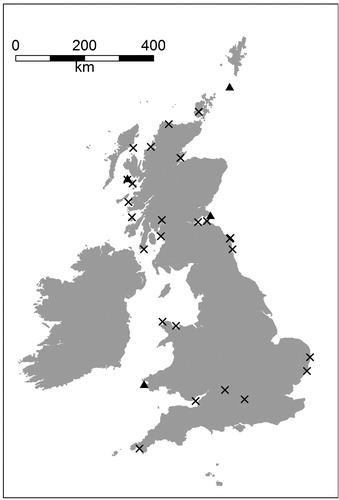
Lower intensity mark-recapture studies, such as those undertaken by citizen scientists, provide an opportunity to improve the spatial representation of survival estimates for birds (Horswill et al. Citation2016; ). Seabirds are particularly suited to this technique because, as colonial species, large numbers of breeding birds and chicks can potentially be located relatively easily. As long-lived and late-maturing species, the population growth rate of seabirds is particularly sensitive to variation in adult survival rates (Croxall and Rothery Citation1991). Furthermore, inter-population differences in demographic parameters and population growth rates are reported (Frederiksen et al. Citation2005). Having population-specific demographic information provides a solid base for conducting scientifically robust and defensible population assessments. Thus, improved spatial representation of survival estimation has the potential to facilitate empirical demographic-based assessments in regions that are currently data limited. This is particularly pertinent for the large and expanding offshore renewables industry that is required to fully assess any negative effects to local seabird populations, but is limited to spatially restricted datasets and simplistic modelling approaches (Green et al. Citation2016, Horswill et al. Citation2017).
Mark-recapture surveys have three key components that can be varied in order to set the level of resources required. These include: (1) the size of the sample population, (2) the recapture (or resighting) rate, and (3) the survey duration (Yoccoz et al. Citation2001). It is critical that low-intensity mark-recapture surveys are carefully designed and achieve effort levels that support robust inference of survival and sources of variation (Yoccoz et al. Citation2001, Reynolds et al. Citation2011). For example, mark-recapture models make specific assumptions about intra-specific variation, or heterogeneity, in survival and recapture rates (Lebreton et al. Citation1992). Survey designs that do not allow these sources of variation to be identified risk goodness-of-fit problems during model development, resulting in biased estimates of survival. Sources of survival heterogeneity include senescence and the presence of transient individuals in the marked population (Pradel et al. Citation1997). Meanwhile, recapture heterogeneity is typically attributed to either trap-shyness, where individuals avoid recapture, or trap-happiness, where individuals are easier to locate after the first capture.
In this study, we conducted a sensitivity analysis to evaluate how different designs of mark-recapture surveys may influence the estimation of a constant rate of survival, as well as the ability to detect temporal variation and individual heterogeneity within the population. The aim is to provide minimum guidelines of field effort that can be used to manage smaller mark-recapture projects that monitor survival rates, such as those reliant on citizen scientists. We examined different field protocols based on three strategies: (1) changing the number of adults and chicks marked at each sampling interval, from hereon we consider a sampling interval to be a year, (2) changing the amount of effort applied to re-encountering (recapture or resighting) marked individuals and (3) changing the survey duration.
Methods
Survey design and simulating time series of demographic rates
Data were simulated in Program Mark (White & Burnham Citation1999). Survey designs followed a three-stage nested design that resulted in 150 different mark-recapture protocols. Levels of field effort were selected from a citizen-science mark-recapture program on seabirds administered through the British Trust for Ornithology (BTO, the Re-trapping Adults for Survival scheme, RAS, Horswill et al. Citation2016). Mark-recapture techniques are widely applicable to species across the nine orders of seabird: Procellariiformes (albatrosses and petrels), Sphenisciformes (penguins), Gaviiformes (loons), Podicipediformes (grebes), Phaethontiformes (tropicbirds), Charadriiformes (gulls, skuas, skimmers, terns, phalaropes and auks), Pelecaniformes (pelicans) and Suliformes (frigatebirds, cormorants, gannets and boobies). However, the RAS scheme is UK focused, and at the time of publication included seabird projects on European Storm Petrel Hydrobates pelagicus, Manx Shearwater Puffinus puffinus, European Shag Phalacrocorax aristotelis, Black-legged Kittiwake Rissa tridactyla, Black-headed Gull Chroicocephalus ridibundus, Lesser Black-backed Gull Larus fuscus, Arctic Tern Sterna paradisaea, Common Guillemot Uria aalge, Razorbill Alca torda and Atlantic Puffin Fratercula arctica (Horswill et al. Citation2016).
The range of ringing efforts achieved by projects operating under the RAS scheme was from 10 to 1061 individuals per year (mean = 176 individuals, sd = 265), with under half (40%) of studies achieving the mean level of ringing effort. Recapture rates achieved under the scheme were between 0.05 and 0.66 (mean = 0.29; sd = 0.17). RAS exclusively targets adult birds, however, in this study we examine survey designs that target both adults and chicks, because chicks are considered easier to catch and mark. We employed identical marking schedules for both age classes. The ten scenarios of marking effort involved five adult-only set-ups: 50, 100, 200, 500 and 1000 adults per year; as well as five adult and chick set-ups: 50 adults plus 50 chicks, 100 adults plus 100 chicks, 200 adults plus 200 chicks, 500 adults plus 500 chicks, and finally 1000 adults plus 1000 chicks per year. The five scenarios of recapture (or resighting) rates were 0.05, 0.1, 0.2, 0.4 and 0.6, and the three project durations were 5, 10 and 20 years (see online Figure S1 for illustration of survey designs). The simulated ‘true’ adult survival rate (φ) was the mean value observed in the UK RAS program on seabirds (φ = 0.83; Horswill et al. Citation2016). The simulated ‘true’ survival rate for fledglings was the mean value reported for 16 species of seabird from northwest Europe with published values (φ = 0.56; Horswill & Robinson Citation2015).
Mark-recapture modelling to assess statistical power
All models were constructed in Program Mark using a logit link function. Models were run for 100 iterations. The statistical power associated with the 150 capture-mark-recapture survey designs was examined based on its ability to resolve the fixed ‘true’ survival rate. Accuracy was assessed using the 95% confidence interval of the estimated ‘apparent’ survival rate, and whether this occurred within 1% or 2% of the true value. Adult-only models were fitted using the ‘live recaptures (Cormack–Jolly–Seber)’ framework, whilst adult and chick models were fitted using ‘multi-state recaptures only’ models in order to account for heterogeneous recapture rates associated with delayed reproduction. In the multi-state model, state 1 included all birds marked as chicks that have not yet returned to the colony (the ‘unobservable state’), and state 2 included birds tagged at age 1 or above, as well as birds tagged as chicks that have since returned to the colony and are assumed to be available for recapture on an annual basis (the ‘observable state’). In the models that included individuals marked as chicks, the maximum age that juveniles return to the colony following delayed reproduction was set to the mean age of maturity across 32 species of seabird from northwest Europe (four years, Horswill & Robinson Citation2015). The annual transition probabilities between the ‘unobservable’ to the ‘observable’ state for individuals aged between one and four years were taken from Horswill et al. (Citation2014). The probability of birds older than four years returning for the first time was fixed to a value of one, and since birds entering the observable state are then assumed to be available for recapture on an annual basis, the reverse transition back into a deferred reproduction state was fixed to a value of zero (Spendelow et al. Citation2002). The recapture probability of birds in the unobservable state was also fixed to zero.
The ability to detect a temporal change in true adult survival was examined using the 75 mark-recapture survey designs that targeted adults only; that is five scenarios of marking, five scenarios of recapture and three survey durations. Although the five-year time series are unlikely to permit reliable detection of temporal variation, we included all 75 survey designs in this analysis in order to facilitate a complete comparison between the different aspects of mark-recapture survey design. Temporal change in true survival was incorporated by simulating a step decrease half way through the time series, that is, survival decreased from 0.83 to 0.78. This change was considered large enough to result in population-level consequences, especially in a long-lived species (such as many seabirds) but small enough to hinder detection under survey designs with low levels of field effort. Detection of individual heterogeneity in ‘true’ survival rates was also examined using the same 75 survey designs. We simulated transience into the data by increasing ‘true’ survival from 0.73 during the year following first release to 0.83 from the second year onwards. This change combines the average rate of adult dispersal for 17 species of seabird in northwest Europe (0.15; Horswill & Robinson Citation2015), with reports that transitory individuals on average make up 7% of the population (Audouin’s Gull Larus audouinii, Tavecchia et al. Citation2007).
We assessed the ability to detect sources of temporal variation and individual heterogeneity by constructing two models under each scenario of field effort. The ‘reference model’ for detecting temporal change included an extra parameter that allowed the estimated ‘apparent’ survival rate to decrease halfway through the time series, thus allowing two rates of ‘apparent’ survival. The ‘reference model’ for detecting individual heterogeneity associated with transients included an extra parameter that allowed the estimated ‘apparent’ survival rate to increase after the first year following release, thus allowing two rates of ‘apparent’ survival: one lower value including transients and one higher value without transients. The ‘constant model’ assumed that survival rates did not change with time or cohort. The estimated values of survival from the reference model and the constant model were compared using a likelihood ratio test (LRT) to assess the difference in model deviances (df = 1; Burnham & Anderson Citation2002). The percentage of model iterations that identified the reference model as being significantly different from the constant model is presented, and we recommend using survey designs that identify differences in ≥90% of simulations. Thresholds of ≥95% will further improve accuracy, such that survey designs meeting this criteria should also be considered for feasibility. For comparative purposes, the supplementary material includes the mean difference in the Akaike Information Criterion (ΔAIC) between the two models, the evidence ratio, and the model likelihood for the reference model relative to the constant model (online Tables S1 and S2).
Results
For a data set of five years, the minimum levels of field effort necessary to estimate ‘apparent’ adult survival within 2% of the ‘true’ value included marking 500 new adults per year with a recapture rate of 0.4 (A). If adults and chicks were marked, this changed to 200 adults and 200 chicks per year with a recapture rate of 0.6 (D). To resolve ‘apparent’ adult survival within 1% of the ‘true’ value with a five-year time series required marking efforts of 1000 adults with recapture rates of 0.6 (A). If 1000 adults and 1000 chicks were marked and released each year, the required recapture rate was 0.4 (D). It was not possible to estimate fledging year survival rates within 1% or 2% of the ‘true’ value with a five-year time series. It was also not possible to identify temporal variation with greater than 90% certainty across the tested scenarios of field effort (A; online Table S1). In contrast, the minimum levels of field effort required to detect individual heterogeneity in survival rates combined a marking effort of 500 new individuals per year and a recapture rate of 0.6 (D; Table S2).
Figure 2. The statistical power of different mark-recapture survey designs to resolve true adult survival rates. (A–C) scenarios with only adults marked and released each year and (D–F) scenarios with both adults and chicks marked and released each year. Light grey polygon represents field conditions that achieved 95% of survival estimates within 2% of the true mean. Dark grey polygon demarked by black points represents field conditions that resulted in 95% of survival estimates within 1% of the true mean.
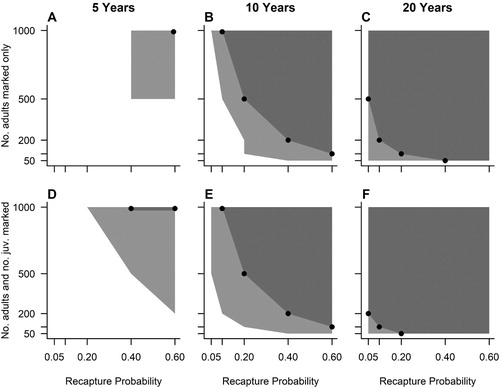
For a ten-year data set, the minimum levels of marking effort required to estimate ‘apparent’ adult survival rates within 2% of the ‘true’ value involved marking 50 new adults per year with a recapture rate of 0.4, or alternatively, 100 adults per year with a recapture rate of 0.2 (B). If adults and chicks were marked, this changed to 50 adults and 50 chicks per year with a recapture rate of 0.4; 100 adults and 100 chicks per year with a recapture rate of 0.2; or 200 adults and 200 chicks per year with a recapture rate of 0.1 (E). To increase the accuracy to within 1% of the ‘true’ value, marking efforts needed to be at least 100 new adults per year with recapture rates of 0.6 (B), or 100 new adults and 100 new chicks per year with recapture rates of 0.6 (D). Estimating a constant fledging year survival rate within 2% of the ‘true’ mean required survey designs to include marking efforts of 500 adults and 500 chicks per year with a recapture rate of 0.2 (A). It was also possible to resolve ‘apparent’ fledgling survival within 1% of the ‘true’ value by marking 1000 chicks per year with a recapture rate of 0.4 (A). To detect the simulated level of temporal variation with greater than 90% certainty required a marking effort of at least 200 newly marked individuals per year with a recapture rate of 0.6 (B; Table S1). The necessary levels of field effort required to detect individual heterogeneity within the population were 100 new individuals per year with a recapture probability of 0.6 (E; Table S2).
Figure 3. The statistical power of different mark-recapture survey designs to resolve true juvenile survival rates. Light grey polygon represents field conditions that achieved 95% of survival estimates within 2% of the true mean. Dark grey polygon demarked by black points represents field conditions that resulted in 95% of survival estimates within 1% of the true mean.
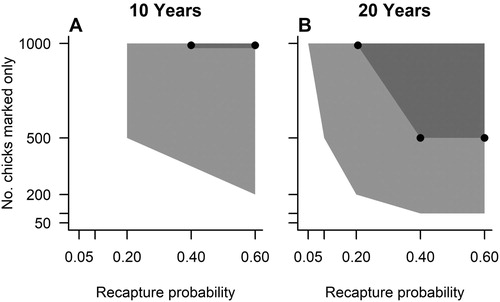
Figure 4. The certainty of detecting temporal (A–C) variation in survival rates and individual heterogeneity associated with transience (D–F) based on different scenarios of field effort: (A and D) 5-year time series; (B and E) 10-year time series; and (C and F) 20-year time series. Recapture scenarios as follows: black solid line = 0.05, grey solid line = 0.1, black dashed line = 0.2, grey dashed line = 0.4, black dot-dash line = 0.6. Figure shows results from the likelihood ratio test and the horizontal dotted line indicates the 90% threshold for certainty.
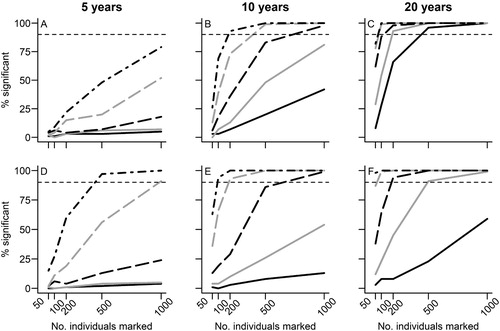
For a 20-year data set, the minimum levels of field effort required to estimate ‘apparent’ adult survival rates within 2% of the ‘true’ value were 50 new adults per year with a recapture rate of 0.05 (C). For designs targeting adults and chicks, a marking effort of 50 new adults plus 50 new chicks per year with a recapture rate of 0.05 was required. To increase this accuracy to within 1% of the true mean, survey designs based on adults needed to mark either 50 adults with a recapture rate of 0.4; 100 adults with a recapture rate of 0.2; or 200 adults with a recapture rate of 0.1 (C). For survey designs that involved marking both adults and chicks, this decreased to 50 adults plus 50 chicks with a recapture rate of 0.2; 100 adults plus 100 chicks with a recapture rate of 0.1; or 200 adults plus 200 chicks with a recapture rate of 0.05 (F). Estimating a constant fledging year survival rate within 2% of the ‘true’ mean required minimum levels of field effort to include marking 100 chicks with a recapture rate of 0.4; or 200 chicks with a recapture rate of 0.2 (B). It was also possible to resolve ‘apparent’ fledgling survival within 1% of the ‘true’ value by marking 500 chicks with a recapture rate of 0.4 (B). To detect the simulated temporal variation with greater than 90% certainty involved marking 200 individuals per year with a recapture rate of 0.1 (C; Table S1). Successful detection of heterogeneity was also possible by marking 50 new individuals per year with a recapture rate of 0.6 (F; Table S2).
Discussion
A key challenge with studying the survival rates of natural populations is detectability (Boulinier et al. Citation1998, Kéry & Schmid Citation2004). Few studies achieve complete detection and therefore multiple sampling occasions are required in order to minimise any associated biases (Lebreton et al. Citation1992). In agreement, our analyses demonstrated that the accuracy of survival estimation and the ability to detect sources of variation were improved greatly when time series were extended (also see Lieury et al. Citation2017). Our study also demonstrated that in longer survey designs, the estimation of adult survival rates was only marginally improved by conducting mark-recapture field studies that target both adults and chicks, as opposed to adults only. Therefore, we conclude that substituting adults for chicks within a fixed marking quota of birds will decrease the ability to resolve adult survival rates. However, marking juveniles provides access to other demographic metrics that are also valuable for examining population dynamics, including age-specific survival rates and age of recruitment to the breeding population.
Age of maturity and rates of natal dispersal can differ substantially between species of seabird (Horswill & Robinson Citation2015). Therefore, the efficacy of marking chicks to resolve age-specific survival rates will vary accordingly. Sample sizes of marked chicks will need to be larger for species that mature later in order to mitigate the influence of increased mortality before individuals recruit into the breeding population, for example in Northern fulmar Fulmarus glacialis (age of maturity = 9 years; Dunnet & Ollason Citation1978). Likewise, species that have low levels of natal dispersal, and are more likely to breed at their natal colony, are much more suited to survival studies that incorporate the marking of chicks, for example Great Skuas Stercorarius skua (Klomp & Furness Citation1992) and European Shags P. aristotelis (Aebischer Citation1995). In contrast, species with higher levels of natal dispersal may need larger sample sizes of marked chicks in order to resolve juvenile vital rates, for example Northern Fulmar (Dunnet et al. Citation1979) and Common Gull Larus canus (Rattiste Citation2004).
Detecting sources of variation in ‘true’ adult survival rates required higher levels of marking and recapture effort than the estimation of a constant survival rate, especially when time series were shorter, such as five or ten years. In addition, survey designs that successfully identified temporal variation were slightly more intensive than those required to detect individual heterogeneity. Consequently, we base our recommended minimum effort guidelines on designs that can detect temporal variation. Mark-recapture projects on species that capture adults using mist nets away from a breeding colony, as opposed to knowingly targeting breeding adults, may require higher levels of field effort because it is not possible to discern breeding individuals from those that are transient or migratory. This is also likely to be the case for species that exhibit higher levels of adult dispersal, such as Common Tern Sterna hirundo (Braasch et al. Citation2008, Breton et al. Citation2014).
Delayed maturity in seabirds means that the ability to resolve ‘true’ survival rates during the fledgling year will be limited in shorter time series, particularly for species with long maturation times. Furthermore, the survival rate of seabirds during the fledgling year is typically more variable than that of adults (Horswill & Robinson Citation2015). In this simulation, we set juvenile survival rates to be constant. Levels of field effort required to identify temporal variation in adult survival rates increased relative to those needed to resolve a constant rate robustly. Consequently, the minimum levels of field effort necessary to reliably estimate juvenile survival rates will almost certainly be higher than those reported in this study.
Conclusion
The minimum level of recapture effort required to accurately estimate ‘true’ survival rates and detect temporal variation largely depended on the respective ringing effort. Therefore, mark-recapture studies should consider both aspects of the field study when setting or adjusting minimum effort guidelines. Furthermore, achieving reliable estimation with short time series required more intensive survey designs, highlighting the importance of longevity when planning these studies. The addition of chicks is unlikely to improve the resolution of adult survival rates markedly, although for species with low natal dispersal and earlier ages of maturity, these data may allow the estimation of other vital rates, such as juvenile survival rates and age of maturity. We use the levels of field effort that allow the detection of temporal variation to set the minimum effort guidelines for resolving true rates of adult survival. Based on a ten-year dataset, these are 200 new individuals marked per year with a recapture rate of 0.6; 500 individuals marked per year with a recapture rate of 0.4; or 1000 individuals marked per year with a recapture rate of 0.2 (B). Converting recapture probabilities into fieldwork hours will largely depend on the accessibility of the study species, the local environmental conditions, such as visibility, and the level of logistical and financial support available.
Acknowledgements
Thanks are extended to Ilka Win (JNCC), Francis Daunt (Centre for Ecology and Hydrology), Mark Bolton (Royal Society for Protection of Birds) and two anonymous reviewers for providing useful comments on an earlier version of this work.
ORCID
C. Horswill http://orcid.org/0000-0002-1795-0753
R. A. Robinson http://orcid.org/0000-0003-0504-9906
Additional information
Funding
References
- Aebischer, N.J. 1995. Philopatry and colony fidelity of shags Phalacrocorax aristotelis on the east coast of Britain. Ibis 137: 11–18. doi: 10.1111/j.1474-919X.1995.tb03214.x
- Boulinier, T., Nichols, J.D., Sauer, J.R., Hines, J.E. & Pollock, K.H. 1998. Estimating species richness: the importance of heterogeneity in species detectability. Ecology 79: 1018–1028. doi: 10.1890/0012-9658(1998)079[1018:ESRTIO]2.0.CO;2
- Braasch, A., Schauroth, C. & Becker, P.H. 2008. Post-fledging body mass as a determinant of subadult survival in common terns Sterna hirundo. Journal of Ornithology 150: 401–407. doi: 10.1007/s10336-008-0362-2
- Breton, A.R., Nisbet, I.C.T., Mostello, C.S. & Hatch, J.J. 2014. Age-dependent breeding dispersal and adult survival within a metapopulation of common terns Sterna hirundo. Ibis 156: 534–547. doi: 10.1111/ibi.12161
- Burnham, K.P. & Anderson, D.R. 2002. Model selection and multi-model inference: A practical information-theoretic approach. Springer, New York.
- Chevallier, C., Hernández-Matías, A., Real, J., Vincent-Martin, N., Ravayrol, A. & Besnard, A. 2015. Retrofitting of power lines effectively reduces mortality by electrocution in large birds: an example with the endangered Bonelli’s eagle. J. Appl. Ecol. 52: 1465–1473. doi: 10.1111/1365-2664.12476
- Clutton-Brock, T. & Sheldon, B.C. 2010. Individuals and populations: the role of long-term, individual-based studies of animals in ecology and evolutionary biology. Trends Ecol Evol 25: 562–573. doi: 10.1016/j.tree.2010.08.002
- Croxall, J.P. & Rothery, P. 1991. Population regulation of seabirds: implications of their demography for conservation. In Perrins, C.M., Lebreton, J.-D. & Hirons, G.J.M. (eds) Bird Population Studies: their relevance to conservation and management, 272–296. Oxford University Press, Oxford.
- Dhondt, A.A. 2001. Trade-offs between reproduction and survival in tits. Ardea 89: 155–166.
- Dunnet, G.M. & Ollason, J.C. 1978. Survival and longevity in the fulmar Fulmarus glacialis. Ibis 120: 124–125.
- Dunnet, G.M., Ollason, J.C. & Anderson, A. 1979. A 28-year study of breeding fulmars Fulmarus glacialis in Orkney. Ibis, 121: 293–300. doi: 10.1111/j.1474-919X.1979.tb06846.x
- Frederiksen, M., Harris, M.P. & Wanless, S. 2005. Inter-population variation in demographic parameters: a neglected subject? Oikos 111: 209–214. doi: 10.1111/j.0030-1299.2005.13746.x
- Frederiksen, M., Lebreton, J.-D., Pradel, R., Choquet, R. & Gimenez, O. 2014. Identifying links between vital rates and environment: a toolbox for the applied ecologist. J. Appl. Ecol. 51: 71–81. doi: 10.1111/1365-2664.12172
- Green, R.E., Langston, R.H.W., McCluskie, A., Sutherland, R. & Wilson, J.D. 2016. Lack of sound science in assessing wind-farm impacts on seabirds. J. Appl. Ecol. 53: 1635–1641. doi: 10.1111/1365-2664.12731
- Grosbois, V., Gimenez, O., Gaillard, J.-M., Pradel, R., Barbraud, C., Clobert, J., Møller, A.P. & Weimerskirch, H. 2008. Assessing the impact of climate variation on survival in vertebrate populations. Biological Reviews 83: 357–399. doi: 10.1111/j.1469-185X.2008.00047.x
- Harris, M.P. 1989. Development of Monitoring of Seabird Populations and Performance: final report to NCC. CSD report 941. Nature Conservancy Council.
- Horswill, C., Matthiopoulos, J., Green, J.A., Meredith, M.P., Forcada, J., Peat, H.J., Preston, M., Trathan, P.N. & Ratcliffe, N. 2014. Survival in macaroni penguins and the relative importance of different drivers: individual traits, predation pressure and environmental variability. J. Anim. Ecol. 83: 1057–1067. doi: 10.1111/1365-2656.12229
- Horswill, C., O’Brien, S.H. & Robinson, R.A. 2017. Density dependence and marine bird populations: are wind farm assessments precautionary? J. Appl. Ecol. 54: 1406–1414. doi: 10.1111/1365-2664.12841
- Horswill, C. & Robinson, R.A. 2015. Review of seabird demographic rates and density dependence. JNCC Report No. 552. Peterborough.
- Horswill, C., Walker, R.H., Humphreys, E.M. & Robinson, R.A. 2016. Review of Mark-Recapture Studies on UK Seabirds that Are Run Through the BTO’s Retrapping Adults for Survival (RAS) Network. JNCC Report 600. Joint Nature Conservation Committee, Peterborough.
- Kéry, M. & Schmid, H. 2004. Monitoring programs need to take into account imperfect species detectability. Basic Appl. Ecol. 5: 65–73. doi: 10.1078/1439-1791-00194
- Kindsvater, H.K., Dulvy, N.K., Horswill, C., Juan-Jordá, M.-J. Mangel, M., & Matthiopoulos, J. 2018. Overcoming the data crisis in biodiversity conservation. Trends Ecol. Evol. doi: 10.1016/j.tree.2018.06.004
- Klomp, N.I. & Furness, R.W. 1992. The dispersal and philopatry of great skuas from Foula, Shetland. Ringing Migr. 13: 73–82. doi: 10.1080/03078698.1992.9674022
- Lebreton, J., Burnham, K.P., Clobert, J. & Anderson, D.R. 1992. Modeling survival and testing biological hypotheses using marked animals: a unified approach with case studies. Ecol. Monogr. 62: 67–118. doi: 10.2307/2937171
- Lieury, N., Devillard, S., Besnard, A., Gimenez, O., Hameau, O., Ponchon, C. & Millon, A. 2017. Designing cost-e ff ective capture-recapture surveys for improving the monitoring of survival in bird populations. Biol. Conserv. 214: 233–241. doi: 10.1016/j.biocon.2017.08.011
- Mavor, R.A., Heubeck, M., Schmitt, S. & Parsons, M. 2006. Seabird Numbers and Breeding Success in Britain and Ireland, 2005. Joint Nature Conservation Committee, Peterborough.
- Pradel, R., Hines, J.E., Lebreton, J.-D. & Nichols, J.D. 1997. Capture-recapture survival models taking account of transients. Biometrics 53: 60–72. doi: 10.2307/2533097
- Rattiste, K. 2004. Reproductive success in presenescent common gulls (Larus canus): the importance of the last year of life. Proc. Royal Soc. London B: Biol. Sci. 271: 2059–2064. doi: 10.1098/rspb.2004.2832
- Reynolds, J.H., Thompson, W.L. & Russell, B. 2011. Planning for success: identifying effective and efficient survey designs for monitoring. Biol. Conserv. 144: 1278–1284. doi: 10.1016/j.biocon.2010.12.002
- Robinson, R.A., Morrison, C.A. & Baillie, S.R. 2014. Integrating demographic data: towards a framework for monitoring wildlife populations at large spatial scales. Methods Ecol. Evol. 5: 1361–1372. doi: 10.1111/2041-210X.12204
- Saracco, J.F., Royle, J.A., Desante, D.F. & Gardner, B. 2012. Modeling spatial variation in avian survival and residency probabilities. Ecology 91: 1885–1891. doi: 10.1890/09-0705.1
- Spendelow, J.A., Nichols, J.D., Hines, J.E., Lebreton, J.-D. & Pradel, R. 2002. Modelling postfledging survival and age-specific breeding probabilities in species with delayed maturity: a case study of Roseate Terns at Falkner Island, Connecticut. J. Appl. Stat. 29: 385–402. doi: 10.1080/02664760120108764
- Tavecchia, G., Pradel, R., Genovart, M. & Oro, D. 2007. Density-dependent parameters and demographic equilibrium in open populations. Oikos 116: 1481–1492. doi: 10.1111/j.0030-1299.2007.15791.x
- Weegman, M.D., Bearhop, S., Fox, A.D., Hilton, G.M., Walsh, A.J., Mcdonald, J.L. & Hodgson, D.J. 2016. Integrated population modelling reveals a perceived source to be a cryptic sink. J. Anim. Ecol. 85: 467–475. doi: 10.1111/1365-2656.12481
- White, G.C. & Burnham, K.P. 1999. Program MARK: survival estimation from populations of marked animals. Bird Study 46: S120–S138. doi: 10.1080/00063659909477239
- Yoccoz, N.G., Nichols, J.D. & Boulinier, T. 2001. Monitoring of biological diversity in space and time. Trends Ecol. Evol. 16: 446–453. doi: 10.1016/S0169-5347(01)02205-4