
ABSTRACT
Capsule: A playback survey comprising two visits to woodland in early spring can reliably detect Marsh Tits Poecile palustris and permit reasonable estimation of the number of territories.
Aims: To assess the efficacy of an efficient survey method for detecting and estimating populations of Marsh Tits.
Methods: Detection probability of colour-marked Marsh Tits, surveyed using playback, was assessed with Cormack–Jolly–Seber models. Reliability of territory estimates was compared between colour-marked and largely or wholly unmarked populations.
Results: Playback surveys over two visits in early spring were highly effective in detecting individual Marsh Tits. Territory estimates were similar for woods in years where less than 20% of the population was marked compared to years when a higher proportion of birds were colour-marked, although territories may be underestimated in larger woods with unmarked populations.
Conclusion: A playback survey comprising two visits in early spring is recommended as an efficient method of surveying Marsh Tit populations and locating individuals. A survey protocol is suggested.
Field surveys that reliably quantify the number of birds inhabiting a given area are fundamental to most population studies and species conservation initiatives (Thompson Citation2002, Gregory et al. Citation2004). In forested habitats, where visibility is generally restricted, several well-established sampling methodologies can generate an index of bird abundance, including point counts, line transects and mist-netting (Gilbert et al. Citation1998, Bibby et al. Citation2000). However, these sampling methods can be poorly suited to woodland species that occur at low density, have large territories, and forage among dense vegetation or in tall treetops, such as some woodpeckers (Picidae), orioles (Oriolidae) and tits (Paridae) (Gilbert et al. Citation1998, Bibby et al. Citation2000, Charman et al. Citation2010).
A common strategy for overcoming such limitations is to estimate the absolute population by undertaking intensive repeated surveys of all wooded habitat in the study area using a mapping methodology (e.g. Dagley Citation1994, Witkander et al. Citation1994, Wesołowski Citation2015). Such an approach ensures that individuals are more likely to be encountered, but is generally labour-intensive. Surveys requiring only confirmation of presence or absence can be achieved with fewer visits than territory mapping, but passive surveys may still require many hours of effort to detect the target species (Charman et al. Citation2010)
For some species, the additional use of playback of recorded song or calls during surveys can increase efficiency and detection probability by eliciting counter-singing from territorial birds (Bibby et al. Citation2000, Allen et al. Citation2004). Playback mapping surveys have been used to census or detect the presence of Willow Tits Poecile montanus (Orell et al. Citation1994, Lewis et al. Citation2009a) and Marsh Tits Poecile palustris (Broughton et al. Citation2012a), both of which occupy large territories at low density in wooded habitats; this technique has become favoured for surveying these two species in Britain, where their respective abundance has declined substantially (Lewis et al. Citation2009b, Broughton & Hinsley Citation2015).
Despite their widespread use, assessment of the accuracy of survey methods is uncommon in the ornithological literature (Gilbert et al. Citation1998, Bibby et al. Citation2000, Thompson Citation2002). Specifically, there has been no validation of the efficacy of the playback method for detecting or quantifying Marsh Tits, which could support its use for mapping and monitoring of this species. In this paper, we assess the reliability of a standardized playback method for the efficient census of Marsh Tits in woodland patches, using colour-marked (leg rings) birds for validation of detection and population estimates. An accurate and reliable method of surveying this species would be valuable for monitoring and research that supports the species’ conservation, and may have wider applicability to similar low-density species.
Methods
Study species
The Marsh Tit is a small (9–12 g) passerine that is largely restricted to mature broadleaved or mixed woodland habitats in temperate Europe and east Asia (Cramp & Perrins Citation1993). Marsh Tits are non-migratory and highly sedentary, undertaking relatively short post-natal dispersal distances (several km) before permanent settlement in a home-range as socially monogamous pairs (Broughton et al. Citation2010, Wesołowski Citation2015). Winter home-ranges have been estimated at an average 31 ha (Broughton et al. Citation2015), and overlap with those of neighbours, but at the end of winter birds establish extensive (5–6 ha, Broughton et al. Citation2012a), strictly defended spring territories from March to June, in which nesting takes place from mid-April to June (Broughton et al. Citation2011).
Study areas
During 2004–18, as part of a long-running study of Marsh Tit ecology and behaviour (Broughton Citation2012, Broughton & Hinsley Citation2015), surveys were conducted in 16 woods in Cambridgeshire, eastern England. The woods comprised patches of mature trees set in an arable landscape matrix, ranging from 4 to 160 ha in area and located within a 5 km radius centred on Monks Wood (52°24′N 0°14′E). Additional surveying took place at the 70 ha Bradfield Woods in Suffolk (52°11′N 0°50′E) during 2014–18. Most (14) woods, including Monks Wood, comprised native broadleaved trees dominated by Pedunculate Oak Quercus robur and Common Ash Fraxinus excelsior, with the remaining three woods containing substantial areas of non-native conifer (Picea-Pinus) plantation that was admixed with native broadleaves.
Territory mapping benchmark surveys
To create a benchmark of typical densities of Marsh Tit territories, we used data from an intensive colour-ringing and territory mapping study at Monks Wood during 2003–18. This study involved approximately 65 h of systematic annual trapping effort over at least six days each autumn, resulting in 83–100% of individuals detected in subsequent springs bearing unique combinations of colour-rings for field identification. Spring territories were quantified with a further 100 h of annual fieldwork over at least ten days during a time window from the beginning of March to mid-April, after exclusive territory establishment but prior to the beginning of nesting, using the territory mapping method (Bibby et al. Citation2000, Broughton et al. Citation2012b). This corresponded to approximately 1 h of survey effort per 1.6 ha of habitat surveyed, allowing an efficiency comparison with other methods. Results from territory mapping were used to directly compare territory densities from assessments of other woods.
Playback surveys
Due to limited resources, a less intensive method was required to monitor Marsh Tit populations in the 16 woods other than Monks Wood. Intermittent autumn–winter trapping in the Cambridgeshire woods during 2008–18, and annual trapping in Bradfield Woods during 2014–18, resulted in 15–40 (mean 27) colour-marked birds distributed across these woods in subsequent springs. Populations were entirely unmarked in at least four woods per year, and all woods (except Bradfield) experienced at least one year when all birds were unmarked.
To estimate numbers of spring territories without the labour-intensive territory mapping used at Monks Wood, a simplified playback survey was adopted in each wood for 4–10 consecutive years between 2009 and 2018 (). Playback surveys comprised two morning visits (initiated from between 0.5 h after dawn until midday, during which time birds were found to be most active and responsive in the Monks Wood surveys) to each wood in calm weather during March or early April, using the mp3 player on a Nokia C1-01 mobile telephone handset (Nokia Corporation, Espoo, Finland) loaded with mp3 sound files of Marsh Tit songs and calls.
Table 1. Area of woodland patches surveyed for Marsh Tits using playback over the specified number of springs (surveyed years) during 2009–18. Also given are the maximum number of occupied territories estimated from surveys, the number of surveyed years when a percentage of the population was colour-marked, and the mean percentage and minimum–maximum percentage range of the population that was marked in years when such birds were present.
During surveys, the observer walked at a slow pace along a pre-defined route that passed within 100 m of all parts of the wood, as tests in Monks Wood found that playback from the handset was audible to humans over this distance (pers. obs.) and counter-singing between birds had been observed over a distance of approximately 250 m in the study area (visually and audibly confirmed from a location between song-posts, pers. obs.). Playback was broadcast at full volume, with no audible distortion, at stops approximately every 100 m along the survey route for around two minutes, including short (5–10 s) pauses of the recording for the observer to listen for a response of song or calls. Where no birds were detected the observer continued along the route and repeated the playback. Where a response was heard the observer remained stationary if the bird approached and appeared close by, or otherwise left the route to locate it, in both cases checking for the presence of accompanying (paired) birds and any colour-rings.
Responding birds were plotted on site maps, with song considered to indicate a male (song is very rare in female Marsh Tits; Broughton Citation2008) and a female was inferred by accompanying a singing bird and/or responding only with agitated calls but not song. Birds that followed the observer to consecutive locations in response to playback were detected by direct observation and/or colour-rings, and these plotted movements aided territory identification by providing additional mapped registrations. Frequent counter-singing between multiple responding birds also aided the mapping of individual territories.
The mapped observations of presumed (unmarked) or known (colour-marked) unique individuals or pairs were distinguished and grouped in the manner of standard territory mapping (Bibby et al. Citation2000). Previously published metrics of Marsh Tit territories (largely derived from the Monks Wood surveys) guided the groupings, including a minimum territory area of 1.5 ha and expected mean of 5–6 ha (Broughton et al. Citation2012a). Unless observation indicated otherwise, registrations of unmarked birds more than 150 m apart were considered to relate to different individuals, as experience of marked birds in Monks Wood indicated that birds were unlikely to travel such a distance undetected in the short period in which an observer passed during a playback survey (pers. obs.). A distance of 150 m was also slightly greater than the radius of a typical 5–6 ha territory (125–138 m), and so an individual could be detected within the territory core or periphery on either visit, but without the threshold being so large as to encompass more than one typical territory (and different birds).
A territory was inferred from singing or an aggressive response to playback on either survey visit. This single registration threshold was adopted because Marsh Tits are highly sedentary and most individuals have settled in defended territories by March (Broughton et al. Citation2010). Consequently, single records at a given location during this period were considered more likely to be residents detected only once rather than transients that were present only briefly (cf. Bibby et al. Citation2000). Playback surveys lasted approximately 1 h per 30 ha of habitat on each visit, or 1 h per 15 ha for the full survey (two visits), requiring a total of approximately 4.7 h of effort for full surveys of the largest (70 ha) woods.
Statistical analyses
The efficacy of playback surveys in detecting Marsh Tits and accurately estimating territory numbers was tested in two ways. First, the probability of detecting individual birds in the annual two surveys was estimated by fitting a Cormack–Jolly–Seber (CJS) model (with a logit link function) to records of marked birds across all woods (excluding Monks Wood) in Program MARK v.7.1 (Cooch & White Citation2017). The initial model included time-varying (annual) estimates for re-sighting probability and apparent survival, while a second model fixed the re-sighting probability at 0.99 to replicate a near-perfect encounter history for comparison. Highly correlated estimates of apparent survival between both models would indicate that the time-varying model was performing as expected and the resulting re-sighting probabilities were realistic. Both models were compared using differences in the corrected Akaike Information Criterion (AICc).
Surveys could provide greater accuracy where a significant proportion of the population is colour-marked, because of the ability to distinguish between individuals. However, surveys of unmarked populations would be more efficient and widely applicable, by avoiding the need for labour-intensive trapping and marking. As such, a second test assessed whether surveys of woods containing no or few (< 20%) colour-marked birds differed from surveys of the same woods in years where 20% or more of the population was marked. Eight woods were selected where at least two years of territory estimates were available for each marking category (<20% or ≥20% of birds colour-marked) in 2009–18, and the mean territory estimate of each category for each wood were used as paired data and compared in a Wilcoxon signed-rank test. This test assumed no significant changes in population between survey years, although variation would be smoothed by the averaging of values.
Reliability of the territory estimates of unmarked populations was further assessed using a sample from two large woods (70 and 27 ha) in five years (2012, 2014–16, 2018) when at least 50% of detected territories contained a marked bird. This sample was selected due to relatively large populations of Marsh Tits (providing a good test of territory estimation), high proportions of marked individuals (occupying ≥50% of territories, providing reliable territory estimates), and the availability of archived field maps. For each of the annual field maps for these two woods, the assessments of territory numbers were repeated after the colour-mark information was removed, and so the birds were ‘anonymized’ to replicate a survey of unmarked birds. The territory estimates based on data of marked and anonymized birds were generated by different assessors to avoid bias. Sample sizes of five matched pairs (some tied) for each wood were insufficient for a statistical test, such as the Wilcoxon signed rank, so the two sets of five pairs of marked and anonymized territory estimates for each were compared to simply determine the percentage differences.
Results
The annual surveys in Monks Wood identified a mean 19 territories (range: 10–23) in 2004–18, giving an overall mean density of 0.12 (sd = 0.03, range: 0.06–0.15) territories/ha. Playback surveys of the other 16 woods gave an identical overall mean density of 0.12 (sd = 0.05) territories/ha, by averaging the means for each wood over the respective number of years of available data, but with a wider range of 0.05–0.24. There was no significant correlation between woodland area and the maximum territory density (Pearson’s r = −0.31, P = 0.24; ).
Playback surveys detected a total of 130 individual colour-marked Marsh Tits across the woods, excluding Monks Wood, in 2009–18. A mean 48% (range 28–62%) of birds identified in each year were detected during only one of the two surveys visits. The time-varying CJS model estimated the annual probability of re-sighting these individuals at 0.78–1.00 (mean = 0.96, sd = 0.08) over eight annual intervals, excluding the ninth interval as such models are unable to determine a terminal re-sighting rate (Cooch & White Citation2017). The lowest annual estimate (0.78) resulted from the failure to detect two birds that were later known to be alive, and the effect that this had among a relatively small sample of 23 birds.
Survival estimates from the time-varying model were closely correlated with those derived from the model with annual detection probabilities fixed at 0.99 (Spearman’s rs = 0.82, P = 0.01), indicating that the time-varying model output for detection probability was realistically high. However, the AICc value of the fixed probability model () was higher than the time-varying model, suggesting the latter was the best fit to the data.
Table 2. Cormack–Jolly–Seber modelling output for two candidate models estimating annual survival (Φ) and detection probability (p) of Marsh Tits over nine annual intervals, where parameters were time-dependent (t) annually, or fixed at a value of 0.99.
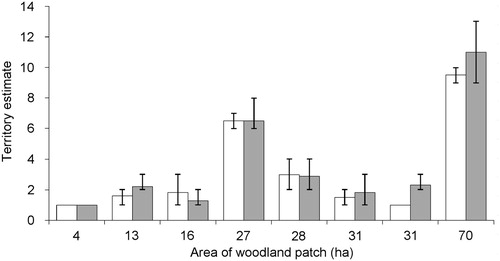
There was no significant difference in the mean territory estimates derived from playback surveys in woods during years when at least 20% of the population was colour-marked compared to years when fewer or no birds were marked (Wilcoxon W = 4.0, P = 0.22, n = 6 excluding two ties; ). However, comparisons of territory estimates based on colour-marked and anonymized data from two of the larger woods found a mean underestimate of 10% for an average 6.6 (range: 6–8) territories present in the 27 ha wood, and 15% for an average 10.8 (range: 9–12) territories in the 70 ha wood for five years of estimates, with an annual maximum of 25% (9 territories estimated out of an actual 12 present). Nevertheless, estimates were the same for 30% of the ten comparisons across both woods.
Figure 1. Mean (columns) and minimum–maximum (errors bars) of the estimated number of Marsh Tit territories derived from playback surveys in woodland patches of a given area. White columns represent years when less than 20% of the population was unmarked and grey columns are years when at least 20% of birds were colour-marked.
Discussion
The probability of re-sighting individual Marsh Tits using the playback survey method was very high, averaging 96%, showing that almost all birds present would be detected in most years. Although intensive colour-marking and standard territory mapping in Monks Wood likely provided highly accurate data describing the number and extent of Marsh Tit territories and their occupants, this required time-consuming fieldwork over at least 16 days. Other studies using field surveys to quantify Marsh Tit territories, without playback, have also required a large number (10–12) of site visits (Siriwardena Citation2006, Wesołowski et al. Citation2015). By contrast, in order to quantify the number of territories and indicate their approximate location, the playback method required only two visits per site and used only 11% of the time required for the intensive territory mapping survey at Monks Wood. However, unlike intensive colour-marking and territory mapping, the playback survey was unable to define territory boundaries or extent.
The overall territory density estimated from playback surveys in all woods (0.12 territories/ha) was similar to that obtained from more intensive fieldwork during territory mapping at Monks Wood, with the greater variation in range from playback surveys likely reflecting population differences between woods of varying size and habitat type. The similarity in territory densities validated the use data from the larger Monks Wood (160 ha) as a basis for parameters of expected territory size in the smaller woods (4–70 ha), and the demonstration that territory density was not related to woodland area further justified this approach.
Mean territory estimates derived from the playback surveys of woods in years when many birds were marked were similar to those from years in which few or no birds were marked, showing that broadly similar results could be obtained without labour-intensive trapping and colour-marking of many birds in a population.
For two larger woods, however, assessment of anonymized data tended to underestimate the number of territories identified using colour-mark information. The underestimations resulted from a conservative grouping of registrations into territories, rather than detection error, and averaged 10–15% overall. Error was lower for territory estimates in the smaller of the two woods, suggesting that the more complex territory configurations of larger populations in more extensive woods could lead to greater difficulty in estimating the number of territories of unmarked birds. However, the discrepancies between estimates derived from colour-marked and anonymized data were generally not substantial (maximum 2–3 territories over a total population of 15–18 territories), and were offset by the gain in efficiency and reduced survey effort.
Overall, the results indicate that territory estimates derived from playback surveys of Marsh Tits were of sufficient reliability for population monitoring, at least for the range of woodland patches (4–70 ha) and populations (1–13 territories/pairs) covered in this study. The accuracy of the territory estimates of unmarked populations was generally comparable to that of marked populations, though with the potential for some underestimation. Colour-marking would increase the reliability of territory estimates in larger woods, though in highly modified landscapes woodland patches tend to be fragmented and relatively small; 74% of woods across the Marsh Tit’s range in England and Wales are less than 10 ha (Forestry Commission Citation2001, Citation2002), and so each is capable of supporting only a few territories. The accuracy of territory estimates in larger woods may also be improved by additional survey visits to increase the number of registrations available during assessment.
A suggested protocol for the efficient surveying of Marsh Tits using the playback method is given in the Appendix, and is recommended for determining presence or absence and deriving territory or population estimates for woods with unmarked populations. For more detailed demographic studies, combining the survey methodology with colour-marking would facilitate systematic analyses of survival and dispersal (e.g. Broughton et al. Citation2010), as the playback methodology is effective in locating individuals with a high degree of probability and efficiency.
In the current assessment, approximately half of the birds known to be present from the full playback surveys were detected on only one of the annual visits, underlining the need for a second visit per year to locate the remainder. However, for small woods (20 ha or less) a single survey visit may be sufficient if this detects that the habitat is saturated with territories (based on the average or minimum territory area, Broughton et al. Citation2012a), or if marked birds that occupied all potential territories in the previous year are confirmed to still be present. In such cases a second survey visit would be superfluous. However, although a single visit can confirm the presence of birds, a second survey would provide a more robust indication of absence (lower likelihood of a false negative) and will be appropriate in most cases, as habitat is unlikely to be saturated with territories, particularly in declining populations such as that in Britain.
The playback survey protocol adopted in this study may also be suitable or modified for the efficient census of other forest birds with similarly large territories or low density, such as the Willow Tit, Crested Tit Lophophanes cristatus and Lesser Spotted Woodpecker Dendrocopos minor. All of these species are scarce and/or declining in several parts of their range, including Britain. Information on the timing of territoriality and spacing of individuals, acquired through marking or tagging, would assist with estimating the number of territories from surveys of these species, as territory parameters are likely to differ from those of Marsh Tits (Orell et al. Citation1994, Witkander et al. Citation1994). Testing and reporting the efficacy of this and other survey methods would be valuable to assess their applicability in the field, and to develop standard protocols that could be used for large-scale monitoring of such species.
Acknowledgements
The authors thank landowners for access to study sites, particularly Natural England (Monks Wood), Suffolk Wildlife Trust (Bradfield Woods) and the Abbots Ripton Estate. Sarah Caesar, Douglas Hall and Geoff Leach provided logistical support.
ORCID
Richard K. Broughton http://orcid.org/0000-0002-6838-9628
Marta Maziarz http://orcid.org/0000-0002-2921-5713
Paul E. Bellamy http://orcid.org/0000-0003-2234-2119
Additional information
Funding
References
- Allen, T., Finkbeiner, S.L. & Johnson, D.H. 2004. Comparison of detection rates of breeding marsh birds in passive and playback surveys at Lacreek National Wildlife Refuge, South Dakota. Waterbirds 27: 277–281. doi: 10.1675/1524-4695(2004)027[0277:CODROB]2.0.CO;2
- Bibby, C.J., Burgess, N.D., Hill, D.A. & Mustoe, S.H. 2000. Bird Census Techniques, 2nd edn. Academic Press, London.
- Broughton, R.K. 2008. Singing by female Marsh Tits: frequency and function. Br. Birds 101: 155–156.
- Broughton, R.K. 2012. Habitat modelling and the ecology of the marsh tit (Poecile palustris). PhD Thesis, Bournemouth University. http://nora.nerc.ac.uk/id/eprint/20719/
- Broughton, R.K., Hill, R.A., Bellamy, P.E. & Hinsley, S.A. 2010. Dispersal, ranging and settling behaviour of Marsh Tits Poecile palustris in a fragmented landscape in lowland England. Bird Study 57: 458–472. doi: 10.1080/00063657.2010.489316
- Broughton, R.K., Hill, R.A., Bellamy, P.E. & Hinsley, S.A. 2011. Nest-sites, breeding failure, and causes of non-breeding in a population of British Marsh Tits Poecile palustris. Bird Study 58: 229–237. doi: 10.1080/00063657.2011.582641
- Broughton, R.K., Hill, R.A., Henderson, L.J., Bellamy, P.E. & Hinsley, S.A. 2012a. Patterns of nest placement in a population of Marsh Tits Poecile palustris. J. Ornithol. 153: 735–746. doi: 10.1007/s10336-011-0790-2
- Broughton, R.K., Hill, R.A., Freeman, S.N., Bellamy, P.E. & Hinsley, S.A. 2012b. Describing habitat occupation by woodland birds with territory mapping and remotely sensed data: an example using the Marsh Tit (Poecile palustris). Condor 114: 812–822. doi: 10.1525/cond.2012.110171
- Broughton, R.K., Bellamy, P.E., Hill, R.A. & Hinsley, S.A. 2015. Winter social organisation of Marsh Tits Poecile palustris in Britain. Acta Ornithol. 50: 11–21. doi: 10.3161/00016454AO2015.50.1.002
- Broughton, R.K. & Hinsley, S.A. 2015. The ecology and conservation of the Marsh Tit in Britain. Br. Birds 108: 12–29.
- Charman, E.C., Smith, K., Gruar, D.J., Dodd, S. & Grice, P. 2010. Factors associated with wood occupancy by Lesser Spotted Woodpeckers Dendrocopos minor in England. Ibis 152: 543–555.
- Cooch, E.G. & White, G.C. 2017. Program MARK: a gentle introduction. http://www.phidot.org/software/mark/docs/book/pdf/mark_book.zip
- Cramp, S. & Perrins, C.M. (eds) 1993. The Birds of the Western Palearctic, Vol. 7. Oxford University Press, Oxford.
- Dagley, J.R. 1994. Golden Orioles in East Anglia and their conservation. Br. Birds 87: 205–219.
- Forestry Commission. 2001. National Inventory of Woodland and Trees: England. Forestry Commission, Edinburgh.
- Forestry Commission. 2002. National Inventory of Woodland and Trees: Wales. Forestry Commission, Edinburgh.
- Gilbert, G., Gibbons, D.W. & Evans, J. 1998. Bird Monitoring Methods: a manual of techniques for key UK species. Pelagic Publishing, Exeter.
- Gregory, R.D., Gibbons, D.W. & Donald, P.F. 2004. Bird census and survey techniques. In Sutherland, W.J., Newton, I. & Green, R.E. (eds) Bird Ecology and Conservation: a handbook of techniques, 17–55. Oxford University Press, Oxford.
- Lewis, A.J.G., Amar, A., Daniells, L., Charman, E.C., Grice, P. & Smith, K. 2009a. Factors influencing patch occupancy and within-patch habitat use in an apparently stable population of Willow Tit Poecile montanus kleinschmidti in Britain. Bird Study 56: 326–337. doi: 10.1080/00063650902795190
- Lewis, A.J.G., Amar, A., Charman, E.C. & Stewart, F.R.P. 2009b. The decline of the Willow Tit in Britain. Br. Birds 102: 386–393.
- Orell, M., Koivula, K., Rytkönen, S. & Lahti, K. 1994. To breed or not to breed: causes and implications of non-breeding habit in the Willow Tit Parus montanus. Oecologia 100: 339–346. doi: 10.1007/BF00316963
- Siriwardena, G.M. 2006. Avian nest predation, competition and the decline of the British Marsh Tit Parus palustris. Ibis 148: 255–265. doi: 10.1111/j.1474-919X.2006.00525.x
- Thompson, W.L. 2002. Towards reliable bird surveys: accounting for individuals present but not detected. Auk 119: 18–25. doi: 10.1642/0004-8038(2002)119[0018:TRBSAF]2.0.CO;2
- Wesołowski, T. 2015. Dispersal in an extensive continuous forest habitat: Marsh Tit Poecile palustris in the Białowieża National Park. J. Ornithol. 156: 349–361. doi: 10.1007/s10336-014-1109-x
- Wesołowski, T., Czeszczewik, D., Hebda, G., Maziarz, M., Mitrus, C. & Rowiński, P. 2015. 40 years of breeding bird community dynamics in a primeval temperate forest (Białowieża National Park, Poland). Acta Ornithol. 50: 95–120. doi: 10.3161/00016454AO2015.50.1.010
- Witkander, U., Nilsson, S.G., Olsson, O. & Stagen, A. 1994. Breeding success of a Lesser Spotted Woodpecker Dendrocopos minor population. Ibis 136: 318–322. doi: 10.1111/j.1474-919X.1994.tb01101.x
Appendix. Playback survey protocol for detecting and quantifying Marsh Tits in spring
Surveys should take place during the pre-nesting period of territory defence by Marsh Tits, which falls between early March and early April in England and Wales, but may vary in other regions and climates.
Two survey visits are required, on different days in fine weather, with no rain or strong wind, and preferably on mild days (no frost). Surveys should begin during the early morning, but can extend into the early afternoon if weather remains favourable.
On a large-scale site map (preferably with a scale reference or 100 × 100 m grid to assist mapping), a route should be planned that takes an observer within 100 m of all wooded habitat in the study area, while minimising overlaps on the route. Surveys visits should last a minimum of 1 hour per 30 ha of habitat.
The observer walks slowly along the route, looking and listening for Marsh Tits. At stops approximately every 100 m on the route, playback of Marsh Tit songs and calls are played for around 2 minutes, including pauses of 5–10 seconds to listen for a response. Playback should be loud enough to be audible to a human observer over 100 m, but without distortion. A mobile phone or mp3 player is suitable.
Responding Marsh Tits may approach the observer on the route and can be checked for colour-rings (if applicable). A bird may respond but not approach, and the observer may leave the route to find it and check for rings, or whether the bird is alone or paired, before returning to the route. Males typically respond more vigorously than females, with song and calls. Females may respond with agitated calls but no song, and both birds in a pair often respond together. Attention should be paid to looking for quieter females accompanying a responding male.
The locations of responding birds are registered on the site map, using standard coding conventions (e.g. http://www.ecn.ac.uk/measurements/terrestrial/b/bi/bto3/at_download/file), and the observer continues with the route. Where responding birds follow the observer in response to the playback, this can be marked on the map – birds may respond until the edge of their territory is reached.
Sighting registrations on survey maps from both visits can be used to estimate the number of territories by grouping or distinguishing between observations. A single registration in either visit is sufficient to indicate a territory. The absolute minimum expected area of a territory is 1.5 ha of wooded habitat, and the typical expected area is 5–6 ha, although territories may exceed 10 ha. Unless observations indicate otherwise, registrations more than 150 m apart are likely to indicate different individuals if habitat availability could accommodate a corresponding number of territories.