
ABSTRACT
Capsule: Herring Gull Larus argentatus colonies located along coastlines that are relatively sheltered from wave impact, associated with high intertidal prey availability, and with extensive farmland habitat in the vicinity, have increased in size over the last three decades.
Aims: To investigate potential habitat drivers, associated with local food availability, of variation in Herring Gull colony sizes.
Methods: Colony sizes were compared for 68 Herring Gull colonies across southwest Scotland and Northern Ireland to relate to the availability of potential foraging habitats surrounding each colony.
Results: Changes in Herring Gull colony sizes were spatially clustered, with between-colony differences in colony size related to coastline exposure and amount of farmland within the foraging range. At the end of the census period, colonies located in areas with the greatest availability of intertidal prey and farmland habitat were larger compared to those that were not.
Conclusion: Spatially clustered variation in changes of the size of Herring Gull colonies indicates that neighbouring colonies experienced similar environmental conditions and highlights the importance of intertidal and farmland habitats in buffering against declines. This result emphasizes the need for area-specific management for this species of conservation concern.
Animal population changes can vary over space, with patterns often fluctuating over different spatial scales (McArdle et al. Citation1990, Sutherland & Baillie Citation1992, Brown et al. Citation1995). Variation in population trends can be driven by differences in the local environment as well as by density-dependent processes, such as competition and predation, which can vary between locations (Furness & Birkhead Citation1984, Brown et al. Citation1995, Sibly & Hone Citation2002, Crespin et al. Citation2006). Drivers of population changes are often identified using long-term data sets, frequently from single populations, which can compromise the generality of the findings. Alternatively, spatial variation in population trends between different populations can provide a ‘pseudo-experimental’ approach that treats spatial contrasts in population trajectories as ‘treatments’ (Baum & Worm Citation2009). This spatial approach can identify factors that correlate with between-population differences (Frederiksen et al. Citation2005, Robinson et al. Citation2013) and help in understanding larger scale changes in a species’ abundance (Liebhold et al. Citation2004).
In recent decades, many ecosystems have been altered by anthropogenic influences, through over-exploitation of resources, introduction of invasive species and habitat destruction/modification, which can influence population sizes (Butchart et al. Citation2010). Such influences are likely to impact populations over different spatial scales, from predation and disturbance acting at a local level to habitat change and severe or unusual weather events that can act over local but also broader spatial scales. When spatially distinct populations show similar trends in abundance this may indicate that similar environmental conditions are occurring over the scale being measured (Moran effect), affecting those multiple populations similarly (Harald et al. Citation2002, Liebhold et al. Citation2004). Conversely, contrasting abundance trajectories may indicate differences in local environmental conditions that drive population changes (Ens et al. Citation2009). Colonially breeding seabirds show spatially distinct populations and their demographic traits vary across different spatial scales, with inter-population differences found in adult survival, productivity and population growth rate (Frederiksen et al. Citation2005, Harris et al. Citation2005, Bertram et al. Citation2015, Cordes et al. Citation2015, Nager & O’Hanlon Citation2016). Seabirds generally use food sources within the vicinity of their colonies, at least during the breeding season (Furness & Birkhead Citation1984, Birt et al. Citation1987, Lewis et al. Citation2001, Wakefield et al. Citation2013), and thus different colonies can be affected by different local environments. Spatial variation in population trends is generally poorly understood, but has important implications in understanding changes in abundance across the distribution of a species and their population management.
Within the environments used by seabirds, coastal habitats are particularly affected by anthropogenic and natural pressures due to their accessibility and location at a boundary between marine and terrestrial ecosystems (Thompson et al. Citation2002, Lopez y Royo et al. Citation2009). Several species utilizing coastal habitats have experienced declines in recent decades (Lotze et al. Citation2006, van Roomen et al. Citation2012). Among seabirds that particularly rely on coastal habitats for foraging, and which have also experienced recent declines, are the large gulls, particularly the Herring Gull Larus argentatus (Eaton et al. Citation2015). The Herring Gull is an opportunistic forager with a generalist diet, exploiting both marine and terrestrial resources (Hunt & Hunt Citation1973, Götmark Citation1984), therefore their populations can be affected by conditions on land and at sea. If food availability is affected by the many pressures on the coastal environment, and is a driver of Herring Gull population growth, then as generalists they may be able to buffer themselves against changes in local food availability by switching to alternative resources (Burger & Piatt Citation1990). The outcome of such diet switches may depend on the relative quality of alternative resources (Österblom et al. Citation2008, White Citation2008). However, the breeding success of Herring Gulls can vary depending on the resources that they consume (Hunt Citation1972, Pierotti & Annett Citation1991, O’Hanlon et al. Citation2017) suggesting that the distribution of resources may still influence population changes in this species.
Here we use a rare opportunity to investigate the spatial pattern of long-term population trends across multiple Herring Gull colonies within a heterogeneous landscape of potential foraging habitats in a region of north-west Europe. If the landscape at a broad scale is an important driver of Herring Gull populations we would expect colonies with similar population trends to be spatially clustered. In addition, as breeding Herring Gulls forage in the vicinity of their colony (Thaxter et al. Citation2012) and colonies in this region that consumed more marine food from well-sheltered intertidal zones bred more successfully (O’Hanlon et al. Citation2017) we predict that between-colony differences in long-term changes of colony size will be influenced by the presence of suitable intertidal habitat in their foraging range. This study, therefore, aims to provide insights into potential drivers of colony size in Herring Gulls that can inform management decisions for this species of current conservation concern (Eaton et al. Citation2015).
Methods
Study region and study species
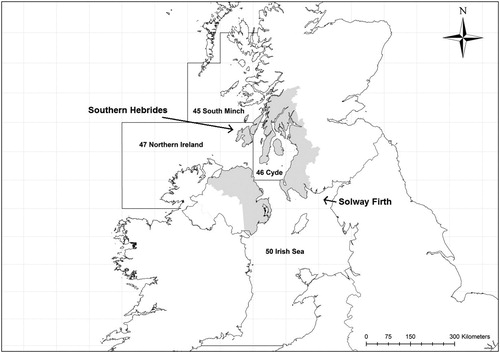
We investigated Herring Gull colonies in an area of southwest Scotland and Northern Ireland covering two biogeographically distinct regional seas (the north Irish Sea and the south Minches and West Scotland Sea; JNCC Citation2014) (). The study region is approximately 200 km by 250 km with large variation in habitat composition within a relatively small geographic area. The Northern Irish coast and eastern shore of the Clyde are the most populated and farmed areas, with the Solway Firth coast also heavily farmed (Fuller et al. Citation2002), whereas Northern Ireland and the Southern Hebrides generally have the most exposed shores and the northern Firth of Clyde the most sheltered coast (Burrows Citation2012). The fish communities of these seas are similar, with stocks of Herring Clupea harengus largely depleted in the 1970s and demersal fisheries (predominantly comprising of Atlantic Cod Gadus morhua, Haddock Melanogrammus aeglefinus, Whiting Merlangius merlangus, Saithe Pollachius virens and Norway Pout Trisopterus esmarkii) ceased in 2000s; the only remaining commercial fisheries are for Norway Lobster Nephrops norvegicus and Great Scallops Pecten maximus (Thurstan & Roberts Citation2010, Heath & Speirs Citation2012). Across the study region breeding Herring Gulls were counted in 1969 (Operation Seafarer, Cramp et al. Citation1974), between 1985 and 1989 (Seabird Colony Register, Lloyd et al. Citation1991), and between 1998 and 2002 (Seabird 2000, Mitchell et al. Citation2004). No additional, regular colony counts were available for colonies within this region. All three censuses followed the same standardized survey methodologies, which involved a mixture of vantage point counts, sample quadrate or transect counts extrapolated to the colony area, flush counts of adults or photography/aerial counts (Walsh et al. Citation1995, Mitchell et al. Citation2004). We extracted adjusted counts of Apparently Occupied Nests (AON) per Herring Gull colony from the Seabird Monitoring Programme (Walsh et al. Citation1995, JNCC Citation2012) and additional data for Operation Seafarer from JNCC (Roddy Mavor, pers. comm.).
Figure 1. Study region (in grey) where spatial variation of changes in Herring Gull colony sizes were assessed between the first survey in 1969 and the most recent survey from 1998 to 2002. The study region spans two regional seas: Minches and West Scotland in the north and Irish Sea in the south (JNCC Citation2014). Also indicated are the four ICES sea areas (45, 46, 47 and 50) used to estimate availability of fishery discards.
Colony growth rates
During the seabird censuses, grid references of all counted colonies were recorded. We matched counts from the same colony in different censuses by importing the grid references into ArcGIS (ArcMap ver.10. ESRI, USA) and extracted the location of all counts. Only where locations between censuses matched, by name or grid reference within 500 m, did we assume successive counts for the same colony. Newly established and extinct colonies were identified when a count of zero was recorded in the previous or following census, respectively. Where no record of a count was made we could not be certain whether that colony was not monitored or had a zero count so these could not be included in the analyses. For small islands and sea-lochs (less than 5 km2 in area), where the number of sub-sites differed between censuses, we totalled all counts into one value so they were comparable between censuses. We identified a total of 68 Herring Gull colony sites that were occupied during the first and/or the last census.
To quantify the changes in colony size over the study period we used a modification of the conventional ratio of Nt−1/Nt. As Nt−1/Nt is not defined for extinct colonies we calculated change in colony size (GR) for individual colonies using a formula based on Guillaumet et al. (Citation2013):
where Nt is the count in the last census (Seabird 2000), Nt–1 the count in the first census (Operation Seafarer), and Maximum [Nt, Nt–1] is the highest count from either census. This calculation of GR avoids the issue of undefined values of GR for extinct colonies and GR = 0 for colonies established since 1969 (Guillaumet et al. Citation2013). GR values were monotonically related to the calculated lambda with rs = 1.0 (N = 64, four colonies were omitted as lambda values could not be calculated for four colonies that had a count of zero in Seabird 2000).
Local habitat availability
Herring Gulls are generalist foragers that traditionally rely on intertidal foraging habitats (marine invertebrates), however they also scavenge on fishery discards (fish, Norway Lobster) and forage frequently inland on farmland, built-up areas and landfill sites (anthropogenic food, grain and terrestrial invertebrates) (Hunt Citation1972, Kubetzki & Garthe Citation2003, McLellan & Shutler Citation2009). To investigate any relationship between Herring Gull population changes and habitat availability, we therefore extracted information on proxies that reflect the availability of these different potential foraging habitats within the foraging range of colonies. Comparable spatially explicit data on proxies for these habitats are available for Northern Ireland and southwest Scotland but only for the end of the census period. We therefore focused on investigating spatial variation in local habitat and colony size at the end of the census period, rather than how conditions may have changed over time.
We extracted static habitat information for the end of the census period (1998–2002) from Landcover 2000 (Fuller et al. Citation2002), which uses computer classification of satellite images to quantify different land uses in the UK. Each habitat variable was extracted from within the Herring Gulls’ potential foraging range around each colony. Breeding Herring Gulls generally forage up to 50 km from their colony (Götmark Citation1984, Camphuysen Citation1995, Thaxter et al. Citation2012). In our study area we observed foraging trips of up to 44 km from the colony for a small sub-sample of GPS-tagged Herring Gulls from four different colonies (NJO’H, unpubl. data). We therefore selected the 50 km circle around colonies in order not to ignore far-away resources that birds potentially could use.
An important foraging habitat for Herring Gulls, especially within the study region of interest, is the intertidal zone where individuals forage on a large diversity of invertebrate prey (O’Hanlon et al. Citation2017). As proxies of food availability in this habitat we extracted the area of intertidal habitat and average wave fetch, to reflect information on the quantity and quality of this habitat, respectively. The area of intertidal habitat was obtained from Landcover 2000 (Fuller et al. Citation2002). Wave fetch is a measure of the exposure of a coastline, which depends on topography and predominant wind direction and was available for quadrats of 200 m2 along the coastline by Burrows (Citation2009). For rocky shorelines, which are the predominant coastal habitat in the study region, low wave fetch supports a greater abundance and diversity of potential intertidal prey species (Burrows Citation2012).
Herring Gulls also exploit resources from terrestrial habitats by foraging on farmland, where they take earthworms and grain, and by scavenging on landfill sites and in other built-up areas (Pons Citation1992, Belant et al. Citation1993, Coulson & Coulson Citation2008). We extracted farmland and built-up areas from Landcover 2000 (Fuller et al. Citation2002). Built-up area was defined as the area covered by buildings and gardens in suburban/rural developed areas and continuous urban areas. Farmland was categorized as the area covered by agriculture and agriculturally improved grassland.
Out at sea, Herring Gulls may forage on small pelagic fish but mainly scavenge on fishery discards (Spaans Citation1971, Camphuysen Citation1995, Tasker et al. Citation2000). From recent diet samples across the study region we know that Herring Gulls consume very few fish, mostly obtained from discards (O’Hanlon et al. Citation2017). Thus fishing activity is thought to be a suitable proxy for foraging opportunities at sea. For the UK, there are no publicly available data on discard quantities (Gibson et al. Citation2015) and landing data are only available on a coarser spatial level than we required. Instead, we assume that fishery activity, and therefore discard availability is greater where demersal fish are more abundant. We used demersal fish abundance extracted from the International Bottom Trawl Survey (IBTS) data at the International Council for the Exploration of the Sea (ICES) sea area level (; data obtained from https://datras.ices.dk/Home/Descriptions.aspx) as a proxy of opportunity to scavenge on fishery discards. Our study region encompassed four of these sea areas and for each we averaged the total catch per unit effort (CPUE) of all fish age classes trawled during the spring survey (Quarter 1) for 1998–2002. Each colony was assigned the fishery CPUE value of the dominant sea area in its 50 km foraging range.
Statistical analysis
All statistical analyses were performed in R, Version 3.1.1 (R Development Core Team Citation2015). To investigate spatial clustering in colony GR on an objective basis we performed spatial Moran's I Index autocorrelation analysis (Moran Citation1950, Citation1953, Legendre & Fortin Citation1989) using the lctools package in R (Kalogirou Citation2015). The Moran's I Index was based on individual Herring Gull colony's GR and their latitude and longitude, ranging from −1 for spatially dispersed (neighbouring colonies have different values of GR) to +1 for spatially clustered (neighbouring colonies have similar values of GR), with 0 indicating a random spatial pattern of GR. To statistically test whether the Moran's I Index differs from 0, I was transformed to a Z-score with Z > 1.96 indicating significant spatial clustering, whilst Z < −1.96 indicates significant spatial dispersal, at P < 0.05. To visualize spatial variation in Herring Gull colony GR across our study region we carried out K-means clustering (MacQueen Citation1967) using the kmeans function in the R stats package. To identify the most appropriate number of GR clusters, k, the elbow criterion was used, which considers the amount of variance explained by different number of clusters based on a plot of the within group sums of squares. Herring Gull colony locations were then plotted in ArcMap 10.1 and shaded based on the GR clusters.
To determine whether the availability of habitats in the landscape surrounding the colonies explains spatial clustering, we investigated whether variation in colony size in Seabird 2000 (1998–2002) was related to the composition of local habitats in the coastal environment. We used colony size as the response variable rather than colony GR as data on habitat variables was only available for the end of the census period, however, there was a significant positive correlation between colony GR and colony size in Seabird 2000 (r = 0.48, P < 0.001, N = 68). We used a general linear model with colony size as the response variable and habitat variables (fishery CPUE, wave fetch, built-up area and farmland) as explanatory variables. We tested for multi-collinearity between explanatory variables in the car package (Fox & Weisberg Citation2011) and only retained explanatory variables with a Variance Inflation Factor (VIF) < 3 (Zuur et al. Citation2010). This resulted in the area of intertidal habitat being removed due to being correlated with wave fetch. We tested all possible linear combinations of the four potential habitat variables using an information theoretic approach (Burnham & Anderson Citation2002). Akaike Information Criteria corrected for small sample size (AICc) and Akaike weights (wi) were calculated in the R package MuMIn (Barton Citation2017) and compared across candidate models. To account for model uncertainty, we selected only models with the biggest support for the data (ΔAICc ≤ 2) compared to the model with the lowest AICc (Burnham & Anderson Citation2002) and used the weighted average of each explanatory variable across all supported models as calculated within the MuMIn R package. The effect of each habitat variable on Herring Gull colony size were determined from the model-averaged estimates and 95% confidence intervals were calculated, those not overlapping zero show support that a variable is important. Residual plots were inspected and colony size was natural logarithm transformed to ensure no deviations from homoscedasticity or normality occurred.
Results
Population growth rates
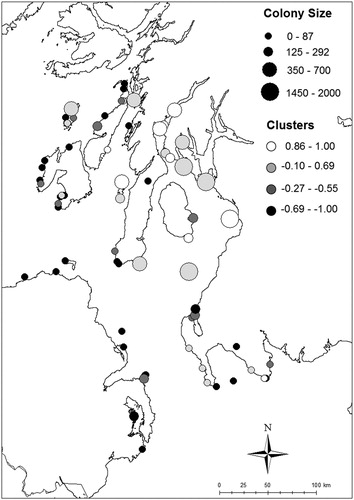
Between the first survey (Operation Seafarer, 1969) and the most recent survey (Seabird 2000, 1998–2002) Herring Gull abundance significantly declined across the study region (mean ± se GR = -0.228 ± 0.09, one-tailed t-test against no change, i.e. GR = 0: t = 2.53, P = 0.014, N = 68). Colony GR over the whole census period (1969–2002) was correlated with the colony GR during the second half of the study period (1985–2002, r = 0.62, P < 0.001, N = 49 where colony site between second and third census could be matched). Therefore, the trend over the entire period reflected the trend in the more recent years. We found that Herring Gull colonies were spatially clustered with respect to GR (Moran's I = 0.410, Z = 2.74, P = 0.007) with K-means clustering supporting four distinct GR clusters (). Colonies to the north and the east of the study region mostly increased whereas the majority of colonies to the south and west have declined. Colonies that were the largest at the start of the study period (in 1969) had the strongest declines whereas colonies that were smaller in 1969 have increased over the study period (Linear model: F1,66 = 16.85, P < 0.001).
Figure 2. Locations of Herring Gull colonies with known changes in colony size between 1969 and 2002 across the study region. The shade of the circle depicts the extent of colony growth rate over the study period; along a gradient of white (strongest increase) to black (strongest decline); categories based on a K-means cluster analysis (see text). The size of the circle reflects the size of the colony at the end of the census period during Seabird 2000 (1998–2002).
Spatial variation in local potential foraging habitat
Investigating colony size during Seabird 2000, we found two models that were competitive in explaining the observed spatial variation in Herring Gull colony size (). The model-averaged output from these two models indicated that wave fetch and the extent of farmland within 50 km of the breeding colony were the most important variables, with 95% confidence intervals that did not overlap with zero (). There was marginal support for fishery CPUE, and no support for built-up area ( & ).
Table 1. Rank of general linear regression models explaining variation in Herring Gull colony size in Seabird 2000 by proxies of the availability of different foraging habitats using Akaike's Information Criterion corrected for small sample size (AICc). k is the number of estimated parameters included, wi is the Akaike weight, and ΔAICc is the AICc difference. Top-supported models (ΔAICc < 2) are shown in bold.
Table 2. Final model-averaged parameter estimates with standard error and 95% confidence intervals. Effects are model-averaged slope estimates derived from the models in , ranked by relative importance of each habitat variable to explain variation in Herring Gull colony size in Seabird 2000.
Discussion
We found evidence for spatial clustering of Herring Gull colonies with respect to changes in colony size across southwest Scotland and Northern Ireland showing that, over the census period, gull colonies in close proximity showed similar changes in size. This may be due to nearby Herring Gull colonies experiencing a similar landscape of key foraging habitats. Change in colony size was negatively related to the size of the colony at the start of the census period, indicating that colonies in the species’ former strongholds showed the greatest declines in size, possible due to intra-colony competition. Between-colony variation in colony size was related to wave fetch and extent of farmland, indicating that colonies located in areas with low wave fetch and more farmland fared better than colonies along exposed coastlines with less farmland habitat in the vicinity. More sheltered coasts are typically associated with a higher diversity and availability of intertidal invertebrates, which is the food source that positively influenced breeding success in a sub-selection of colonies within the study region (O’Hanlon et al. Citation2017). Farmland can also be an important food source for breeding gulls, especially early in chick-rearing, where earthworms can be important in the diet of young chicks (Sibly & McCleery Citation1983, Coulson & Coulson Citation2008). Within the study region, terrestrial invertebrates and grain constitute a large proportion of the Herring Gulls’ diet (O’Hanlon et al. Citation2017). Our results suggest that colonies associated with sheltered coastlines and farmland were larger, indicating that sheltered intertidal habitat and farmland availability had positive consequences on Herring Gull colony size within this region at the end of the census period, although in the past other food resources may have been more important.
Across the census period between 1969 and 2002, the Herring Gull population in the region of interest declined by 22%, a less severe decline than observed at the national level during this period (−57%, Mitchell et al. Citation2004). Conversely, the similar Lesser Black-backed Gull Larus fuscus increased at the national level over the census period, whilst the Great Black-backed Gull Larus marinus experienced a smaller decline (84% and −9%, respectively, Mitchell et al. Citation2004). Within the region of interest, the population change in Lesser Black-backed Gulls was more stable whilst that of the Great Black-backed Gull was similar to that at the national level (−3% and −10%, respectively, O’Hanlon Citation2016).
We found spatial clustering of Herring Gull colonies with respect to change in colony size over a relatively small spatial scale of a few 10s of km, with clustering based on the direction and extent of the change in the size of individual colonies. Large-scale spatial synchrony in population trends have been observed in the large gull species at the scale of the British Isles (Nager & O’Hanlon Citation2016) as well as in other seabird species (Black-legged Kittiwake Rissa tridactyla, Frederiksen et al. Citation2005, Cook & Robinson Citation2010; Marbled Murrelet Brachyramphus marmoratus, Bertram et al. Citation2015). This may suggest that nearby colonies forage in the same places or they encounter similar environments (Moran effect, Brown et al. Citation1995, Williams et al. Citation2003, Liebhold et al. Citation2004). Studies on multiple seabird colonies concluded that neighbouring colonies frequently do not overlap in their forging areas (Wanless & Harris Citation1993, Wakefield et al. Citation2013, but see Ainley et al. Citation2004, Evans et al. Citation2015) and this has also been seen in a species closely related to Herring Gulls, the Lesser Black-backed Gull (Corman et al. Citation2016). Therefore, habitat composition is likely to be similar among neighbouring colonies but different between colonies further away, and it is likely that small scale variation in habitat distribution is relatively unimportant in this system.
Spatial variation in colony size was correlated with wave fetch, which reflects information on intertidal habitat, and the extent of farmland habitat within the vicinity. Rocky shores, the predominant coastal habitat in the study region, have higher diversity and abundance of marine invertebrates in more sheltered locations (Burrows et al. Citation2008, Burrows Citation2012). Herring Gulls can forage extensively within intertidal habitats (Hunt & Hunt Citation1973, Kubetzki & Garthe Citation2003), and marine invertebrates were the key prey predicting breeding success in the study region from a sub-sample of colonies (O’Hanlon et al. Citation2017). Furthermore, Herring Gulls on more sheltered shorelines may breed more successfully possibly due to these colonies being more sheltered from adverse weather events, which could influence egg and chick survival or affect the gulls’ foraging ability (Schreiber Citation2001). Farmland habitats, particularly grassland, are highly predictable in both time and space (Pons Citation1992) and Herring Gulls are known to forage on farmland, specifically pastures, for grain and invertebrates, particularly earthworms (Sibly & McCleery Citation1983, Pons Citation1992, Schwemmer et al. Citation2008). Intertidal and farmland prey are not necessarily the most energy- and nutrient-rich food sources, especially in comparison to fish or anthropogenic food items scavenged from built-up areas and landfill sites (O’Hanlon et al. Citation2017, van Donk et al. Citation2017). However, access to these more energy rich resources may have declined in the region, especially due to changes in fishery discards and waste management (Weiser & Powell Citation2011, Bicknell et al. Citation2013, Foster et al. Citation2017). In addition to food quality, there may also be trade-offs in resource choice associated with resource predictability, risk in obtaining food items, handling times and variability in intra-specific competition for higher quality resources (van Donk et al. Citation2017). Within our study region, it appears that, at least at the end of the study period, intertidal and farmland habitats provides an available, predictable food source for breeding Herring Gulls. It is unlikely that the quality of the intertidal habitat for foraging gulls has increased over time given that the coastal environments in north-west Europe has experienced particularly high levels of anthropogenic pressure (Halpern et al. Citation2008).
We found minimal support that anthropogenic terrestrial food sources and fishery activity influenced Herring Gull colony size at the end of the study period, however this does not mean that these were not important drivers in the past. Ideally, we would have liked to investigate changes in anthropogenic food sources, but these data are not available back to the 1960's when the first census of Herring Gull colonies was undertaken. Thus, we cannot rule out that changes in the availability or quality of food items from anthropogenic habitats or activities have influenced Herring Gull colony size. It appears that fishery activities at the end of the census period was a relatively unimportant driver of changes in colony size. In a sub-sample of colonies within our study region, offshore food items only represented a very small amount of the diet consumed by Herring Gulls (O’Hanlon et al. Citation2017), supporting this conclusion. However, the underlying assumptions that the amount of demersal fish caught in Bottom Trawl Surveys is a good predictor of fishery activity and discard availability may be incorrect. The distribution of fishery activities may also have been different at the start of the study period, and therefore it could have been an important driver of colony size in the past if fisheries were most active in the areas of former Herring Gull strongholds in the study region. Current fishery activities are very low with the exception of a commercial Norway Lobster fishery (Thurstan & Roberts Citation2010) and may no longer be able to support large colonies and hence those populations have declined the most. Unfortunately, such historic data are not available at the required spatial scale to investigate this.
As data on the habitat variables of interest were not available for the earlier census period we investigated spatial variation in colony size at the end of the census period rather than colony GR. However, there was a significant positive relationship between colony GR and colony size in Seabird 2000, indicating that the largest colonies at the end of the census period were also those that had increased the most between Operation Seafarer (1969) and Seabird 2000 (1998–2002). Although, this was not always the case, as some colonies which declined over the census period may still be larger than some of the smaller colonies, and vice versa. Interestingly, analysing variation in colony GR in relation to local habitat availability gave similar results to that investigating colony size at the end of the census period, with wave fetch being the most important variable is explaining spatial variation in Herring Gull colony growth rate (online Tables S1 & S2). This suggests that the presence of sheltered intertidal habitat within the foraging range of a colony may not only support larger Herring Gull colonies now, but also may have had a positive effect on the colony GR of these colonies in the past, or at least buffered them from the environmental changes that caused the declines in colony size elsewhere.
Information on habitat availability for each colony were extracted from the mean maximum area over which breeding Herring Gulls are known to forage (Götmark Citation1984, Camphuysen Citation1995, Thaxter et al. Citation2012, NJO’H unpubl. data). Foraging ranges can vary with colony size (Jovani et al. Citation2015), with individuals from larger colonies potentially travelling further due to competition and local food depletion near the colony (Furness & Birkhead Citation1984). It is therefore difficult to estimate accurately the foraging range for every colony. However, selecting the mean maximum foraging distance of breeding gulls will account for resources that are potentially accessible around the colony. There will also be variation in the distribution of suitable foraging habitats with respect to the distance to the colony. Suitable foraging habitat near the colony is likely to be more favourable for foraging individuals than similar habitat further away from the colony where the forager has to travel further. We did not account for variation in the distribution of habitat around the colonies, and distance to foraging sites may explain some of the residual variation in our analyses of colony size.
Local habitat composition may not be the only factor that influences changes in Herring Gull colony size. Specific colony conditions may explain their different changes in colony size compared to neighbouring colonies. For instance, predation pressures and human disturbance may affect colonies locally and may have been responsible for some declines, however, these factors generally act on a colony by colony basis. Predation pressure in the study region may have increased over time, for example with the introduction of the American Mink Neovison vison (Craik Citation1997).
In this study, we only considered the environment surrounding the colony, as we knew that was the area that Herring Gulls exploited during the breeding season. During this period, suitable habitat may improve breeding success, which will affect colony size in the long term. Survival during the non-breeding season is another factor that can affect colony size. British Herring Gulls are dispersive migrants (Coulson & Butterfield Citation1985) and it is unlikely that all individuals from the same colony will experience similar environments throughout the year. Because of the spatial clustering of changes in colony size, this would suggest that factors in the environment that they share, i.e. in the breeding season, are the more important drivers of changes in colony size. Alternatively, changes in colony size may not be due to local productivity and mortality, but are a consequence of the movement of individual birds out of formerly suitable areas into areas that provide better opportunities for breeding and survival. Future studies of movements in ringing recoveries between different landscapes would give us further insight into this possibility.
We found spatial clustering of Herring Gull colonies within a relatively small region of 200 by 200 km. Within this region, our results suggest that Herring Gull colony size was sensitive to spatially variable habitat availability/quality in the coastal environment, but that the environment varied over a larger scale than the distances between neighbouring colonies. Identifying environmental drivers of population changes is challenging. This study demonstrates that investigating spatial variation in colony sizes is a promising approach. It also highlights the potential of monitoring multiple colonies and identifying spatial variation in population trajectories to help investigate relevant variables that might explain spatial differences in population changes. It needs to be emphasized that colony size can be specific to the particular environment in which the gulls forage and therefore warns that common conservation management might not be equally effective at all sites, highlighting the need for area-specific conservation measures.
Supplemental Material
Download MS Word (15.4 KB)Acknowledgements
The Seabird Colony Census data were extracted from the Seabird Monitoring Programme Database at www.jncc.gov.uk/smp and www.jncc.gov.uk/page-4460. Data have been provided to the Seabird Monitoring Programme by the generous contributions of nature conservation and research organizations, and of many volunteers throughout the British Isles. We would also like to thank the two anonymous reviewers for their constructive comments that greatly improved the manuscript.
ORCID
Nina J. O’Hanlon http://orcid.org/0000-0001-6396-4518
Ruedi G. Nager http://orcid.org/0000-0003-1129-5724
Additional information
Funding
Related Research Data
References
- Ainley, D.G., Ribic, C.A., Ballard, G., Heath, S., Gaffney, I., Karl, B.J., Barton, K.J., Wilson, P.R., Webb, S., Ainley, D.G., Ribic, C.A., Ballard, G., Heath, S., Gaffney, I.A.N., Karl, B.J., Barton, K.J., Wilson, P.R. & Webb, S. 2004. Geographic structure of Adélie penguin populations: overlap in colony-specific foraging areas. Ecol. Monogr. 74: 159–178. doi: 10.1890/02-4073
- Barton, K. 2017. MuMIn: Multi-Model Inference. R package version 1.40.0. https://CRAN.R-project.org/package=MuMIn.
- Baum, J.K. & Worm, B. 2009. Cascading top-down effects of changing oceanic predator abundances. J. Anim. Ecol. 78: 699–714. doi: 10.1111/j.1365-2656.2009.01531.x
- Belant, J.L., Seamans, T.W., Gabrey, S.W. & Ickes, S.K. 1993. Importance of landfills to nesting Herring Gulls. Condor 95: 817–830. doi: 10.2307/1369420
- Bertram, D.F., Drever, M.C., Mcallister, M.K., Schroeder, B.K., Lindsay, D.J., Faust, D.A. & Green, A.J. 2015. Estimation of coast-wide population trends of marbled murrelets in Canada using a Bayesian hierarchical model. PLoS One 10: e0134891. doi: 10.1371/journal.pone.0134891
- Bicknell, A.W.J., Oro, D., Camphuysen, K.C.J., Votier, S.C. & Blanchard, J. 2013. Potential consequences of discard reform for seabird communities. J. Appl. Ecol. 50: 649–658. doi: 10.1111/1365-2664.12072
- Birt, V.L., Birt, T.P., Goulet, D., Cairns, D.K. & Montevecchi, W.A. 1987. Ashmole’s halo: direct evidence for prey depletion by a seabird. Mar. Ecol. Prog. Ser. 40: 205–208. doi: 10.3354/meps040205
- Brown, J.H., Mehlman, D.W. & Stevens, G.C. 1995. Spatial variation in abundance. Ecology 76: 2028–2043. doi: 10.2307/1941678
- Burger, A.E. & Piatt, J.F. 1990. Flexible time budgets in breeding common murres: buffers against variable prey abundance. Stud. Avian Biol. 14: 71–83.
- Burnham, K.P. & Anderson, D.R. 2002. Model Selection and Multimodel Inference: a practical information-theoretical approach. Springer-Verlag, New York.
- Burrows, M.T. 2009. Wave fetch model. www.sams.ac.uk/michael-burrows/wave-fetch-model-description.
- Burrows, M.T. 2012. Influences of wave fetch, tidal flow and ocean colour on subtidal rocky communities. Mar. Ecol. Prog. Ser. 445: 193–207. doi: 10.3354/meps09422
- Burrows, M.T., Harvey, R. & Robb, L. 2008. Wave exposure indices from digital coastlines and the prediction of rocky shore community structure. Mar. Ecol. Prog. Ser. 353: 1–12. doi: 10.3354/meps07284
- Butchart, S.H.M., Walpole, M., Collen, B., van Strien, A., Scharlemann, J.P.W., Almond, R.E.A., Baillie, J.E.M., Bomhard, B., Brown, C., Bruno, J., Carpenter, K.E., Carr, G.M., Chanson, J., Chenery, A.M., Csirke, J., Davidson, N.C., Dentener, F., Foster, M., Galli, A., Galloway, J.N., Genovesi, P., Gregory, R.D., Hockings, M., Kapos, V., Lamarque, J.-F., Leverington, F., Loh, J., McGeoch, M.A., McRae, L., Minasyan, A., Hernández Morcillo, M., Oldfield, T.E.E., Pauly, D., Quader, S., Revenga, C., Sauer, J.R., Skolnik, B., Spear, D., Stanwell-Smith, D., Stuart, S.N., Symes, A., Tierney, M., Tyrrell, T.D., Vié, J.C. & Watson, R. 2010. Global biodiversity: indicators of recent declines. Science 328: 1164–1168. doi: 10.1126/science.1187512
- Camphuysen, K.C.J. 1995. Herring Gull Larus argentatus and Lesser Black-backed Gull L. fuscus feeding at fishing vessels in the breeding season: competitive scavenging versus efficient flying. Ardea 83: 365–380.
- Cook, A.S.C.P. & Robinson, R.A. 2010. How representative is the current monitoring of breeding beabirds in the UK? BTO Reserch Report 573: 1–144.
- Cordes, L.S., Hedworth, H.E., Cabot, D., Cassidy, M., Thompson, P.M., & Phillips, R. 2015. Parallel declines in survival of adult Northern Fulmars Fulmarus glacialis at colonies in Scotland and Ireland. Ibis 157: 631–636. doi: 10.1111/ibi.12255
- Corman, A., Mendel, B., Voigt, C., & Garthe, S. 2016. Varying foraging patterns in response to competition? A multicolony approach in a generalist seabird. Ecol. Evol. 6: 974–986. doi: 10.1002/ece3.1884
- Coulson, J.C. & Butterfield, J. 1985. Movements of British Herring Gulls. Bird Study 32: 91–103. doi: 10.1080/00063658509476863
- Coulson, J.C., & Coulson, B.A. 2008. Lesser Black-backed Gulls Larus fuscus nesting in an inland urban colony: the importance of earthworms (Lumbricidae) in their diet. Bird Study 55: 37–41. doi: 10.1080/00063650809461535
- Craik, C. 1997. Long-term effects of North American Mink Mustela vison on seabirds in western Scotland. Bird Study 44: 303–309. doi: 10.1080/00063659709461065
- Cramp, S., Bourne, W.R.P. & Saunders, D. 1974. The Seabirds of Britain and Ireland. Collins, London.
- Crespin, L., Harris, M.P., Lebreton, J.-D., Frederiksen, M. & Wanless, S. 2006. Recruitment to a seabird population depends on environmental factors and on population size. J. Anim. Ecol. 75: 228–238. doi: 10.1111/j.1365-2656.2006.01035.x
- van Donk, S., Camphuysen, K.C.J., Shamoun-Baranes, J. & van der Meer, J. 2017. The most common diet results in low reproduction in a generalist seabird. Ecol. Evol. 7: 4620–4629. doi: 10.1002/ece3.3018
- Eaton, M., Aebischer, N., Brown, A., Hearn, R., Lock, L., Musgrove, A., Noble, D., Stroud, D., & Gregory, R. 2015. Birds of conservation concern 4: the population status of birds in the UK, Channel Islands and Isle of Man. Br. Birds 108: 708–746.
- Ens, B.J., Blew, J., van Roomen, M. & van Turnhout, C. 2009. Exploring contrasting trends of migratory waterbirds in the Wadden Sea. Wadden Sea Ecosyst. 27: 1–50.
- Evans, J.C., Dall, S.R.X., Bolton, M., Owen, E. & Votier, S.C. 2015. Social foraging European shags: GPS tracking reveals birds from neighbouring colonies have shared foraging grounds. J. Ornithol. 157: 23–32. doi: 10.1007/s10336-015-1241-2
- Foster, S., Swann, R.L. & Furness, R.W. 2017. Can changes in fishery landings explain long-term population trends in gulls? Bird Study 64: 90–97. doi: 10.1080/00063657.2016.1274287
- Fox, J. & Weisberg, S. 2011. An R Companion to Applied Regression. SAGE Publications Limited, Thousand Oaks, CA.
- Frederiksen, M., Harris, M.P. & Wanless, S. 2005. Inter-population variation in demographic variation parameters: a neglected subject? Oikos 111: 209–214. doi: 10.1111/j.0030-1299.2005.13746.x
- Fuller, R.M., Smith, G.M., Sanderson, J.M., Hill, R.A. & Thomson, A.G. 2002. The UK land cover map 2000: construction of a parcel-based vector map from satellite images. Cartogr. J. 39: 15–25. doi: 10.1179/caj.2002.39.1.15
- Furness, R.W. & Birkhead, T.R. 1984. Seabird colony distributions suggest competition for food supplies during the breeding season. Nature 311: 655–656. doi: 10.1038/311655a0
- Gibson, D., Cardwell, E., Zylich, K., & Zeller, D. 2015. Preliminary reconstruction of total marine fisheries catches for the United Kingdom and the Channel Islands in EEZ equivalent waters (1950–2010). Fisheries Centre Working Paper Series.
- Götmark, F. 1984. Food and foraging in five European Larus gulls in the breeding season: a comparative review. Ornis Fenn. 61: 9–18.
- Guillaumet, A., Dorr, B.S., Wang, G., Doyle, T.J. & Clark, R. 2013. The cumulative effects of management on the population dynamics of the Double-crested Cormorant Phalacrocorax auritus in the Great Lakes. Ibis 156: 141–152. doi: 10.1111/ibi.12109
- Halpern, B.S., Walbridge, S., Selkoe, K.A., Kappel, C. V., Michel, F., D’Agrosa, C., Bruno, J.F., Casey, K.S., Ebert, C., Fox, H.E., Fujita, R., Heinemann, D., Lenihan, H.S., Madin, E.M.P., Perry, M.T., Selig, E.R., Spalding, M., Steneck, R. & Watson, R. 2008. A global map of human impact on marine ecosystems. Science 319: 948–952. doi: 10.1126/science.1149345
- Harald, T., Saether, B., Tufto, J., Jensen, H. & Solberg, J. 2002. Asynchronous spatiotemporal demography of a House Sparrow metapopulation in a correlated environment. Ecology 83: 561–569. doi: 10.1890/0012-9658(2002)083[0561:ASDOAH]2.0.CO;2
- Harris, M.P., Anker-Nilssen, T., McCleery, R.H., Erikstad, K.E., Shaw, D.N. & Grosbois, V. 2005. Effect of wintering area and climate on the survival of adult Atlantic puffins Fratercula arctica in the eastern Atlantic. Mar. Ecol. Prog. Ser. 297: 283–296. doi: 10.3354/meps297283
- Heath, M.R. & Speirs, D.C. 2012. Changes in species diversity and size composition in the Firth of Clyde demersal fish community (1927-2009). Proc. R. Soc. [Biol] 279: 543–552. doi: 10.1098/rspb.2011.1015
- Hunt, G.L. 1972. Influence of food distribution and human disturbance on the reproductive success of Herring Gulls. Ecology 53: 1051–1061. doi: 10.2307/1935417
- Hunt, G.L. & Hunt, M. 1973. Habitat partitioning by foraging gulls in Maine and Northwestern Europe. Auk 90: 827–839. doi: 10.2307/4084363
- JNCC. 2012. Seabird Colony Data. www.jncc.defra.gov.uk/page-4460.
- JNCC. 2014. UK Regional Seas. www.jncc.defra.gov.uk/page-1612.
- Jovani, R., Lascelles, B., Garamszegi, L.Z., Mavor, R., Thaxter, C.B. & Oro, D. 2015. Colony size and foraging range in seabirds. Oikos. 125: 968–974. doi: 10.1111/oik.02781
- Kalogirou, S. 2015. Lctools: local correlation, spatial inequalities, geographically weighted regression and other tools. R package.
- Kubetzki, U. & Garthe, S. 2003. Distribution, diet and habitat selection by four sympatrically breeding gull species in the south-eastern North Sea. Mar. Biol. 143: 199–207. doi: 10.1007/s00227-003-1036-5
- Legendre, P. & Fortin, M. 1989. Spatial pattern and ecological analysis. Vegetatio 80: 107–138. doi: 10.1007/BF00048036
- Lewis, S., Sherratt, T.N., Hamer, K.C. & Wanless, S. 2001. Evidence of intra-specific competition for food in a pelagic seabird. Nature 412: 816–819. doi: 10.1038/35090566
- Liebhold, A., Koenig, W.D. & Bjørnstad, O.N. 2004. Spatial synchrony in population dynamics. Annu. Rev. Ecol. Syst. 35: 467–490. doi: 10.1146/annurev.ecolsys.34.011802.132516
- Lloyd, C., Tasker, M.L. & Partridge, K. 1991. The Status of Seabirds in Britain and Ireland. A&C Black, London.
- Lopez y Royo, C., Silvestri, C., Pergent, G. & Casazza, G. 2009. Assessing human-induced pressures on coastal areas with publicly available data. J. Environ. Manage. 90: 1494–1501. doi: 10.1016/j.jenvman.2008.10.007
- Lotze, H.K., Lenihan, H.S., Bourque, B.J., Bradbury, R.H., Cooke, R.G., Kay, M.C., Kidwell, S.M., Kirby, M.X., Peterson, C.H. & Jackson, J.B.C. 2006. Depletion, degradation, and recovery potential of estuaries and coastal seas. Science 312: 1806–1908. doi: 10.1126/science.1128035
- MacQueen, J.B. 1967. Kmeans and analysis of multivariate observations. 5th Berkeley Symp. Math. Stat. Probab. 1: 281–297.
- McArdle, B.Y.B.H., Gastont, K.J. & Lawtons, J.H. 1990. Variation in the size of animal populations: patterns, problems and artefacts. J. Anim. Ecol. 59: 439–454. doi: 10.2307/4873
- McLellan, N.R. & Shutler, D. 2009. Sources of food delivered to Ring-Billed, Herring and Great Black-Backed Gull chicks in marine environments. Waterbirds 32: 507–513. doi: 10.1675/063.032.0403
- Mitchell, P.I., Newton, S.F., Ratcliffe, N. & Dunn, T.E. 2004. Seabird Populations of Britain and Ireland: results of the seabird 2000 census (1998-2002). T & AD Poyser, London.
- Moran, P. 1950. Notes on continuous stochastic phenomena. Biometrika 37: 17–23. doi: 10.1093/biomet/37.1-2.17
- Moran, P. 1953. The statistical analysis of the Canadian lynx cycle. Aust. J. Zool. 1: 163–173. doi: 10.1071/ZO9530163
- Nager, R.G. & O’Hanlon, N.J. 2016. Changing numbers of three gull species in the British Isles. Waterbirds 39: 15–28. doi: 10.1675/063.039.sp108
- O’Hanlon, N.J. 2016. Spatial variation in Herring Gull traits and their potential as monitors of the coastal environment. PhD thesis, University of Glasgow, Glasgow.
- O’Hanlon, N.J., McGill, R.A.R. & Nager, R.G. 2017. Increased use of intertidal resources benefits breeding success in a generalist gull species. Mar. Ecol. Prog. Ser. 574: 193–210. doi: 10.3354/meps12189
- Osterblom, H., Olsson, O., Blenckner, T., & Furness, R.W. 2008. Junk-food in marine ecosystems. Oikos 117: 967–977. doi: 10.1111/j.0030-1299.2008.16501.x
- Pierotti, R., & Annett, C.A. 1991. Diet choice in the Herring Gull: constraints imposed by reproductive and ecological factors. Ecology 72: 319–328. doi: 10.2307/1938925
- Pons, M. 1992. Effects of change in the availability of human refuse on breeding parameters in a Herring Gull Larus argentatus population in Brittany, France. Ardea 80: 143–150.
- R Core Team 2015. R: a language and environment for statistical computing. Vienna: R Foundation for Statistical Computing. www.R-project.org/
- Robinson, J.P.W., Dornelas, M. & Ojanguren, A.F. 2013. Interspecific synchrony of seabird population growth rate and breeding success. Ecol. Evol. 3: 2013–2019. doi: 10.1002/ece3.592
- van Roomen, M., Laursen, K., van Turnhout, C., van Winden, E., Blew, J., Eskildsen, K., Günther, K., Hälterlein, B., Kleefstra, R., Potel, P., Schrader, S., Luerssen, G. & Ens, B.J. 2012. Signals from the Wadden Sea: population declines dominate among waterbirds depending on intertidal mudflats. Ocean Coast. Manag. 68: 79–88. doi: 10.1016/j.ocecoaman.2012.04.004
- Schreiber, E.A. 2001. Climate and weather effects of seabirds. In Biology of Marine Birds, 179–216. CRC Press, Florida.
- Schwemmer, P., Garthe, S. & Mundry, R. 2008. Area utilization of gulls in a coastal farmland landscape: habitat mosaic supports niche segregation of opportunistic species. Landsc Ecol. 23: 355–367. doi: 10.1007/s10980-008-9194-y
- Sibly, R.M. & Hone, J. 2002. Population growth rate and its determinants: an overview. Philos. Trans. R. Soc. Lond. B. Biol. Sci. 357: 1153–1170. doi: 10.1098/rstb.2002.1117
- Sibly, R.M. & McCleery, R.H. 1983. Increase in weight of Herring Gulls while feeding. J. Anim. Ecol. 52: 35–50. doi: 10.2307/4586
- Spaans, A.L. 1971. On the feeding ecology of the Herring Gull Larus argentatus in the northern part of the Netherlands. Ardea 59: 75–186.
- Sutherland, W.J. & Baillie, S.R. 1992. Patterns in the distribution, abundance and variation of bird populations. Ibis 135: 209–210. doi: 10.1111/j.1474-919X.1993.tb02834.x
- Tasker, M.L., Camphuysen, C.J.K., Cooper, J., Garthe, S., Montevecchi, W.A. & Blaber, S.J.M. 2000. The impacts of fishing on marine birds. ICES J. Mar. Sci. 57: 531–547.
- Thaxter, C.B., Lascelles, B., Sugar, K., Cook, A.S.C.P., Roos, S., Bolton, M., Langston, R.H.W. & Burton, N.H.K. 2012. Seabird foraging ranges as a preliminary tool for identifying candidate marine protected areas. Biol. Conserv. 156: 53–61. doi: 10.1016/j.biocon.2011.12.009
- Thompson, R.C., Crowe, T.P. & Hawkins, S.J. 2002. Rocky intertidal communities: past environmental changes, present status and predictions for the next 25 years. Environ. Conserv. 29: 168–191. doi: 10.1017/S0376892902000115
- Thurstan, R.H. & Roberts, C.M. 2010. Ecological meltdown in the Firth of Clyde, Scotland: two centuries of change in a coastal marine ecosystem. PLoS ONE, 5: e11767 doi: 10.1371/journal.pone.0011767
- Wakefield, E.D., Bodey, T.W., Bearhop, S., Blackburn, J., Colhoun, K., Davies, R., Dwyer, R.G., Green, J.A., Grémillet, D., Jackson, A.L., Jessopp, M.J., Kane, A., Langston, R.H.W., Lescroël, A., Murray, S., Le Nuz, M., Patrick, S.C., Péron, C., Soanes, L.M., Wanless, S., Votier, S.C. & Hamer, K.C. 2013. Space partitioning without territoriality in gannets. Science 341: 68–70. doi: 10.1126/science.1236077
- Walsh, P.M., Halley, D.J., Harris, M.P., Nevo, A., Sim, I.M.W. & Tasker, M.L. 1995. Seabird Monitoring Handbook for Britain and Ireland. JNCC/RSPB/ITE/Seabird Group, Peterborough.
- Wanless, S. & Harris, M.P. 1993. Use of mutually exclusive foraging areas by adjacent colonies of blue-eyed shags (Phalacrocorax atriceps) at South Georgia. Colonial Waterbirds 16: 176–182. doi: 10.2307/1521435
- Weiser, E.L. & Powell, A.N. 2011. Reduction of garbage in the diet of nonbreeding glaucous gulls corresponding to a change in waste management. Arctic 64: 220–226. doi: 10.14430/arctic4101
- White, T.C.R. 2008. The role of food, weather and climate in limiting the abundance of animals. Biol. Rev. 83: 227–248. doi: 10.1111/j.1469-185X.2008.00041.x
- Williams, C.K., Ives, A.R. & Applegate, R.D. 2003. Population dynamics across geographic ranges: time-series analyses of three small game species. Ecology 84: 2654–2667. doi: 10.1890/03-0038
- Zuur, A.F., Ieno, E.N. & Elphick, C.S. 2010. A protocol for data exploration to avoid common statistical problems. Methods Ecol. Evol. 1: 3–14. doi: 10.1111/j.2041-210X.2009.00001.x