
ABSTRACT
Capsule: Nest survival of Great Spotted Woodpeckers Dendrocopos major was not related to the abundance or timing of their caterpillar prey, whereas the number of young fledged per nest was higher in years with high numbers of defoliating caterpillars and when there was a good temporal match between food demand and the peak caterpillar abundance.
Aims: To test whether the breeding parameters of Great Spotted Woodpeckers were affected by the abundance and timing of their caterpillar prey.
Methods: The breeding parameters of Great Spotted Woodpeckers were monitored in four woods in Hertfordshire, UK, from 2001 to 2016. All nests and their outcomes were followed by regular observations and inspection using nest video cameras; 836 nests were found. The timing and abundance of defoliating caterpillars were monitored using frass trays and damage assessments of oak leaves.
Results: The caterpillar abundance rose to a peak and fell again towards the end of the 16-year study. The date of the maximum frass fall was best predicted by the mean April–May temperature. On average, the date of peak food demand of the young woodpeckers was mismatched with the peak prey by four days. The mean number of young fledged per nest was higher in years with high numbers of defoliating caterpillars and in years when the greatest food demand of the chicks coincided with the peak caterpillar abundance. Nest survival was high and was unrelated to caterpillar abundance or timing.
Conclusion: A high abundance of defoliating caterpillars and good synchronization of timing of breeding with the peak availability of the caterpillars can increase brood productivity of the generalist Great Spotted Woodpecker. A combination of low caterpillar abundance and a warm spring is predicted to reduce productivity considerably.
Many bird species in temperate latitudes are thought to time their breeding season to take advantage of the spring flush of invertebrate prey (Lack Citation1950). In deciduous woodlands they particularly exploit the flush of insect larvae which feed on the spring growth of foliage (Perrins Citation1970). In recent years the effects of climate change, with warmer and earlier springs, on phenological matching between the timing of breeding and prey availability has received considerable attention (see Both Citation2010 and Pearce-Higgins & Green Citation2014 for full reviews). These studies have focussed particularly on the impacts of changes in the relative timing of the birds breeding and availability of their prey on breeding success and population trends and the implications for birds and their ability to adapt (Burgess et al. Citation2018, Franks et al. Citation2017). Long-distance migrants with their constrained arrival dates in spring are thought to be particularly vulnerable to change (Both & Visser Citation2001, Both et al. Citation2006) although resident species are affected too (Charmentier et al. Citation2008).
In contrast to the studies of relative timing of the nesting attempts and available prey, there has been much less attention given to the effect of the absolute abundance of prey. The food available at the key period when the young are being fed is a function of both the relative timing of the nesting attempt and the spring prey peak but also the absolute abundance of the prey (Maziarz & Wesołowski Citation2010, Naef-Daenzer & Keller Citation1999, Perrins Citation1991, Hogstad Citation2005, Wesołowski & Rowiński Citation2014). The timing of the caterpillars is likely to be determined by spring temperatures (Smith et al. Citation2011) whereas their abundance is determined by many complex factors and, for defoliating caterpillar species found in temperate oak Quercus woods at least, is known to undergo long-term cycles over decades or more (Berryman Citation1996, Harding Citation2000, Hogstad Citation2005).
The Great Spotted Woodpecker Dendrocopos major is the most omnivorous of Europe’s woodpeckers and takes a wide range of foods using a variety of foraging methods (Glutz von Blotzheim & Bauer Citation1980, Cramp Citation1985, Gorman Citation2004). In the breeding season, in common with many other species of woodland bird, it switches to a diet of invertebrates, with the food brought to nestlings usually dominated by lepidoptera larvae collected from the leaves of trees (Jenni Citation1983, Török Citation1990).
In this paper, we use data from long-term studies of the clutch size, nest survival and the number of young fledged of the Great Spotted Woodpecker, together with data on the timing and abundance of defoliating caterpillars of oak trees to test two hypotheses. First, that breeding performance is related positively to prey abundance and second that it is higher in years when the peak food demand of the nestlings is temporally matched with the peak availability of defoliating caterpillars.
Methods
The study was carried out in four mature woodlands in Hertfordshire, southern England: Wormley Wood 104 ha (51°44ʹ N 0°05ʹ W), Hoddesdonpark Wood 63 ha (51°45ʹ N 0°03ʹ W), Sherrardspark Wood 73 ha (51°48ʹ N 0°12ʹ W) and Hitch Wood 65 ha (51°53ʹ N 0°16ʹ W) (Smith Citation1997, Citation2005 & Citation2006). All the woods were dominated by oak (Quercus petraea & Quercus robur plus hybrids) with other species such as Hornbeam Carpinus betulus, Beech Fagus sylvatica, Sweet Chestnut Castanea sativa, birch Betula sp. and Ash Fraxinus excelsior present to varying degrees in each wood (Smith Citation1997, Citation2005). All the sites are closed canopy mature woodland with limited understorey.
Great Spotted Woodpeckers have been studied in these four woods since the 1980s, with attempts to find all the nests by systematic searches each year and to follow their outcomes. All the nests were in natural tree cavities normally excavated by the woodpeckers themselves (Smith Citation1997, Citation2007). In the last two decades, about 50 nests have been found each year with nest contents determined by using high-resolution colour video nest inspection cameras on telescopic poles (Smith & Charman Citation2012, Wildlife Windows Crevice Cam). Nests were found by checking nest trees and cavities from previous years, searches for excavating birds and signs of active excavations such a fresh holes and wood chips on the ground. Once the adults were incubating or feeding young, we relied on watching them back to the nest. Nests were found at all stages of the nesting cycle but once found they were checked every few days and inspected with the video nest camera to determine the clutch size, number of chicks fledged and the timing of egg laying and fledging. For nests with young, we used the behaviour of the adults at the nest (whether the young were being brooded, fed within the cavity or fed at the entrance hole, Jackson Citation1976) and the stage of development of the young, particularly the feather tracts (Ligon Citation1970, Hadow Citation1976), to gauge their approximate age to help plan the timing of further nest visits. We established a reference collection of our videos of chicks of known age to help with this (Smith unpublished). To determine the number of young fledged the nests were inspected when the young were 18 days old, three to four days before they were due to fledge. At this age, they were well feathered and their red crowns can be used to count them reliably within the cavity (Hadow Citation1976, Cramp Citation1985). The nests were inspected again a few days after the predicted fledging date to check that all the young had left the nest. The date of laying the first egg (first egg date, FED) for each nest was determined by observation or back calculation from nest observations assuming an incubation period of 11 days and 21 days from hatching to fledging.
Based on our estimates of the survival of nests (see results section) and whether the nests were found during the egg or young stages in the nesting cycle, we estimated that we found well over 90% of all the nesting attempts in the woods. We kept a note of any suspected territories where no nests were found or any instances where adults were found feeding recently fledged young in an area where we had found no nests.
In this paper, we have used nesting information collected from the four woods over the 16-year period from 2001 to 2016 (Sherrardspark Wood and Wormley Wood from 2001 to 2016, Hoddesdonpark Wood and Hitch Wood from 2001 to 2015). Data were excluded from 17 nests in Wormley Wood in 2011 when supplementary food was provided as part of an experiment (Smith & Smith Citation2013). Other than in part of Wormley Wood in 2011, no supplementary food was provided within the woods.
Caterpillar timing and abundance were assessed in two ways. Firstly, throughout the period from 2001 to 2016, we undertook assessments of the degree of damage to oak leaves in each wood (Crawley & Akhteruzzaman Citation1988). Oak was selected as this was the tree species whose leaves were most frequently consumed by defoliating caterpillars (Southwood et al. Citation1982, Veen et al. Citation2010). In most years, the other key tree species in the woods, apart from birch, were hardly eaten by defoliators. Sweep net samples showed the main defoliators in the study woods were lepidoptera larvae of many species, including Green Oak Tortrix Tortrix viridana, Winter Moth Operopthera brumata and Mottled Umber Erranis defoliaria (Smith unpublished).
In order to assess the outcome of all the defoliation over the course of the breeding season, we collected bunches of oak leaves (from seven to 37 individual leaves per sample, mean = 17) in mid-June, after the breeding season. In each year we selected 50 oak trees distributed throughout each of the woods (200 trees in total) and collected one bunch of leaves from each tree usually from one small branch. To ensure good representative coverage, the sites were divided into 1 ha squares with a maximum of one oak tree sampled per square. Where they were accessible from the ground leaves were collected at head height, otherwise a 4 m telescopic pruning pole was used to cut them down. We had a standard procedure to score the damage on each leaf in the sample (undamaged by defoliation, small holes, heavily damaged and severely damaged so that only the ribs of the leaves remained). We estimated that these categories corresponded to leaf area losses of 0%, <30%, 30–60% and >60% respectively.
In addition to the leaf damage samples, from 2008 to 2016 we assessed the timing and abundance of caterpillars using plastic trays set beneath oak trees to collect fallen caterpillar droppings; referred to as frass (see Smith et al. Citation2011 for details of the method). We operated four trays per wood, with the contents collected every 3–8 days (mean interval 5.4 days) starting from late April through to early June. The trays were 350 × 220 mm with corrugated bases and drainage holes. In order to minimize any impact of rainfall on the collected frass, the trays were loosely lined with permeable lightweight horticultural fleece. At every collection, the used fleeces were removed from the trays, carefully folded and replaced with new ones. The folded fleeces were dried at room temperature and the contents brushed into a sorting tray. These were then passed through a 1.2 mm mesh sieve and the frass sorted and collected by hand under a low-power binocular microscope (magnification ×7–×10) The frass was weighed to the nearest mg using a laboratory balance (Kern 440-21N). This method has been used successfully in other widescale projects in the UK (Smith et al. Citation2011, Burgess et al. Citation2018).
Analysis
The timing of the frass peak for each wood from 2008 to 2016 was estimated by fitting a quadratic relationship to the log(frass fall + 1) against the mid-date of each collection interval for each tray following Smith et al. Citation2011. We modelled the date of the frass peak from 2008 to 2016 against temperature variables from each of the woods and used this model to estimate the date of the caterpillar peak for the whole of the study period (2001–16). We used local temperature data from Rothamsted Experimental Station (Perryman et al. Citation2018), which is within 23 km of all the study sites and 128 m above sea level. Our study woods ranged in mean altitude from 70 to 140 m above sea level and we corrected the temperatures for the altitude difference from Rothamsted using a lapse rate of 0.0065 deg C m−1 (International Civil Aviation Organisation). We used the daily maximum and minimum temperatures to calculate the mean daily temperature and then took the average for each 10-day period starting from 1 April through to 30 May and for the whole of April and May and for April-May combined. We examined the correlation coefficients between the date of the peak frass fall and each of these nine temperature variables and selected the one with the highest correlation to be used in the subsequent models.
The leaf damage index for each wood and year was calculated by modelling the proportion of heavily or severely damaged leaves in each sample in a Generalized Linear Model (GLM) with binomial errors and a logit link function. To demonstrate the relationship between our assessments of leaf damage and the frass fall we calculated the accumulated frass fall from the four traps in each wood over the duration of the season, converted to g frass m−2, and regressed this against the leaf damage indices for the period 2008–16 using linear regression. We chose the accumulated frass fall as this would best represent the effect of the defoliation on the leaves over the whole season.
The explanatory variables used in all our analyses of the nesting parameters were selected to test our two hypotheses and are summarized in . For each nest, we made an assessment of the precision of our estimate of the first egg date and only used data where it could be determined within ±5 days. Overall, we estimated that first egg date was known to within ±2 days for the sample of nests used in our analysis. As our measure of the degree of synchrony between the timing of the nests in each wood and year and the caterpillar peak we used the interval in days between the median first egg date and the estimated date of the peak of the caterpillar abundance minus 25 days (FRASSDIFF). Twenty-five days was the expected interval between the laying of the first egg and the peak food demand for the nestlings (Wesołowski & Rowiński Citation2014). We used the square of the frass difference in the models, as any relationship was expected to be curvilinear with a peak around zero. The leaf damage index (LEAFINDEX) was included as the measure of the abundance of defoliating caterpillars in each year and wood. We included the wood (SITE) as a categorical fixed variable to test for differences between our four study sites.
Table 1. The explanatory variables used in the models.
We produced separate models for the number of eggs laid (clutch size) and the number of young fledged. Both used Poisson errors and log link function within a generalized linear model (GLM) framework. The number of complete nest failures was low, so we were able to include failed nests (i.e. those where no young fledged) within the model of the number of young fledged thus modelling overall productivity. All the predictive variables (FED, FRASSDIFF2, LEAFINDEX and SITE) were incorporated in the models. We included the interaction between first egg date and the leaf damage index (FED*LEAFINDEX) to allow for the possibility that the decline of both the clutch size and the number of young fledged with first egg date depended on the abundance of caterpillars.
We modelled the daily nest survival using a Mayfield approach (Mayfield Citation1975) in a GLM framework with binomial errors and a logit link function with nest outcome (0 or 1) as the numerator and the number of days the nest was under observation (nest exposure) as the denominator (Johnson Citation1979). For failed nests, we used the mid-point between the last two observations to calculate the nest days. Nest survival during the egg and chick stages was analysed separately.
In building the models we initially included all the predictive variables and then simplified by sequential removal of insignificant terms testing the change in model deviance using analysis of variance (ANOVA) and chi2 tests (Crawley Citation2007). This process was continued until the remaining variables were all significant.
All statistical analyses were carried out in Minitab 16 (Minitab Citation2010) and R (R Development Core team Citation2015).
Results
In total, 836 nests were found over the course of the study with 136 found during laying, 136 during incubation, 49 around hatching and 515 whilst the young were being provisioned. The mean clutch size was 5.37 ± 0.05 (se) (n = 290) with the mean number of young fledged considerably lower at 3.78 ± 0.06 (se) (n = 668). There were no overall differences between the woods (mean clutch size, Hoddesdonpark Wood = 5.45 ± 0.15 (se) (n = 38), Hitch Wood = 5.35 ± 0.15 (se) (n = 20), Sherrardspark Wood = 5.52 ± 0.08 (se) (n = 110), Wormley Wood = 5.22 ± 0.09 (se) (n = 122), ANOVA F3,286 = 2.25, P = 0.08; mean number of young fledged, Hoddesdonpark Wood = 3.82 ± 0.10 (se) (n = 125), Hitch Wood = 3.90 ± 0.19 (se) (n = 61), Sherrardspark Wood = 3.96 ± 0.10 (se) (n = 202), Wormley Wood = 3.61 ± 0.10 (se) (n = 280), ANOVA F3,664 = 2.45, P = 0.06).
The mean first egg date was 26.4 ± 6.7 (sd, April 1st = day 1) with small but significant differences between the woods (mean FED, Hoddesdonpark Wood = 27.3 ± 6.8 (sd) (n = 148), Hitch Wood = 29.2 ± 6.1 (sd) (n = 96), Sherrardspark Wood = 24.4 ± 6.5 (sd) (n = 266), Wormley Wood = 26.9 ± 6.6 (sd) (n = 319); ANOVA, F3,825 = 15.40, P <0.001). There was a trend for earlier nesting over the course of the study with the first egg date advancing by 0.20 days per year (GLM, FED = 432.7–0.20*Year, χ2 = 14.78, P < 0.001, n = 829). The birds were largely single brooded with only one known case of re-nesting after failure during incubation and only five other late nests indicative of re-nesting. Common Starlings Sturnus vulgaris, which were the cause of early season nest failures during the 1980s (Smith Citation2005, Citation2006), were no longer breeding in the woods during this study.
Typically, the frass started at a low level in April with the peak sometime in May and a subsequent reduction by early June (). There was considerable variation in the date of the peak frass fall from year to year (median date of peak frass fall 21 May (= day 51) range 29 Apr to 7 June, n = 33). The frass peaks were well defined for all years except 2015 and 2016 when low levels of frass meant the plots were more variable, although it was still possible to model the date of the peak. All but two of the temperature variables were significantly correlated with the date of peak frass fall () but the one with the most significance was the mean daily April–May temperature (, date of peak frass fall = 145.4–9.12 * April–May temperature, F1,31 = 237.6, P < 0.001).
Figure 1. An example of the patterns of frass fall in relation to period of egg laying for Sherrardspark Wood from 2008 to 2016. The dots and lines are the mean frass fall in g day−1 m−2 for the four trays deployed in the wood. The dotted lines, solid bar and cross point represent the range, inter-quartile range and median first egg date in that year. The arrows indicate the predicted date of peak food demand for the nestlings, 25 days after the first egg date. Note the different scales on the y-axes.
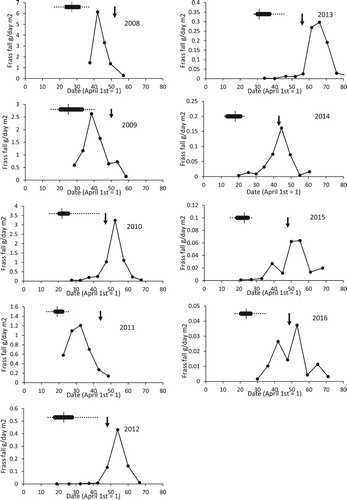
Figure 2. The mean date of peak frass fall against mean lapsed April-May temperature for the period 2008–16. The mean April-May temperature provided a highly significant relationship (date of peak frass fall = 145.4–9.12 * corrected mean April–May temperature, F1,31 = 237.6, P < 0.001).
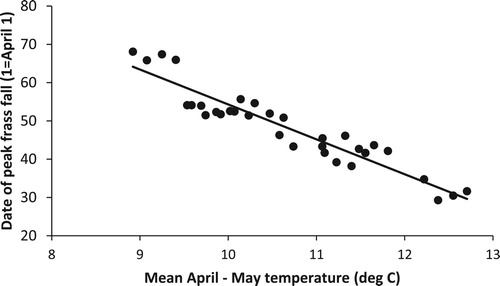
Table 2. Correlations between the date of peak frass fall and the temperature variables over the period 2008–16.
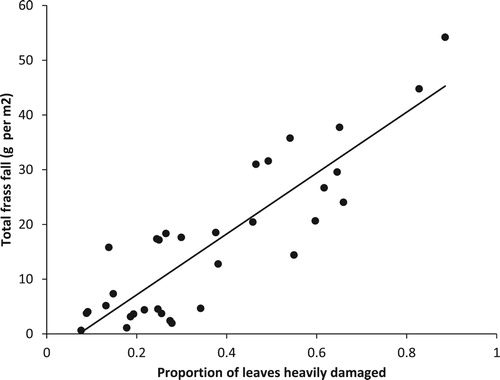
Over the years when we were running the frass trays the measured peak frass fall varied by a factor of 10 or more between woods and years (Hoddesdonpark Wood 2008–15, range 0.2–2.8 g day−1 m−2; Hitch Wood 2008–15, 0.4–5.0 g day−1 m−2; Sherrardspark Wood 2008–16, 0.04–6.2 g day−1 m−2; Wormley Wood 2008–16, 0.2–2.0 g day−1 m−2). The leaf damage index also varied considerably over the course of the study (). The leaf damage index was a good surrogate measure of the caterpillar abundance with a highly significant regression between the proportion of damaged leaves and the total frass fall for the eight years for which we have data (, total frass fall = −3.98 + 55.6 * proportion of leaves heavily or severely damaged, F1,31 = 100.15, P < 0.001).
Figure 3. The proportion of oak leaves heavily or severely damaged (LEAFIND) from 2001 to 2016. □ Wormley Wood, ▪ Hoddesdonpark Wood, ▴ Sherrardspark Wood, x Hitch Wood. Error bars are ±se from binomial models of proportions.
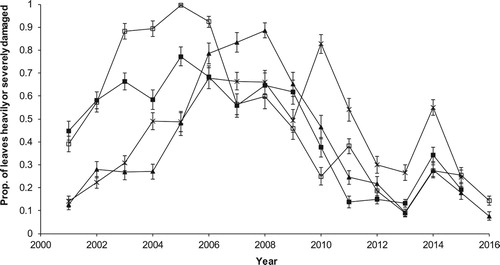
Figure 4. The total frass fall over the course of the nesting season versus the proportion of oak leaves heavily or severely damaged for the period 2008–16 (total frass fall = −3.98 + 55.6 * proportion of leaves heavily damaged, F1,31 = 100.15, P < 0.001).
The details of the development of the models for nest survival, clutch size and number of young fledged are provided in . The only significant variable retained in the model of clutch size was the first egg date, with early clutches being around one egg larger than late ones in any year (). None of the other variables (SITE, LEAFIND, FRASSDIFF2 & FED*LEAFIND) were retained in the models ().
Table 3. Development of the model describing the variation in clutch size of Great Spotted Woodpeckers. GLM with Poisson errors and log link function. Details of the full model, the significance of variables as they were dropped from the model and the final minimum adequate model (MAM) are given.
Table 4. Development of the model describing the variation in the number of young fledged per nest in Great Spotted Woodpeckers. GLM with Poisson errors and log link function. Details of the full model, the significance of variables as they were dropped from the model and the final minimum adequate model (MAM) are given.
Table 5. Development of the model describing the variation in nest survival of Great Spotted Woodpeckers during laying and incubation. GLM with binomial errors and a logit link function. Details of the full model, the significance of variables as they were dropped from the model and the final minimum adequate model (MAM) are given.
The number of young fledged declined through the season but was higher in years with high levels of defoliation and hence caterpillar food supply (). The retention of the square of the frass difference in the model (FRASSDIFF2; ) suggests there is some evidence that nests that were synchronized with the frass peak had higher productivity.
We monitored 272 nests at some stage during laying and incubation with a total of 3089 nest-days observation. Of these nests, 19 were known to have failed although only 15 failures could be included in the models because the first egg date was not known for four of the nests with eggs which were only discovered after they had already failed. There were significant differences between the nest survival during laying and incubation in the four woods, with nests in Sherrardspark Wood having a significantly higher survival than the other three woods but no other variables (FED, LEAFIND, FRASSDIFF2 & FED*LEAFIND) were significant (). The mean daily survival of 0.9951 (±se range 0.9937–0.9962) gave an overall nest survival during the 15 days of laying and incubation of 0.929 (±se range 0.910–0.944).
During the chick rearing phase 810 nests were monitored involving 10 625 nest-days observation and 20 known nest failures. The only significant variable in the chick stage nest survival models was the first egg date () with later nests for the year being more likely to fail during the chick rearing phase. The overall daily nest survival during chick rearing was 0.9981 (±se range 0.9976–0.9985) which translates to an overall nest survival over the 21 days of chick rearing of 0.961 (± se range 0.951–0.969).
Table 6. Development of the model describing the variation in nest survival of Great Spotted Woodpeckers during chick rearing. GLM with binomial errors and a logit link function. Details of the full model, the significance of variables as they were dropped from the model and the final minimum adequate model (MAM) are given.
Discussion
We have shown that both the caterpillar abundance and the degree of synchrony have a significant impact on the number of young produced per nest. The magnitude of the effects is similar for the caterpillar abundance and degree of synchrony but both are modest. For instance, for a nest with the clutch started at the mean first egg date (FED = 26.4) and the mean difference between the frass peak and peak food demand (FRASSDIFF = −3.8) we predict that the productivity would increase from 3.92 to 4.25 young per nest (+8.4%) if the leaf index increased from the mean to +1 sd (from 0.46 to 0.74). Similarly, if the same nest happened to be in a warm year when the frass difference was shifted by 1 sd (FRASDIFF from −3.8 to −10.0) the productivity would decrease to 3.70 young per nest (–5.7%). A combination of both low caterpillar numbers and a warm spring would reduce the productivity further to 3.32 young per nest (−15% from the base case).
Statistically, the evidence for an effect of caterpillar abundance on the number of young fledged was far stronger than that for synchrony. The quadratic relationship with frass difference, although of the form and timing that we would expect, was only significant to P = 0.042. Given the limitations in the precision of our data on the timing of both the first egg date and frass peak it could be that the real relationship has been masked to some extent. It is also clear from that in most years the birds adjusted their timing of breeding to be reasonably well matched to the caterpillar peak. On average, the frass peak was about four days in advance of the peak food demand and it was only in years with particularly warm springs that there was significant mismatch (for instance 2008, 2009 and 2011 in ).
In a similarly conceived study of breeding Blue Tits Cyanistes caeruleus over three years in the Białowieża National Park, Poland, Wesołowski & Rowiński (Citation2014) found no evidence of an effect of mismatch on productivity and concluded that there were always sufficient caterpillars available for the birds. However, in their study years the timing of the frass peak only varied by about eight days, which is considerably less than the 30 or so days in our study. Interestingly the main tree species subject to defoliation in Białowieża was Hornbeam with the oak leaves emerging after the bird nesting season. This is in contrast with the situation in UK and elsewhere, where it is the synchrony between the birds, the oaks and the oak defoliators which seems of key importance (Perrins Citation1970, Citation1991, Visser et al. Citation2006, Both et al. Citation2009, Burgess et al. Citation2018).
In the longer term, since the mid-1980s, the Great Spotted Woodpeckers in our study woods have advanced their first egg date by about 20 days; a rate of 0.62 days per year. Initially, this was in response to reduced nest site competition from Common Starlings but more recently in response to warmer spring temperatures with a rate of 0.40 days per year from 1990 onwards (Smith Citation2005, Citation2006). Between 2001 and 2016 the mean first egg date advanced by only 0.20 days per year – a figure similar to that reported for other species in the UK (Franks et al. Citation2017). In spite of these big changes over the last 30 years the birds have maintained synchrony with their prey except in the warmest springs.
Although we have analysed the daily nest survival in both the incubation and chick rearing phases, with only 39 failures in 836 nests monitored, the rate of nest failure is very low and contributes little to the reduction in productivity. The main mechanism leading to decreased productivity is loss of young or eggs. The nest failures during laying and incubation were not related to any of the explanatory variables and, where the cause was known, was attributable to random events such as flooding or collapse of the nesting tree. On the other hand, the relationship between the nest survival during chick rearing and first egg date suggests that for late nests the loss of the whole brood to starvation linked to shortage of caterpillars is a likely mechanism.
Over the course of our study, levels of defoliation rose through a peak and then declined, showing a massive variation in abundance (a greater than 100-fold variation based on the frass peaks and 50-fold based on the leaf index scores). Defoliation of oak and other species by caterpillars is known to be subject to severe cyclic fluctuations (Wesołowski & Rowiński Citation2006) with 11 years as the suggested return period (Berryman Citation1996, Harding Citation2000, Hogstad Citation2005) based on the few long-term studies that have been reported. Our data are consistent with long term cyclic fluctuations, but our 16-year study was not sufficiently long to show a full cycle. The last period of heavy defoliation in these woods was between 1985 and 1988 (Smith pers. comm.) suggesting our cycle is probably about 20 years rather than 11. It is not known how these cycles correlate between woods and over what spatial scales. Our data show that the two woods closest together (Wormley and Hoddesdonpark Woods, 4 km apart) had defoliation peaks in the same years, with Sherrardspark Wood (13 km from the previous two) about three years later and Hitch Wood, another 10 km away, two years later still. The degree to which defoliation events are correlated over large spatial scales has the potential to have profound implications for the vital rates and large-scale population processes and buffering of woodland bird populations and deserves further study.
Over and above the cycles in defoliating caterpillar abundance little is known about long-term trends in overall populations of these defoliators. There is growing evidence that the populations of some of the larger moths are in serious decline in UK, particularly in southern England (Conrad et al. Citation2006, Fox et al. Citation2013) but most of the defoliators are not well covered by any monitoring schemes.
Our study is one of an increasing number to demonstrate the immense value of combining the monitoring of breeding success with measures of prey abundance and timing. With a few exceptions (for instance Zandt et al. Citation1990, Perrins Citation1991, Maziarz & Wesołowski Citation2010, Wesołowski & Rowiński Citation2014), relatively few studies have accomplished this largely because of the understanding and effort involved to set them up and run them. The oakwood/caterpillar/woodland breeding bird system is an ideal vehicle for these types of studies (Burgess et al. Citation2018). We have developed a simple and inexpensive means of frass collection but the sorting and weighing of the frass remains a time-consuming task. We have shown for the Hertfordshire woods that there is a close relationship between the timing of the frass peak and local temperature and this matches very well the results from a widescale deployment of frass trays through England, Wales and Scotland in 2010 (Smith et al. Citation2011) suggesting this could be applied on a larger scale. We have also demonstrated a good correlation between leaf damage and frass abundance. Clearly more work is needed with frass trays and leaf damage assessments to provide more calibrations across different spatial scales and to investigate different tree species but this has the makings of a good citizen science project for those enthusiastic enough to run it alongside their nest recording.
Acknowledgements
We thank the Woodland Trust, Welwyn Hatfield Council and Sir Simon Bowes-Lyon for permission to work in their woods. Chris James and Louise Neicho were always helpful and supportive. We thank the Lawes Agricultural Trust and Rothamsted Research for data from the e-RA database. The Rothamsted Long-term Experiments National Capability (LTE-NC) is supported by the UK BBSRC (Biotechnology and Biological Sciences Research Council, BBS/E/C/000J0300) and the Lawes Agricultural Trust. We thank Malcolm Burgess and referees for their helpful comments on earlier drafts of this paper.
References
- Berryman, A.A. 1996. What causes population cycles of forest lepidoptera? Trends Ecol. Evol. 11: 28–32. doi: 10.1016/0169-5347(96)81066-4
- Both, C. & Visser, M.E. 2001. Adjustment to climate change is constrained by arrival date in a long-distance migrant bird. Nature 411: 296–298. doi: 10.1038/35077063
- Both, C., Bouwhuis, S., Lessels, C.M. & Visser, M.E. 2006. Climate change and population declines in a long distance migratory bird. Nature 441: 81–83. doi: 10.1038/nature04539
- Both, C., van Ash, M., Bijlsma, R.G., van der Burg, A.B. & Visser, M.E. 2009. Climate change and unequal phenological changes across four trophic levels: constraints and adaptions? J. Anim. Ecol. 78: 73–83. doi: 10.1111/j.1365-2656.2008.01458.x
- Both, C. 2010. Food availability, mistiming and climatic change. In Møller, A.P., Fiedler, W. & Berthold, P. (eds) Effects of Climate Change on Birds, 129–147. Oxford University Press, Oxford, UK.
- Burgess, M.D., Smith, K.W., Evans, K.L., Leech, D., Pearce-Higgins, J.W., Branston, C.J., Briggs, K., Clark, J.R., du Feu, C.R., Lewthwaite, K., Nager, R.G., Sheldon, B.C., Smith, J.A., Whytock, R.C., Willis, S.G. & Phillimore, A.G. 2018. Tritrophic phenological match-mismatch in space and time. Nat. Ecol. Evol., DOI: 10.1038/s41559-018-0543-1.
- Charmantier, A., McCleery, R.H., Cole, L.R., Perrins, C., Kruuk, L.E.B. & Sheldon, B.C. 2008. Adaptive phenotypic plasticity in response to climate change in a wild bird population. Science 320: 800–803. doi: 10.1126/science.1157174
- Conrad, K.F., Warren, M.S., Fox, R., Parsons, M.S. & Woiwood, I.P. 2006. Rapid declines of common, widespread British moths provide evidence of an insect biodiversity crisis. Biol. Conserv. 132: 279–291. doi: 10.1016/j.biocon.2006.04.020
- Cramp, S. (ed) 1985. The Birds of the Western Palearctic, Vol. IV. Oxford University Press, Oxford.
- Crawley, M.J. & Akhteruzzaman, M. 1988. Individual variation in the phenology of oak trees and its consequences for herbivorous insects. Funct. Ecol. 2: 409–415. doi: 10.2307/2389414
- Crawley, M.J. 2007. The R Book. John Wiley & Sons, Chichester.
- Fox, R., Parsons, M.S., Chapman, J.W., Woiwood, I.P., Warren, M.S. & Brooks, D.R. 2013. The State of Britain’s Larger Moths 2013. Butterfly Conservation & Rothamsted Research, Wareham, Dorset.
- Franks, S.E., Pearce-Higgins, J.W., Atkinson, S., Bell, J.R., Botham, M.S., Brereton, T.M., Harrington, R. & Leech, D.I. 2017. The sensitivity of breeding songbirds to changes in seasonal timing is linked to population change but cannot be directly attributed to the effects of trophic asynchrony on productivity. Glb. Chg. Bio. DOI: 10.1111/gcb.13960.
- Glutz von Blotzheim, U.N. & Bauer, K.M. 1980. Handbuch der Vogel Mittleuropas, Vol 9. Akademische Verlagsgesellschaft, Wiesbaden.
- Gorman, G. 2004. Woodpeckers of Europe. Bruce Coleman, Chalfont St Peter.
- Hadow, H.H. 1976. Growth and development of nestling Downy Woodpeckers. North American Bird Bander 1: 155–164.
- Harding, D. 2000. Two decades of data on oak defoliation in a Worcestershire woodland NNR. In Kirby, K.J. & Morecroft, M.D. (eds) Long-term Studies in British Woodland, 87–97. English Nature Science 34, English Nature, Peterborough.
- Hogstad, O. 2005. Numerical and functional responses of breeding passerine species to mass occurrence of geometrid caterpillars in a subalpine birch forest: a 30-year study. Ibis 147: 77–91. doi: 10.1111/j.1474-919X.2004.00338.x
- Jackson, J.A. 1976. How to determine the status of a woodpecker nest. Living Bird 15: 205–221.
- Jenni, L. 1983. Habitatnutzung, Nahrungserwerb und Nahrung von Mittel- und Buntspecht (Dendrocopos medius und D. major) sowie Bemerkungen zur Verbreitungsgeschichte des Mittelspechts. Orn. Beob. 80: 29–57.
- Johnson, D.H. 1979. Estimating nesting success: the Mayfield method and an alternative. Auk 96: 651–661.
- Lack, D. 1950. The breeding seasons of European birds. Ibis 92: 288–316. doi: 10.1111/j.1474-919X.1950.tb01753.x
- Ligon, J.D. 1970. Behaviour and breeding biology of the Red-cockaded Woodpecker. Auk 87: 255–278. doi: 10.2307/4083919
- Mayfield, H. 1975. Suggestions for calculating nest success. Wilson Bull. 87: 456–466.
- Maziarz, M. & Wesołowski, T. 2010. Timing of breeding and nestling diet of Wood Warbler Phylloscopus sibilatrix in relation to changing food supply. Bird Study 57: 540–552. doi: 10.1080/00063657.2010.512954
- Minitab 16 Statistical Software. 2010. State College, PA: Minitab Inc. (www.minitab.com).
- Naef-Daenzer, B. & Keller, L.F. 1999. The foraging performance of Great and Blue Tits (Parus major and P. caeruleus) in relation to caterpillar development and its consequences for nestling growth and fledging weight. J. Anim. Ecol. 68: 708–718. doi: 10.1046/j.1365-2656.1999.00318.x
- Pearce-Higgins, J.W. & Green, R.E. 2014. Birds and Climate Change. Cambridge University Press, Cambridge, UK.
- Perrins, C.M. 1970. The timing of birds’ breeding seasons. Ibis 112: 242–255. doi: 10.1111/j.1474-919X.1970.tb00096.x
- Perrins, C.M. 1991. Tits and their caterpillar food supply. Ibis 133 (suppl.): 49–54.
- Perryman, S.A.M., Castells-Brooke, N.I.D., Glendining, M.J., Goulding, K.W.T., Hawkesford, M.J., Macdonald, A.J., Ostler, R.J., Poulton, P.R., Rawlings, C.J., Scott, T. & Verrier, P.J. 2018. The electronic Rothamsted Archive (e-RA), an online resource for data from the Rothamsted long-term experiments. Nature Sci. Data. 5: 180072. DOI: 10.1038/sdata.2018.72.
- R Development Core Team. 2015. R: A Language and Environment for Statistical Computing. R Foundation for Statistical Computing.
- Smith, K.W. 1997. Nest site selection of the Great Spotted Woodpecker Dendrocopos major in two oak woods in southern England and its implications for woodland management. Biol. Conserv. 80: 283–288. doi: 10.1016/S0006-3207(96)00038-9
- Smith, K.W. 2005. Has the reduction in nest-site competition from Starlings Sturnus vulgaris been a factor in the recent increase of Great Spotted Woodpecker Dendrocopos major numbers in Britain? Bird Study 52: 307–313. doi: 10.1080/00063650509461404
- Smith, K.W. 2006. The implications of nest site competition from starlings Sturnus vulgaris and the effect of spring temperatures on the timing and breeding performance of Great Spotted Woodpeckers Dendrocopos major in southern England. Ann. Zool. Fennici 43: 177–185.
- Smith, K.W. 2007. The utilization of dead wood resources by woodpeckers in Britain. Ibis 149 (s2): 183–192. doi: 10.1111/j.1474-919X.2007.00738.x
- Smith, K.W., Smith, L., Charman, E., Briggs, K., Burgess, M., Dennis, C., Harding, M., Isherwood, C., Isherwood, I. & Mallord, J. 2011. Large-scale variation in the temporal patterns of the frass fall of defoliating caterpillars in oak woodlands in Britain: implications for nesting woodland birds. Bird Study 58: 506–511. doi: 10.1080/00063657.2011.616186
- Smith, K.W. & Charman, E.C. 2012. The ecology and conservation of the Lesser Spotted Woodpecker. Br. Birds 105: 294–307.
- Smith, K.W. & Smith, L. 2013. The effect of supplementary feeding in early spring on the breeding performance of the Great Spotted Woodpecker Dendrocopos major. Bird Study 60: 169–175. doi: 10.1080/00063657.2013.776004
- Southwood, T.R.E., Moran, V.C. & Kennedy, C.E.J. 1982. The richness, abundance and biomass of arthropod communities on trees. Jour. of Anim. Ecol. 51: 635–649. doi: 10.2307/3988
- Török, J. 1990. Resource partitioning among three woodpecker species Dendrocopos spp. during the breeding season. Hol. Ecol. 13: 257–264.
- Veen, T., Sheldon, B.C., Weissing, F.J., Visser, M.E., Qvarnström, A. & Sætre, G.-P. 2010. Temporal differences in food abundance promote coexistence between two congeneric passerines. Oecologia 162: 873–884. doi: 10.1007/s00442-009-1544-1
- Visser, M.E., Holleman, L.J.M. & Gienapp, P. 2006. Shifts in caterpillar biomass phenology due to climate change and its impact on the breeding biology of an insectivorous bird. Oecologia 147: 164–172. doi: 10.1007/s00442-005-0299-6
- Wesołowski, T. & Rowiński, P. 2006. Tree defoliation by winter moth Operophtera brumata during an outbreak affected by structure of forest landscape. Forest Ecol. Manag. 221: 299–305. doi: 10.1016/j.foreco.2005.10.023
- Wesołowski, T. & Rowiński, P. 2014. Do Blue Tits Cyanistes caeruleus synchronize reproduction with caterpillar peaks in a primeval forest? Bird Study 61: 231–245. doi: 10.1080/00063657.2014.899307
- Zandt, H.S., Strijkstra, A.M., Blonde, J. & van Balen, J.H. 1990. Two Mediterranean Blue Tit populations: are differences in the timing of breeding associated with caterpillar availability? In J. Blondel. (ed) Population Biology of Passerine Birds, 145–155. Springer–Verlag, Berlin.