
ABSTRACT
Within heterogeneous arable habitats close to urbanized Vienna, Austria, Eurasian Skylarks Alauda arvensis occurred at slightly lower densities than in other mixed farmland areas and at a much lower density than would be found in natural habitats. Territory density was negatively correlated with the occurrence of roads, tracks and high-intensity agricultural cultivation, possibly due to the resulting increased disturbance by humans.
Agricultural intensification is considered to be the main driver for the ongoing decline of many farmland bird species across Europe (Donald et al. Citation2001a, Citation2006, Wilson et al. Citation1997). Several factors cause this decline at the field and landscape scale, such as the switch from spring sown to autumn sown cereals (Morris et al. Citation2004, Eggers et al. Citation2011), increased field size and reduced crop diversity (Robinson & Sutherland Citation2002), as well as the increased use of pesticides and loss of habitat heterogeneity (Benton et al. Citation2003, Newton Citation2004, Brodier et al. Citation2014, Emmerson et al. Citation2016). The Eurasian Skylark Alauda arvensis (hereafter Skylark) is a common farmland bird species and a representative for this negative trend. It is one of the best-adapted European bird species to wide and open agricultural landscapes and still the most abundant one, but like many other farmland bird species it has suffered from a drastic decline of more than 50% in many areas during the last few decades (Donald et al. Citation2001a, Donald Citation2004, Schmidt et al. Citation2017). Within the European Union this species decreased by 54% from 1980 to 2015 and by 16% from 2006 to 2015 (EBCC Citation2018), with declines on the population level of up to 95% (Hayhow et al. Citation2015).
Increasing urbanization worldwide has another strong impact on the change in abundance of many bird species, leading to fragmentation and degradation of natural habitats (Alberti Citation2005, McKinney Citation2006). This concerns not only the extreme urban environments such as city centres, but also surrounding developments such as nearby settlements and roads around large urban areas (Benítez-López et al. Citation2010).
In this study, we focused on the distribution of Skylarks on the edge of their suitable habitat, namely farmland surrounding a metropolitan area near Vienna, with a high density of roads and relatively small-sized fields which provided small-scale heterogeneity. Similar to the wider European trend, Skylarks decreased by 47% from 1998 to 2016 in Austria (Teufelbauer et al. Citation2017). While many studies have investigated populations and habitat preferences of Skylarks in typical open agricultural landscapes (Donald Citation2004), such datasets in the vicinity of urban areas are scarce, but see Filippi-Codaccioni et al. (Citation2008), who showed a negative effect of urbanization on the abundance of many farmland bird species. Our aim was to assess Skylark occurrence in relation to urbanization, habitat heterogeneity and type of cultivation.
The study area was located in Austria adjacent to the city of Vienna (). Except for the landscape west of Vienna, which was covered by wooded hills (Wienerwald Biosphere Reserve), the area especially to the north and east of Vienna is mostly used for intensive agriculture. Following a method described by Hoffmann et al. (Citation2013), we selected 12 sampling plots of 1 km2 and added a zone of 100 m around every plot, resulting in 1.43 km2 each.
Figure 1. Map of the study area in close vicinity to the city of Vienna (CORINE Citation2012). All 12 sampling plots were located within agricultural areas.
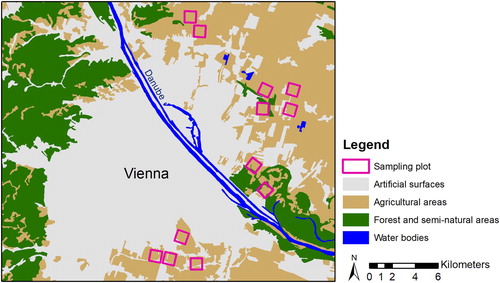
The actual locations of these sampling plots were intended to be as close as possible to the urban area while avoiding unsuitable habitat within the plot, such as settlements, streets, parking areas or lakes. Due to its proximity to the metropolitan area of Vienna, with its 2.8 million inhabitants, the study area was frequently visited by people and was highly fragmented by roads, railways or settlements. The average total field size per agricultural holding was 13.9 ha, which is smaller than the average of 18.8 ha in Austria (Statistik Austria Citation2016). Consequently, the average field size in our sampling plots was relatively small (sometimes less than 0.5 ha); the largest field within a sampling plot was 22.8 ha. In this area the mean annual temperature was 10.3°C, with a mean annual precipitation of 516 mm (Groß-Enzersdorf, ZAMG Citation2017).
Between 1 April 2017 and 15 July 2017 each plot was surveyed seven times by one of two field observers in a two-week interval. Fieldwork was carried out within the first four hours after sunrise and only during good weather conditions (no rainfall, fog or strong winds). The observers walked systematically through the plot at a steady, slow pace and recorded the location of singing males on a map following a standardized method (Südbeck et al. Citation2005) and assuming that detection probability did not differ between habitat types. For the habitat classification every sampling plot was divided beforehand into fields with a unique code (field ID) and the habitat type was recorded for every field during each survey (online Table S1). We used the following seven categories for arable fields: ‘cereals’, ‘maize’, ‘rapeseed’, ‘legum’ (crops for green manuring, mostly leguminosae), ‘cultivated 1’ (other crops with low cultivation effort e.g. buckwheat, millet, mustard), ‘cultivated 2’ (other crops with intermediate cultivation effort e.g. pumpkins, beets, potatoes), ‘cultivated 3’ (other crops with very high cultivation effort e.g. strawberries, broccoli, vine). Classification according to the cultivation effort was based on the use of pesticides and/or the number of cultivation steps (considered as major disturbance) typical for each crop and was made in accordance with an expert for crop sciences (pers. Comm., B. Mehdi 2018, University of Natural Resources and Life Sciences). The remaining area in the plots was classified as ‘grass’ (extensive grassland, set-aside), ‘woody area’ (woodland and shrubs, which were typically dense and more than 2 m high), ‘bare ground’ and ‘urbanised area’. The latter category combined structures which typically increase with proximity to cities such as paved and unpaved roads, railways, parking lots, settlements and industrial areas. We excluded lakes and an area for gravel mining from the survey and analysis. Especially in the first survey in April there was a large proportion of bare ground, which was highly correlated with the proportion of cereals (on most of the bare ground cereals started growing during the second or third survey). To avoid the existing correlation between cereals and bare ground, the latter was also not included in the models. Data on territories of male Skylarks and habitat categories were transferred to QGIS 2.18.1 (QGIS Development Team Citation2016). To minimize bias in data collection, both field observers were trained to map territorial Skylarks and classify habitat categories before starting the surveys.
Around each observation of a territorial Skylark (n = 1325 presence points) we created a buffer circle of 100 m radius, giving an area of 3.1 ha. This radius was selected based on the range of different territory sizes reported in the literature (Eraud & Boutin Citation2002, Donald Citation2004). For each survey, we counted the number of Skylark observations (presence points) and created the same number of ‘absence points’ by randomly distributing them within the 1 km2 core of each plot while avoiding intersection with buffer circles of Skylark observations. We also added buffer circles to the absence points and determined the proportion of each habitat category within all buffer circles (presence and absence points, online Table S2). To take into account additional measures for urbanization we calculated for each presence and absence point the distance to the nearest paved road, the distance to the nearest unpaved track and the distance to the nearest building. These data were extracted from OpenStreetMap (OpenStreetMap Citation2018).
All statistical analyses were conducted with R version 3.4.2 (R Core Team Citation2018). Spatial data were imported from shapefiles and prepared for the subsequent analysis (package sf, Pebesma Citation2018). We created species distribution models (Generalized linear mixed models, family = binomial, package lme4, Bates et al. Citation2015) to predict the occurrence of Skylarks based on urbanization, habitat (type of cultivation) and time of breeding season. To include the information on habitat heterogeneity within each buffer circle as fixed factor, we calculated Shannon diversity indices of all habitat categories for each buffer circle around every presence and absence point. We used the plot ID as a random factor to account for repeated measurements and the nine habitat categories as fixed factors (cereals, maize, rapeseed, legume, cultivated 1, cultivated 2, cultivated 3, grass, woody area and urbanized area) as well as the three distance measurements to the nearest road, track and building, respectively. Another fixed factor was the Julian date (where 1 = 1 January) of each survey. We also calculated the orthogonal polynomials of Julian date until the fourth degree, to take into account potentially non-linear relationships between presence–absence and date of the breeding season. To avoid overfitting through the polynomials we repeatedly calculated the full model with increasing degree of polynomials and continued the analysis with the Julian date only, since it led to the lowest second order form of Akaike's Information Criterion, AICc (Hurvich & Tsai Citation1989). All models displayed spatial autocorrelation, thus we added a spatial autocovariate based on the coordinates of every presence and absence point (distance-weighted autocovariate, package spdep, Bivand & Piras Citation2015) resulting in a Moran's I lower than 0.2 (Fortin & Dale Citation2005). There was no multicollinearity present (variance inflation factor, VIF <2 for all predictor variables) and the data were not overdispersed. We z-transformed all predictor variables to improve the interpretability of the regression coefficients and the comparison with other studies (Schielzeth Citation2010) and visually inspected the distribution of the residuals of the full model. For model selection, we followed an information theoretic approach (Burnham & Anderson Citation2002) and created a set of candidate models with all possible predictor combinations from the respective full model. We ranked these models according to their AICc, selected the subset of models with ΔAICc ≤ 6 (Harrison et al. Citation2018) with respect to the best model and calculated model-averaged coefficients (package MuMIn, Bartoń Citation2017). To assess model goodness of fit we calculated the area under the receiver operating characteristic curve (AUC, package pROC, Robin et al. Citation2011) based on the averaged coefficients, which was classified as excellent with 0.93 (95% confidence intervals: 0.92–0.94).
A total of 1325 Skylark territorial displays were observed, giving a mean (± sd) of 189.3 ± 23.1 individuals per survey on the 12 study plots. One plot, which was surrounded by forest, was excluded from the analysis as no Skylark territories were detected within it. The mean (±sd) Skylark density was 17.2 ± 11.5 males per km2, and ranged from 1 to 43. The mean percentage cover for habitat categories is shown in Table S1 for every study plot and each survey. The mean number of habitat categories within 100 m of presence points was 2.6 (range 1–7). On average, Skylarks kept a distance of 122.8 m (range 4.5–378.4 m) to the nearest unpaved track, 288.5 m (range 10.6–828.0 m) to the nearest paved road and 362.1 m (range 31.3–961.2 m) to the nearest building.
The estimates of the model averaged coefficients for all four variables related to the degree of urbanization had a high relative importance and strong negative effect on the presence of Skylarks. Fewer Skylarks were observed later in the season. Cereals and crops for green manuring (legum) had the highest positive effect size on Skylark presence and highest relative importance (). Extensive grassland (grass), rapeseed and maize also had a positive effect on the presence of Skylarks, but their relative importance and effect size was low. The strongest negative habitat predictors of Skylark presence were woody area and crops with the highest cultivation effort (cultivated 3). Crops with lower and intermediate cultivation (cultivated 1 and 2) as well as diverse farmland (high Shannon's diversity index based on habitat categories) also had a negative effect, but again with low relative importance and small effect sizes.
Table 1. Effects of z-transformed predictor variables on the occurrence of territorial Skylarks based on 100 m buffer circles around each presence/absence point. Non-back-transformed model-averaged coefficients (full-model averaging) with adjusted standard errors (se) and relative importance (RI) of the best models (93 out of 32768 models within ΔAICc < 6) are shown.
Our study revealed that variables related to urbanization had strong negative effects on the occurrence of Skylarks and a higher relative importance than most variables related to type of cultivation and habitat heterogeneity. Skylarks clearly avoided the proximity of structures related to urbanization: paved roads, built-up areas and even unpaved tracks showed a negative effect on Skylark presence. Interestingly, other studies found that arable field margins, which are often adjacent to unpaved tracks, are preferred foraging grounds for Skylarks (Kuiper et al. Citation2013) and also tramlines can have a positive effect on Skylark territory densities (Schmidt et al. Citation2017). However, in proximity to settlements and to the large urban area at our study site, unpaved tracks probably lead to increased disturbance due to recreational activities, which in turn can affect wildlife populations (Miller et al. Citation1998, Steven et al. Citation2011). Activities such as walking with dogs or running can influence vigilance, flight behaviour and stress levels of birds (Miller et al. Citation2001, Randler Citation2006, Lethlean et al. Citation2017). Thus, we suggest that close to urban areas Skylarks would benefit from less habitat fragmentation through roads or tracks and reduced urban sprawl. Filippi-Codaccioni et al. (Citation2008) showed a decreased abundance with urbanization for different species of farmland birds, with the largest impact when areas change from 0% to 25% of urbanization, which roughly reflects the proportion of urbanized area in our study plots (range 2–14.6%, Table S1). The average density of Skylark territories (17.2 per km2) was slightly lower in the study area than the average of other studies, with 22.8 for mixed farmland (ranging from 9 to 58) compared to 40.0 for natural grassland and 55.8 for heath and steppe (Donald Citation2004).
The model estimates for the habitat categories (Table 1) mostly reflect typical results from previous studies (Donald Citation2004): cereals and crops for green manuring had a strong positive effect on Skylark occurrence, while woody area clearly decreased the probability of occurrence as the species prefers open habitats. Crops with the highest cultivation effort also had a strong negative effect, most likely due to the frequent disturbance during cultivation and the intensive use of pesticides (Donald Citation2004). While other studies found temporal effects reflecting territory establishment in March, abandonment in July and a peak in between (Donald et al. Citation2001b), we could only measure a decrease of territorial activity. Since our data collection started in April, the first survey was probably already close to the peak of activity. The remaining habitat categories were all of much lower relative importance with smaller effect sizes and large standard errors. Extensive grassland, rapeseed and maize had a slight positive effect, crops with lower and intermediate cultivation showed a slight negative effect, but of only marginal importance compared to the intercept and the effects of other variables. Interestingly, habitat heterogeneity also showed a small negative effect on Skylark presence; we found on average 2.6 different crop types within the 100 m buffer circles, which is rarely the case in intensively used farmland with large fields. We regard this result with caution given the limited sample size, however, it is also possible that the number of different crops had already reached an optimum and more crops could lead to negative effects through an association with fragmentation due to roads. Further studies within comparable heterogeneous habitat are needed to clarify this aspect.
Overall, our results show that the density of Skylarks close to the urban area of Vienna was slightly lower than in other mixed farmland areas, but it was far below natural habitats (Donald Citation2004). To mitigate negative effects it is important to reduce the habitat fragmentation that comes with urban sprawl and increasing road density, and decrease cultivation of crops with high cultivation effort.
Supplemental Material
Download MS Word (16.4 KB)Acknowledgements
We are grateful to Manuel Polo Aparisi and Patrick Moser for help with fieldwork. Further, we thank two anonymous reviewers for their helpful comments on the original draft of the manuscript.
Correction Statement
This article has been republished with minor changes. These changes do not impact the academic content of the article.
ORCID
Matthias-Claudio Loretto http://orcid.org/0000-0002-1940-3470
Eva Maria Schöll http://orcid.org/0000-0003-3096-5885
Sabine Hille http://orcid.org/0000-0002-3680-7549
Additional information
Funding
Related Research Data
References
- Alberti, M. 2005. The effects of urban patterns on ecosystem function. Int. Reg. Sci. Rev. 28: 168–192. doi: 10.1177/0160017605275160
- Bartoń, K. 2017. MuMIn: Multi-model inference. Version 1.40.0. - Available at: http://CRAN.R-project.org/package=MuMIn.
- Bates, D., Maechler, M., Bolker, B. M. & Walker, S. 2015. Fitting linear mixed-effects models using lme4. J. Stat. Softw. 67: 1–48. doi: 10.18637/jss.v067.i01
- Benítez-López, A., Alkemade, R. & Verweij, P.A. 2010. The impacts of roads and other infrastructure on mammal and bird populations: a meta-analysis. Biol. Conserv. 143: 1307–1316. doi: 10.1016/j.biocon.2010.02.009
- Benton, T.G., Vickery, J.A. & Wilson, J.D. 2003. Farmland biodiversity: is habitat heterogeneity the key? Trends Ecol. Evol. 18: 182–188. doi: 10.1016/S0169-5347(03)00011-9
- Bivand, R. & Piras, G. 2015. Comparing implementations of estimation methods for spatial econometrics. J. Stat. Softw. 63: 1–36.
- Brodier, S., Augiron, S., Cornulier, T. & Bretagnolle, V. 2014. Local improvement of skylark and corn bunting population trends on intensive arable landscape: a case study of the conservation tool Natura 2000. Anim. Conserv. 17: 204–216. doi: 10.1111/acv.12077
- Burnham, K.P. & Anderson, D.R. 2002. Model Selection and Multimodel Inference: A Practical Information-Theoretic Approach. Springer, New York.
- CORINE Land Cover Classification. 2012. Umweltbundesamt GmbH, data.umweltbundesamt.at.
- Donald, P.F. 2004. The Skylark. T & AD Poyser.
- Donald, P.F., Green, R.E. & Heath, M.F. 2001a. Agricultural intensification and the collapse of Europe’s farmland bird populations. Proc. Biol. Sci. 268: 25–29. doi: 10.1098/rspb.2000.1325
- Donald, P.F., Evans, A.D., Buckingham, D.L., Muirhead, L.B. & Wilson, J.D. 2001b. Factors affecting the territory distribution of skylarks Alauda arvensis breeding on lowland farmland. Bird Study 48: 271–278. doi: 10.1080/00063650109461227
- Donald, P.F., Sanderson, F.J., Burfield, I.J. & van Bommel, F.P.J. 2006. Further evidence of continent-wide impacts of agricultural intensification on European farmland birds, 1990–2000. Agric. Ecosyst. Environ. 116: 189–196. doi: 10.1016/j.agee.2006.02.007
- EBCC [European Bird Census Council]. 2018. Trends of Common Birds in Europe, 2017 update. Available from: https://www.ebcc.info/trends-of-common-birds-in-europe-2017-update/ [accessed 18.07.2018].
- Eggers, S., Unell, M. & Pärt, T. 2011. Autumn-sowing of cereals reduces breeding bird numbers in a heterogeneous agricultural landscape. Biol. Conserv. 144: 1137–1144. doi: 10.1016/j.biocon.2010.12.033
- Emmerson, M., Morales, M.B., Oñate, J.J., Batáry, P., Berendse, F., Liira, J., Aavik, T., Guerrero, I., Bommarco, R., Eggers, S., Pärt, T., Tscharntke, T., Weisser, W., Clement, L. & Bengtsson, J. 2016. How agricultural intensification affects biodiversity and ecosystem services. Adv. Ecol. Res. 55: 43–97. doi: 10.1016/bs.aecr.2016.08.005
- Eraud, C. & Boutin, J.-M. 2002. Density and productivity of breeding Skylarks Alauda arvensis in relation to crop type on agricultural lands in western France. Bird Study 49: 287–296. doi: 10.1080/00063650209461277
- Filippi-Codaccioni, O., Devictor, V., Clobert, J. & Julliard, R. 2008. Effects of age and intensity of urbanization on farmland bird communities. Biol. Conserv. 141: 2698–2707. doi: 10.1016/j.biocon.2008.08.006
- Fortin, M.-J. & Dale, M. 2005. Spatial Analysis: A Guide for Ecologists. Cambridge University Press, Cambridge.
- Harrison, X.A., Donaldson, L., Correa-Cano, M.E., Evans, J., Fisher, D.N., Goodwin, C.E.D., Robinson, B.S., Hodgson, D.J. & Inger, R. 2018. A brief introduction to mixed effects modelling and multi-model inference in ecology. PeerJ. 6: e4794. doi: 10.7717/peerj.4794
- Hayhow, D.B., Bond, A.L., Eaton, M.A., Grice, P.V., Hall, C., Hall, J., Harris, S.J., Hearn, R.D., Holt, C.A., Noble, D.G., Stroud, D.A. & Wotton, S. 2015. The State of the UK’s Birds 2015. RSPB, BTO, WWT, JNCC, NE, NIEA, NRW and SNH, Bedfordshire.
- Hoffmann, J., Wittchen, U., Stachow, U. & Berger, G. 2013. Identification of habitat requirements of farmland birds based on a hierarchical structured monitoring scheme. Chin. Birds 4: 265–280. doi: 10.5122/cbirds.2013.0026
- Hurvich, C.M. & Tsai, C.-L. 1989. Regression and time series model selection in small samples. Biometrika 76: 297–307. doi: 10.1093/biomet/76.2.297
- Kuiper, M.W., Ottens, H.J., Cenin, L., Schaffers, A.P., van Ruijven, J., Koks, B.J., Berendse, F. & de Snoo, G.R. 2013. Field margins as foraging habitat for skylarks (Alauda arvensis) in the breeding season. Agric. Ecosyst. Environ. 170: 10–15. doi: 10.1016/j.agee.2013.03.001
- Lethlean, H., Van Dongen, W.F.D., Kostoglou, K., Guay, P.J. & Weston, M.A. 2017. Joggers cause greater avian disturbance than walkers. Landsc. Urban Plan 159: 42–47. doi: 10.1016/j.landurbplan.2016.08.020
- McKinney, M. L. 2006. Urbanization as a major cause of biotic homogenization. Biol. Conserv. 127: 247–260. doi: 10.1016/j.biocon.2005.09.005
- Morris, A.J., Holland, J.M., Smith, B. & Jones, N.E. 2004. Sustainable arable Farming for an improved environment (SAFFIE): managing winter wheat sward structure for Skylarks Alauda arvensis. Ibis 146: 155–162. doi: 10.1111/j.1474-919X.2004.00361.x
- Miller, S.G., Knight, R.L. & Miller, C.K. 1998. Influence of recreational trails on breeding bird communities. Ecol. Appl. 8: 162–169. doi: 10.1890/1051-0761(1998)008[0162:IORTOB]2.0.CO;2
- Miller, S.G., Knight, R.L. & Miller, C.K. 2001. Wildlife responses to pedestrians and dogs. Wildl. Soc. Bull. 29: 124–132.
- Newton, I. 2004. The recent declines of farmland bird populations in Britain: an appraisal of causal factors and conservation actions. Ibis 146: 579–600. doi: 10.1111/j.1474-919X.2004.00375.x
- OpenStreetMap. 2018. Open Database License ‘ODbL’ 1.0. www.openstreetmap.org. accessed 13th Jan 2019 via Geofabrik GmbH: http://download.geofabrik.de/europe/austria-latest-free.shp.zip.
- Pebesma, E. 2018. Simple Features for R: Standardized Support for Spatial Vector Data. R package version 0.6-3. https://CRAN.R-project.org/package=sf.
- QGIS Development Team. 2016. QGIS Geographic Infromation System. Open Source Geospatial Foundation Project: http://qgis.osgeo.org.
- R Core Team. 2018. R: A Language and Environment for Statistical Computing. R Foundation for Statistical Computing, Vienna. https://www.Rproject.org/.
- Randler, C. 2006. Disturbances by dog barking increase vigilance in coots Fulica atra. Eur. J. Wildl. Res. 52: 265–270. doi: 10.1007/s10344-006-0049-z
- Robin, X., Turck, N., Hainard, A., Tiberti, N., Lisacek, F., Sanchez, J.-C. & Müller, M. 2011. pROC: an open-source package for R and S+ to analyze and compare ROC curves. BMC Bioinform. 12: 77. doi: 10.1186/1471-2105-12-77
- Robinson, R.A. & Sutherland, W.J. 2002. Post-war changes in arable farming and biodiversity in Great Britain. J. Appl. Ecol. 39: 157–176. doi: 10.1046/j.1365-2664.2002.00695.x
- Schielzeth, H. 2010. Simple means to improve the interpretability of regression coefficients. Methods Ecol. Evol. 1: 103–113. doi: 10.1111/j.2041-210X.2010.00012.x
- Schmidt, J.-U., Eilers, A., Schimkat, M., Krause-Heiber, J., Timm, A., Nachtigall, W. & Kleber, A. 2017. Effect of Sky Lark plots and additional tramlines on territory densities of the Sky Lark Alauda arvensis in an intensively managed agricultural landscape. Bird Study 64: 1–11. doi: 10.1080/00063657.2016.1271394
- Statistik Austria. 2016. http://www.statistik.at.
- Steven, R., Pickering, C. & Guy Castley, J. 2011. A review of the impacts of nature based recreation on birds. J. Environ. Manage. 92: 2287–2294. doi: 10.1016/j.jenvman.2011.05.005
- Südbeck, P., Andretzke, H., Fischer, S., Gedeon, K., Schikore, T., Schröder, K. & Sudfeldt, C. 2005. Methodenstandards zur Erfassung der Brutvögel Deutschlands. - Dachverband Deutscher Avifaunisten.
- Teufelbauer, N., Seaman, B.S. & Dvorak, M. 2017. Population changes of common Austrian breeding birds in the period 1998-2016-results of the breeding bird monitoring scheme. Egretta 55: 43–76.
- Wilson, J.D., Evans, J., Browne, S.J. & King, J.R. 1997. Territory distribution and breeding success of skylarks Alauda arvensis on organic and intensive farmland in southern England. J. Appl. Ecol. 34: 1462–1478. doi: 10.2307/2405262
- ZAMG, Zentralanstalt für Meteorologie und Geodynamik. 2017. Groß-Enzersdorf, https://www.zamg.ac.at/cms/de/klima/informationsportal-klimawandel/daten-download/klimamittel, accessed on 10th July 2018.