
 ?Mathematical formulae have been encoded as MathML and are displayed in this HTML version using MathJax in order to improve their display. Uncheck the box to turn MathJax off. This feature requires Javascript. Click on a formula to zoom.
ABSTRACT
Capsule: Distance sampling identified an increase in estimated population size of Common Buzzards Buteo buteo in central southern England between 2011 and 2016 of more than 50%. The rate of population growth slowed in later years.
Aims: To assess the utility of a targeted distance sampling protocol to derive seasonal and annual population estimates for Common Buzzards across an area of southern England.
Methods: We used a line transect survey methodology and multiple covariate distance sampling to assess population density and abundance of Common Buzzards in spring and autumn between 2011 and 2016 across a 2600 km2 area of central southern England.
Results: Estimated population size increased by more than 50%, from approximately 2900 to 4500 individuals, across the period in a trend similar to that shown by Breeding Bird Survey data.
Discussion: A slowing of the growth in population size of Common Buzzards in central southern England suggests that the species may be approaching carrying capacity in this area. These results also suggest that currently employed broad scale survey methodologies adequately reflect the general population trends for this species. Our data provide the first published estimates of the Common Buzzard population in central southern England derived from direct empirical assessment.
Identifying the population size of a species is a key step in developing and implementing an effective conservation strategy (Soulé Citation1987, Frankham Citation1995). Unfortunately, determining population size can be difficult and expensive. Difficulties can arise, for example, due to particular behaviours of the study species (e.g. mobility, shyness, crypsis, nocturnality), scarcity or its occupancy of habitats where access or movement is difficult (Anderson et al. Citation2015). Also, the spatial scale required to produce meaningful estimates influences survey effort, the level of sampling and cost. To improve efficiency in data collection many broad-scale studies use multi-species surveys or monitoring programmes using volunteer fieldworkers (Riseley et al. Citation2008, Jiguet Citation2009). There are consequences to these approaches, however, and analyses must consider the effects of surveying for more than one species at a time. For example, there may be reduced effort per species, heterogeneity in species detectability (Johnston et al. Citation2014), potential difficulties generating sufficient observations of rarer species (but see Sanderlin et al. Citation2014) and the variation in skills and intrinsic differences between volunteer observers (e.g. in hearing, visual acuity, level of concentration, stamina, image-processing, tiredness; Link et al. Citation1994, Peterjohn et al. Citation1995, Jiguet Citation2009, Eglington et al. Citation2010).
Species abundance and density estimates are now often generated using a distance sampling methodology. This technique uses the recorded distances of objects of interest to randomly-placed survey routes or points to estimate animal density or abundance (Buckland et al. Citation2001). A key assumption of this method is that all objects at zero distance are detected and that probability of detection decreases with increasing distance from the route or point. Accurate measurement of these distances is also assumed, however, it is often necessary to simplify survey methods (e.g. by using a small number of distance bands rather than accurate measurement) to encourage participation and adherence to protocols (Newson et al. Citation2008, Quesada et al. Citation2010). There is a trade-off between the quality of the estimate and simplicity of the method (Rabe et al. Citation2002) and simplification will result in detection functions that are less robust (Johnston et al. Citation2014), reduces estimated detectability (Stanbury & Gregory Citation2009) and decreases the precision of derived estimates (Stanbury & Gregory Citation2009, Ekblom Citation2010).
Estimates of population size for bird species in the UK tend to focus on breeding populations. These estimates are usually derived from indices of relative abundance generated as part of the Breeding Bird Survey (BBS) (Newson et al. Citation2008, Riseley et al. Citation2008, Musgrove et al. Citation2013). Although useful for many species, the use of the breeding pair as the unit of interest is less appropriate for certain species and could underestimate population size (Newson et al. Citation2008). This is particularly true for many raptor species where individuals do not breed until into their third year (Davis & Davis Citation1992) and where a significant proportion of the adult population is not breeding in any one year (Hunt Citation1998, Kenward et al. Citation1999, Citation2001), as is the case with the Common Buzzard (Buteo buteo, hereafter ‘Buzzard’). Accurate estimation of population size is therefore necessary if the aim of monitoring is to provide an objective assessment of population trends – particularly where species may be increasing or decreasing. Using methods suitable for certain species groups to produce population estimates may then provide a means of periodically validating or calibrating indices that are applied more widely.
The Buzzard was lost from many parts of its range in Britain due to the combined effects of widespread persecution in the nineteenth century, a crash in preferred prey populations (Rabbit, Oryctolagus cuniculus) in the 1950s and the effects of organochlorine pesticides in the 1960s and 1970s (Sim et al. Citation2000). Until the 1980s Buzzards in Britain were confined to Scotland, Wales and western England. Since then, the enactment of improved wildlife conservation legislation (e.g. banning of organochlorine pesticides and comprehensive legal protection) and increasing public awareness have led to a significant increase in the species’ population size and range. Most recent assessments indicate that the species has now recolonized many of the areas of the UK from which it had been lost (Clements Citation2002, Musgrove et al. Citation2013).
The primary objective of this study was to use a distance sampling method to produce local and regional population estimates of Buzzards in central southern England. We also draw comparisons with population estimates derived using other methods and discuss the utility of our approach for determining population sizes of Buzzards and other conspicuous diurnal raptor species on a larger scale.
Methods
Study area and fieldwork
The study was conducted between September 2011 and June 2016 across two areas (designated ‘East’ and ‘West’) covering approximately 2600 km2 of central southern England in Hampshire, Wiltshire, Surrey and West Sussex (centred on 1° 18′W and 51° 13′N, ). Land use within the study area was primarily mixed farming (arable and grassland) with scattered small woodlands; although the extent of woodland was higher in the East (26687 ha) than West (17634 ha). The study area contained ten urban areas of which five had human populations exceeding 40000 (Nomis Citation2016).
Figure 1. Study area in central southern England showing randomised locations of the Idealised Transect Routes (ITRs) for the first survey of Common Buzzards Buteo buteo in autumn 2011. Shading represents urban areas.
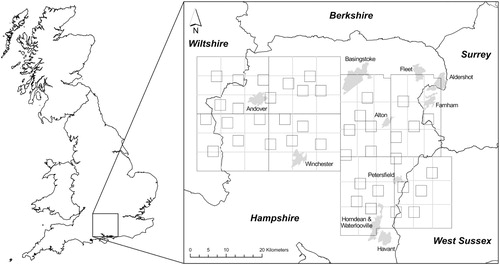
We used a line transect combined with distance sampling method (Buckland et al. Citation2001, Citation2004) to determine the population size and density of Buzzards. Each transect was a circuit based on a square with each side measuring 3 km. Even coverage of the study area was achieved by dividing the East and West sections into 24 smaller blocks and using a random number generator to identify a grid reference and start point for transects within each of these blocks. An idealized transect route (ITR) at this location was then identified using a 3 km × 3 km square overlay. Negotiating access across such a large area of private land was impractical and so transects made use of public rights of way and open access land, the ITR serving as a point of spatial reference to facilitate the identification of a circuit of appropriate length through the selected area. Transects followed the ITR as closely as possible. Where deviations were necessary, alternative routes prioritized open access land and other rights of way types before roads in an effort to reduce bias associated with following obvious linear landscape features (surfaced roads, field edges, fences and hedgerows; Ortega & Capen Citation2002, Marques et al. Citation2010). Edge effects were minimized by including all randomized start locations even when these resulted in the transect breaching the study area boundary. In these cases, only the lengths of transect within the study area were included in analyses.
Surveys were performed in ten transect periods, two each year, between Sep–Dec (‘autumn’) 2011 and Feb–May (‘spring’) 2016. Two seasonal transect periods were used to enable assessment of expected fluctuations in density associated with post-breeding abundance and overwinter mortality. Transects started between 08.30 and 10.00 from a randomized start point and took 3–7 h to complete. The direction (anti- or clockwise) of travel was also randomized. Each transect was performed by one of two fieldworkers (MS or RH). Transects were walked only on days with no rain, good visibility and when wind strength was no greater than Beaufort force four.
All birds observed during the walked transects were recorded. When groups of birds were encountered, the number of individuals was noted. For each observation, observer location was recorded using Garmin 60 Csx global positioning system (GPS) handheld units and horizontal distance and bearing to each bird (or to the centre point of groups; Buckland et al. Citation2001) from the observer using Swarovski Laser Guide 8 × 30 or Nikon Forester 550 laser rangefinders and Silva compasses. Where a bird in flight had obviously been disturbed from a perch by the fieldworker just prior to detection, measurement of distance was taken from the fieldworker location to the original perch. Bird behaviour, situation (i.e. flying, perched or on the ground), habitat, time of observation and weather conditions were also recorded for each observation. To minimize double-counting, fieldworkers noted, where possible, the plumage morph of all birds (following Glutz von Blotzheim et al. Citation1971), specific aspects of plumage (e.g. bright tail, prominent breast patches etc.) and location of obvious moult in remiges or rectrices. Where there was still uncertainty regarding the status of an individual, the observer noted their confidence in the observation being new on a percentage scale where ‘0’ indicated a certainty that the individual had already been recorded, and ‘100’ where it had not. Bird movement and relative timings and location of previous observations were used to inform this assessment. This enabled later exclusion of observations from analyses, based on confidence. We adopted a conservative approach to inclusion of data, retaining only those where confidence exceeded 70%.
Where the ability of a fieldworker to detect birds was compromised by visibility from the transect route (e.g. obstruction by surrounding vegetation), the observer moved a short distance away from the transect to obtain a clearer view before returning and continuing along the route. Although the fieldworker followed a map of the transect route it is unlikely that they will have been standing exactly on the transect line (i.e. at g(0), zero distance from the line) at the time of making any observation. The perpendicular distance of the fieldworker from the transect route at the time of each observation was determined using the GPS locations viewed in GIS. These ‘offsets’ were then used to correct the calculated distances of the observations to the transect line through either addition or subtraction of the offset (depending on the relative positions of the observer and bird to the transect route). All GPS locations obtained using World Geodetic System 84 were transformed to British National Grid using the Ordnance Survey ‘OSTN02’ transformation in ArcGIS (ESRI Citation2011).
The restriction of transect routes to public rights of way and open access areas may have resulted in the violation of the distance sampling assumption that all areas have equal probability of being sampled. We determined the extent of entire study area unavailable for surveying using the ‘Buffer’ function in ArcGIS (ESRI Citation2011). In this we produced a survey strip corresponding to the maximum operational distance of the rangefinder (700 m) on each side of all rights of way and open access areas and deducted the extent of study area not covered by these strips (5.8 km2) from the total size of the study area in all subsequent distance analyses.
To investigate the possible role of roads and roadside areas in attracting birds, we also compared the distribution of distances of 5000 randomly generated points with that of our observations. Points were generated using the random number generator runif() function in R (R Core Team Citation2016) to produce pairs of latitude and longitude. These points were then plotted and their distances from the nearest road determined using the Near function in ArcGIS. The distributions of these ‘distance-to-roads’ measurements were compared using two-sample Kolmogorov–Smirnov tests.
Density estimation
Population size and density estimates were derived using both the Conventional Distance Sampling (CDS) and Multiple Covariates Distance Sampling (MCDS) engines within program Distance 7.0 (Thomas et al. Citation2010). Distance analysis here follows the guidelines provided for that software and in the associated literature by Buckland et al. (Citation2001, Citation2004).
Five covariates () were included in the MCDS modelling process on the basis that each was assumed a priori to influence the ability to detect birds through a biological or methodological effect (Burnham Citation1981, Thompson Citation2002, Diefenbach et al. Citation2003). A two-level factor covariate (OBS) was included to account for the likely variation in ability of fieldworkers to detect birds. Area of woodland at the point of observation (WDS) is also likely to impact detection distance due to an inverse relationship with range of view (i.e. the maximum range of vision). Values for this covariate were determined from the Centre for Ecology and Hydrology Land Cover Map 2007 (Morton et al. Citation2014) by measuring the area of woodland within a 250 m radius of the point of observation using ArcGIS 10.2 (ESRI Citation2011). STRATA was included as a covariate in order to account for potential differences in topography or habitat quality between the two sections of the study area, since this may result in differential detection distances. Bird activity and behaviour, and thus detectability, will vary throughout the day (Kendall Citation2014, Öberg et al. Citation2015). Here, TIME was defined as the number of minutes after sunrise for each observation. Lastly, the situation of the bird, i.e. whether on the ground, perched or in flight, was included as a factorial covariate, LOC. The inclusion of flying birds in distance sampling can present a number of problems, primarily due to violation of the assumption of uniform distances through responsive movement, and double-counting (Fewster et al. Citation2008, Anderson et al. Citation2015). Where this occurs, estimates will tend to be overestimated (Buckland et al. Citation2001). Although exclusion of flying birds from analyses is possible, this approach is best used for species in which only a small proportion of the population will be in flight at any one time (Buckland et al. Citation2008). This is clearly not the case for many soaring raptor species and exclusion of such data was not appropriate. Instead, we adopted a ‘look-ahead’ approach to improve the likelihood of birds being recorded before they responded to the presence of the fieldworker (Burnham et al. Citation1980, Anderson et al. Citation2015).
Table 1. Covariates used in modelling distance sampling estimates of Common Buzzards Buteo buteo in central southern England.
Relationships between covariates and the ability to detect birds were explored prior to modelling, although failure to detect any effect here did not prevent inclusion in model assessments. Factor covariates were tested against perpendicular distance using either Welch’s t-tests or analysis of variance (ANOVA). Exploration of the potential relationship between continuous, non-factor covariates and distance was performed using Pearson’s r and regression.
Models with uniform, half-normal and hazard-rate key functions were fitted to the data. Automatic addition of adjustment terms was enabled for analyses using CDS. For the MCDS engine, however, this was restricted to a maximum of two cosine, simple polynomial or hermite polynomial adjustment terms. Model fit was assessed with reference to cosine-weighted Cramér-von Mises and Kolmogorov–Smirnov tests. Data were truncated at 550 m to remove a lengthy tail and all models incorporating adjustment terms were scaled by the truncation distance.
Overloading of the MCDS engine with covariates is more likely to result in failure of the algorithm to converge (Thomas et al. Citation2010). To counter this, we follow the guidelines of Thomas et al. (Citation2010) who advocate the forward stepwise addition of individual covariates, retaining those which contribute to reducing Akaike’s Information Criteria (AIC). AIC was used to select between models (Burnham & Anderson Citation2002).
All statistical analyses, other than distance sampling, were performed using R version 3.3.1.
Results
A total length of 4490 km of surveys were completed during the 10 transect periods (). Coverage was higher in the eastern section of the study area with 2295 km of surveys walked on 151 transects compared with 2194 km on 145 transects in the western section. The average duration of each transect was 371 min (365 in spring and 377 in autumn).
Table 2. Survey effort and numbers of observations made during surveys of Common Buzzards Buteo buteo in central southern England.
A total of 4274 observations of 5174 individuals were made during the study. Birds were seen in groups of up to 32 individuals, however, 85% of observations were of single birds (mean ± sd group size = 1.2 ± 0.75). Sixty-three percent of observations were of birds in flight (compared with 37% perched or on the ground). Of these, 62% were birds that were soaring, hovering or interacting with other species, rather than in obvious directional transit movements.
There was no difference between the distributions of number of observations and the number of transects walked (and therefore, transect length) for each season (autumn
= 3.08, P = 0.55; spring
= 1.75, P = 0.78) indicating that more observations were made when more transects were walked. Significantly more individuals were seen during spring surveys than in autumn (
= 160.25, P < 0.001) despite the total length of surveys undertaken being similar.
Histograms of the distribution of perpendicular distances indicated detection on and close to the transect line remained at or near 100% in all survey periods. Median detection distance across all data was 178 m. Truncation of data above 550 m resulted in the loss of 2.8% of observations (99 observations of 143 individuals) but left more than 330 observations per period; comfortably above the threshold of 60–70 generally recommended for modelling using Distance (Buckland et al. Citation2001). Sufficient data were available to enable the modelling of separate detection functions, and the inclusion of different covariates, for each period.
Fifty-five percent of the total length of transects was walked along roads. Twenty-eight percent of all observations involved Buzzards within 100 m of any road and only 11% were of birds within 100 m of the same road as that from which the observation was made. There was no indication of a bias in observation of birds near to roads when comparing the distribution of distances with that of 5000 random locations (two-sample Kolmogorov–Smirnov, D < 0.001, P = 0.99; Buzzard median = 264 m, Random median = 158 m). Thirty-six percent of the random locations were within 100 m of a road compared with 21% of Buzzard locations.
Exploratory analyses of covariates
The distance at which birds were detected reduced as the extent of woodland at the point of observation increased. This effect was negative across the entire dataset (r = −0.166, t4157 = −10.8, P < 0.001) and in all survey periods (P < 0.002) except spring 2013 (r = −0.079, t363 = −1.51, P = 0.13).
None of the remaining covariates showed any consistent relationship with detection distance. Mean detection distances were similar between both sections of the study area and varied significantly only in 2012 (spring, t474.13 = −3.5, P <0.001, mean East = 178.9 m, West = 207.7 m; autumn, t255.2 = −2.06, P = 0.04, mean East = 179.2 m, West = 214.2 m). The situation of birds (i.e. whether on the ground, perched or in flight) had no significant influence on detection distance (ANOVA F2,4156 = 2.42, P = 0.09, Tukey test, P > 0.15). Observer effects on detection distances were identified in one of the four survey periods where data were collected by more than one fieldworker (spring 2013, t139 = 3.67, P < 0.001, mean MS = 208 m, RH = 148 m). Although timing of an observation had a bearing on detection distance in two periods (autumn 2012, F1,402 = 4.91, P = 0.027; and spring 2015, F1,307 = 5.99, P = 0.015), there was no significant effect during the other eight periods.
Model fitting
MCDS models having reasonable fit (i.e. with Cramér von Mises and Kolmogorov–Smirnov tests P > 0.3) were developed for all periods () except periods 5–7. Although statistics assessing model fit for these periods produced P > 0.1, their detection functions and quantile-quantile plots indicated that more birds than expected were observed close to the transect route. As model fit was reasonable in these periods, we still present the outputs from these but emphasize their being on the margins of acceptability. CDS models were preferred in period 7 (P > 0.5), however, the model with lowest AIC (Half-normal + three cosine adjustments) showed signs of over-fitting and issues in maintaining monotonicity. A model using CDS with a Uniform key function is preferred for this period. Among the MCDS models, TIME, WDS/WDD and STRATA had the greatest effect on AIC, and appeared in the majority of preferred models for each survey period.
Table 3. Details of model selection statistics for distance sampling estimates of the Common Buzzard Buteo buteo population in central southern England. Preferred models are indicated by bold type. (Period – survey period number, season and year; Engine – analysis engine; Key – key function, U – Uniform, HN – Half normal, HZ – Hazard rate; Adjustment Term – series expansion type (number of terms), Cos – Cosine, HP – Hermite polynomial, SP – Simple polynomial; Covariates – included in the model; Parameters – total number of parameters in the model; ΔAIC – difference in Akaike Information Criterion between model with best fit and the current model; CvM(p) – cosine-weighted Cramér–von Mises Goodness of fit test value and (P value)).
Population estimates
Population size and density estimates increased throughout the course of study and were 0.6 birds km−2 higher by 2016 than at the start of the study. Our analyses suggest an increase in estimated population size of 56%, from 2883 individuals in 2011 to 4485 in 2016 (). The average annual rate of increase across the four-and-a-half years of the study was 12.5% but this slowed in successive years (from 15% to 1% in autumn and 43% to −1% in spring; ).
Figure 2. Estimates of Common Buzzard Buteo buteo population size within the study area in central south England for each survey period between autumn 2011 and spring 2016 (± 95% confidence intervals).
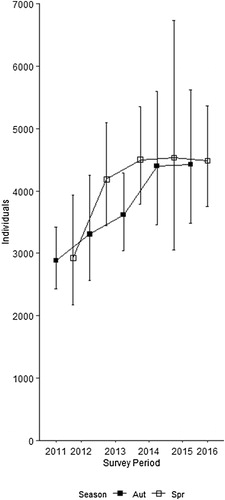
Table 4. Estimates of density and population size of Common Buzzards Buteo buteo with Lower (LCL) and Upper (UCL) 95% confidence intervals. %CV – coefficient of variation, df – degrees of freedom.
More birds were seen in spring surveys (1.31 km−1) than preceding autumn periods (1.0 bird km−1) even though total lengths of transects walked were shorter in spring for all periods except autumn 2012–spring 2013. Estimated density was also consistently higher for surveys performed during the spring (; means: spring = 1.59 autumn = 1.44).
Discussion
Population density estimates
We used a distance sampling-based methodology to estimate the population density of a conspicuous diurnal raptor species within an area of central southern England. These estimates indicate that the Buzzard population increased by more than 50% over the course of the study (). In contrast, Buzzard populations in the adjacent southwest region have shown a comparatively modest rate of increase since 1995 (+13%, Harris et al. Citation2017). Differences in the rate of population change between these two regions may be a function of there being a higher number of available potential territories in regions neighbouring the southwest population and the consequent dispersal of individuals from higher to lower density areas (Walls & Kenward Citation1998).
The reduced rate of population growth during the last three survey periods mirrors estimates derived from BBS data for the southeast region (www.bto.org/bbs) which, although showing an overall increase of 1104% since 1995, indicate a slowing of population growth to a point of a slight decline (−2%) between 2016 and 2017. The reasons for this are unclear, especially since rates of breeding success for Buzzards have increased across the UK during these years (Woodward et al. Citation2018); although regional differences will be masked in these national estimates. Nevertheless, a number of factors may be operating to limit population growth, including: the ongoing impacts of viral haemorrhagic disease (VHD) on UK rabbit populations (Harris et al. Citation2019), the abundance of which has been shown to influence breeding productivity and population increase in Buzzards in the UK (Swann & Etheridge Citation1995); the continued impacts of secondary poisoning by rodenticides (Christensen et al. Citation2012) and ingestion of lead in spent hunting ammunition (Pain et al. Citation2009); and a potential increase in persecution in response to the perceived predation pressures on game bird populations from increasing Buzzard abundance.
Despite the observed declines between 2016 and 2017 in this study and BBS (BTO Citation2018), continued population growth in areas of the southeast region which lie to the north and east of the study area still appears likely since they will have been recolonized later and will be further from reaching carrying capacity; a situation highlighted by Harris et al. (Citation2014). In addition, now that the scale of human-induced population constraints appears to have substantially reduced, carrying capacities are likely to have increased and be governed mostly by the availability and suitability of food and breeding habitat. In southern England, there is likely to be a proportionally greater extent of suitable breeding habitat in the southeast region compared to the historical strongholds in the southwest since the landscape is more heavily wooded (Forestry Commission Citation2016). As a result, continued population growth in this region is likely for the foreseeable future.
Atlas data (Balmer et al. Citation2013) show the Buzzard to be uniformly distributed across all 10 × 10 km squares of southeast England and from more than 85% of all 2 km × 2 km tetrads covered by atlas fieldwork (2007–2012) in the southeast region. Assuming that habitat quality and availability within our study area is representative of that throughout the remainder of the southeast region, then our density estimates indicate a population size of 27,500–32,500 individuals in southeast England. Translation of this figure into an estimate of the breeding population is difficult, since a significant proportion of Buzzards will not make a nesting attempt each year, either due to immaturity, lack of status and inability to find a mate or hold a territory (Davis & Davis Citation1992, Kenward et al. Citation2000). Using the estimate suggested by Kenward et al. (Citation2000) of only one in four individuals breeding each year, results in an estimate of between 3440 and 4125 pairs in southeast England. This represents a breeding density of 18–22 pairs per 100 km2, similar to that found by Sim et al. (Citation2001) in one of their West Midlands study areas. This is still lower than the 41 pairs per 100 km2 recorded by Newton et al. (Citation1982) across a large area in mid-Wales, and substantially lower than the densities (78 pairs per 100 km2) recorded in ideal wooded habitat in central Europe (Melde Citation1956, Thiollay Citation1967). Since the coarse regional population estimate presented here is an extrapolation from our derived estimates, any variation in the quality of those landscape characteristics representing suitability for Buzzards (e.g. food and prey density, disturbance, persecution, habitat structure and mosaic) will influence its validity.
Alongside the estimates of overall abundance within the study area, our study provides an interesting comparison of the apparent abundance of Buzzards between autumn and spring periods. Several studies have determined that juvenile Buzzards tend to remain within their natal territory for the first few months after fledging (Davis & Davis Citation1992, Walls et al. Citation1999) and that most do not disperse more than 50 km from the natal site in their first year (Walls & Kenward Citation1998). This is particularly the case in landscapes with a significant arable component (Walls et al. Citation1999) where Buzzards often exploit the easy foraging for invertebrates provided by ploughed fields (Dare Citation1957). As a result, there is unlikely to have been any significant loss of first year birds from the study area in the autumn, and in fact we expected higher densities for surveys in this period. The potential impacts of overwinter and courtship mortality (Tubbs Citation1974, Simpson Citation1993) would theoretically compound this expected difference in seasonal abundance. That this is not the case may reflect more on seasonal variation in bird behaviour, and its influence on detectability, than demographics. Increased time spent soaring and in display behaviours in spring resulted in improved detectability during spring surveys. The supplementation of the autumn population by juveniles will also have been offset by dispersal (Walls & Kenward Citation1995) and high rates of mortality for Buzzards in the four months after fledging (Kenward et al. Citation2001).
Methodological assessment
We encountered few obvious methodological issues with the study. Poor model fit using the MCDS engine for the autumn 2014 was most likely the result of higher than expected numbers of birds recorded between 275-325 m in this survey period. This problem was not identified in other periods suggesting that it is unlikely to represent any significant issue with survey design. Similarly, the issue of poor precision was limited to one survey period and stems from reduced coverage; the level of effort being lowest in this period ().
The covariates most frequently included within preferred models (WDS, STRATA and TIME) indicate that woodland cover was the most important factor affecting Buzzard detectability. Increasing density of woodland reduces the view of surrounding habitats leading to birds generally being detected at shorter distances than in more open habitats. This effect is also likely to account for the inclusion of STRATA in many preferred models since a greater proportion of the landscape area was woodland (and, therefore, a higher proportion of surveys performed through woodlands) in the eastern section of the study area. Lastly, the inclusion of TIME is likely to relate to the behaviour of birds at differing times of the day e.g. birds perched during cooler periods (during morning) and soaring in warmer periods (from late morning onwards). The level and type of activity of birds will have an obvious impact on detection distance. Daily variation in temperature and weather conditions will make this a complicated relationship which is unlikely to be detected by these analyses.
Transects running through dense woodland may result in undetected responsive movements of birds which may, in turn, lead to incorrect distance measurement or incomplete detection at g(0). In such habitats Buzzards were almost always heard to call prior to, or immediately after, taking flight when disturbed by a fieldworker. Use of such cues to identify original locations for measurement should have reduced the number of undetected responsive movements along transects performed in these habitats.
The use of public rights of way and roads for this study will have resulted in some sections of transect necessarily following linear landscape features such as hedgerows, fences and runs of power lines and poles. These features can influence the distribution of raptors such as Buzzards through their impact on the abundance of preferred prey items (Adams & Geiss Citation1983, Meunier et al. Citation2000) or carrion (Lambertucci et al. Citation2009, Lees et al. Citation2012), the ways in which they can improve hunting efficiency (Beckmann & Shine Citation2011) or how they permit the adoption of less energy-demanding hunting strategies (Meunier et al. Citation2000). Failure to place transects randomly across a study area (e.g. by following linear landscape features) can lead to biases arising from the association and preferences for certain habitats or landscape features. This will effectively remove the validity of extrapolating sample statistics to the population of interest (Buckland et al. Citation2001). Despite this, and the potential effects listed above, we found no evidence for the attraction of Buzzards to roads in our data. Whether the inclusion of roadside transect data has a significant influence on the derived density estimates is open to question.
Although we adopted a number of strategies to reduce double counting, the duration of each transect (mean = 371 min) means that there was ample opportunity for birds to move across the study area. This is likely to have resulted in the double-counting of a small number of individuals and possible positive bias to our estimates. Similarly, the inclusion of flying birds may also have affected our results. Buckland et al. (Citation2001) suggest that independent movement of birds can be accommodated they must, ‘on average’, be moving at less than half the speed of the observer if they are not to introduce a positive bias to the results. Twenty-four percent of the observations here were of birds engaged in purposeful, directional flight. Since neither the destination of flying birds nor their duration of flight was recorded here, it is not possible to determine whether the average speed of these individuals was less than half that of the observer. Whether the inclusion of these observations has resulted in a significant positive bias to estimates is open to question. Nevertheless, inclusion of some assessment of the nature and distances of flight behaviour in future surveys would enable greater discrimination of data and exploration of impacts on derived estimates.
The population trends derived here closely follow those obtained for the same period by BBS. This suggests that the potential issues often associated with broad-scale, multi-species, volunteer surveys (e.g. the dilution of effort between target species and differential abilities of volunteers) have little effect on results. This may not be the case for density estimates though, since the use of a small number of distance bands (in BBS), rather than accurate distance measurement, has been shown to over-estimate density (Quesada et al. Citation2010). The extent of any difference cannot be assessed here since there are no published BBS-derived population estimates for this species in this region for the period covered by our study.
The methods employed here provide a reasonably straightforward means of assessing the absolute population size of an abundant, conspicuous, raptor species across the UK landscape. However, this method is unlikely to be suitable for more secretive (e.g. Sparrowhawk, Accipiter nisus) or scarcer species. The methods used here are applicable across most landscape types and could provide a useful means of population monitoring stratified by habitat and area. The broader application of such methods is perhaps limited by the cost of equipment (laser rangefinder and GPS); however, rapid technological advances and falling costs are likely to remove such obstacles in the near future. Individual variation in skill levels, abilities to detect birds in the landscape and the need to train individuals in survey methodology may also pose certain problems; however, these are challenges faced by all survey protocols.
The recovery of raptor populations is often accompanied by concerns relating to potential impacts on conservation (e.g. of prey species or competitors; Moleón et al. Citation2011), sociology (Burke et al. Citation2015) or economy (e.g. of game populations; Parrott Citation2015). Indeed, the recovery of Buzzard populations has been followed by increasing pressure for population control measures to protect game stocks (Lees et al. Citation2012). Although Buzzards are protected under UK law (Wildlife & Countryside Act Citation1981), provision exists to issue licences to kill individuals to prevent agricultural damage (including ‘damage to livestock’). Licences are issued only after careful consideration of a number of factors, including local abundance. Without accurate population data, such assessments will be affected by subjective perceptions of abundance. Producing estimates of actual population size for this species is therefore timely, and will prove useful in assisting decision-makers in assessing the potential impacts of any licensed action.
Conclusion
Our results show how the population size of a previously persecuted species of raptor in central southern England has increased by more than 50% over a five-year period, and how the previously high rate of population growth appears to be stalling. The next phase of this study will focus on producing density estimates using this methodology across a larger area. This approach will enable comparison of the predicted population estimates for the southeast region produced here with those utilizing fieldwork undertaken across all parts of the region and a direct comparison with BBS estimates. Further assessment of the utility of this method and the viability of using volunteers to derive estimates across a broader geographical scale will also be possible.
Acknowledgements
Two anonymous reviewers provided helpful comments on earlier drafts of the manuscript.
ORCID
Matthew Stevens http://orcid.org/0000-0002-0886-8846
Campbell Murn http://orcid.org/0000-0003-4064-6060
Additional information
Funding
References
- Adams, L.W. & Geiss, A.D. 1983. Effects of roads on small mammals. J Appl. Ecol. 20: 403–415. doi: 10.2307/2403516
- Anderson, A.S., Marques, T.A., Shoo, L.P. & Williams, S.E. 2015. Detectability in audio-visual surveys of tropical rainforest birds: the influence of species, weather and habitat characteristics. Plos One. 10 (6): e0128464. doi:10.1371/journal.pone.0128464.
- Balmer, D.E., Gillings, S., Caffrey, B.J., Swann, R.L., Downie, I.S. & Fuller, R.J. (eds) 2013. Bird Atlas 2007–11: the Breeding and Wintering Birds of Britain and Ireland. BTO Books, Thetford.
- Beckmann, C. & Shine, R. 2011. Toad’s tongue for breakfast: exploitation of a novel prey type, the invasive cane toad, by scavenging raptors in tropical Australia. Biol. Invasions 13: 1447–1455. doi: 10.1007/s10530-010-9903-8
- BTO. 2018. Retrieved from https://www.bto.org/volunteer-surveys/bbs/latest-results/population-trends.
- Buckland, S.T., Anderson, D.R., Burnham, K.P., Laake, J.L., Borchers, D.L. & Thomas, L. 2001. Introduction to Distance Sampling. Oxford University Press, Oxford.
- Buckland, S.T., Anderson, D.R., Burnham, K.P., Laake, J.L., Borchers, D.L. & Thomas, L. 2004. Advanced Distance Sampling, Vol. 2. Oxford University Press, Oxford.
- Buckland, S.T., Marsden, S.J. & Green, R.E. 2008. Estimating bird abundance: making methods work. Bird Conserv. Int. 18: S91–S108. doi: 10.1017/S0959270908000294
- Burke, B.J., Finna, A., Flanagan, D.T., Fogarty, D.M., Foran, M., O’Sullivan, J.D., Smith, S.A., Linnell, J.D. & McMahon, B.J. 2015. Reintroduction of White-tailed Eagles to the Republic of Ireland: A case study of media coverage. Ir. Geogr. 47: 95–115.
- Burnham, K., Anderson, D. & Laake, J. 1980. Estimation of density from line transect sampling of biological populations. Wildlife Monogr. 72: 7–202.
- Burnham, K.P. 1981. Summarizing remarks: Environmental influences. Studies Avian Biol-Ser. 6: 324–325.
- Burnham, K.P. & Anderson, D.R. 2002. Model Selection and Multimodel Inference: A Practical Information-Theoretic Approach. Springer Science & Business Media, New York.
- Christensen, T.K., Lassen, P. & Elmeros, M. 2012. High exposure rates of anticoagulant rodenticides in predatory bird species in intensively managed landscapes in Denmark. Archives Environ. Contam. Toxicol. 63: 437–444. doi: 10.1007/s00244-012-9771-6
- Clements, R. 2002. The Common Buzzard in Britain: a new population estimate. Brit. Birds 95: 377–383.
- Dare, P.J. 1957. The post-myxomatosis diet of the buzzard. Devon Birds 10: 2–6.
- Davis, P.E. & Davis, J.E. 1992. Dispersal and age of first breeding of buzzards in central Wales. Brit. Birds 85: 578–597.
- Diefenbach, D.R., Brauning, D.W. & Mattice, J.A. 2003. Variability in grassland bird counts related to observer differences and species detection rates. Auk 120: 1168–1179. doi: 10.1642/0004-8038(2003)120[1168:VIGBCR]2.0.CO;2
- Eglington, S.M., Davis, S.E., Joys, A.C., Chamberlain, D.E. & Noble, D.G. 2010. The effect of observer experience on English breeding bird survey population trends. Bird Study 57: 129–141. doi: 10.1080/00063650903440648
- Ekblom, R. 2010. Evaluation of the analysis of distance sampling data: a simulation study. Ornis Svecica 20: 45–53.
- ESRI. 2011. ArcGIS Desktop: Release 10. Environmental Systems Research Institute, Redlands, CA.
- Fewster, R.J.M., Southwell, C., Borchers, D.L., Buckland, S.T. & Pople, A.R. 2008. The influence of animal mobility on the assumption of uniform distances in aerial line-transect surveys. Wildlife. Res. 35: 275–288. doi: 10.1071/WR07077
- Forestry Commission. 2016. National Forest Inventory Woodland England 2015.
- Frankham, R. 1995. Effective population size/adult population size ratios in wildlife: a review. Genet. Res. 66: 95–107. doi: 10.1017/S0016672300034455
- Glutz von Blotzheim, U., Bauer, K. & Bezzel, E. 1971. Handbuch der Vögel Mitteleuropas, Vol. 4. Aula Verlag, Wiesbaden.
- Harris, S.J., Massimino, D., Gillings, S., Eaton, M.A., Noble, D.G., Balmer, D.E., Procter, D. & Pearce-Higgins, J.W. 2017. The Breeding Bird Survey 2016. BTO Research Report 700. British Trust for Ornithology, Thetford.
- Harris, S.J., Massimino, D., Eaton, M.A., Gillings, S., Noble, D.G., Balmer, D.E., Pearce-Higgins, J.W. & Woodcock, P. 2019. The Breeding Bird Survey 2018. BTO Research Report 717. British Trust for Ornithology, Thetford.
- Harris, S.J., Risely, K., Massimino, D., Newson, S.E., Eaton, M.A., Musgrove, A.J., Noble, D.G., Procter, D. & Baillie, S.R. 2014. The Breeding Bird Survey 2013. BTO Research Report 658. British Trust for Ornithology, Thetford.
- Hunt, W.G. 1998. Raptor floaters at Moffat’s equilibrium. Oikos 82: 191–197. doi: 10.2307/3546929
- Jiguet, F. 2009. Method learning caused a first-time observer effect in a newly started breeding bird survey. Bird Study 56: 253–258. doi: 10.1080/00063650902791991
- Johnston, A., Newson, S.E., Risely, K., Musgrove, A.J., Massimino, D., Baillie, S.R. & Pearce-Higgings, J.W. 2014. Species traits explain variation in detectability of UK birds. Bird Study 61: 340–350. doi: 10.1080/00063657.2014.941787
- Kendall, C.J. 2014. The early bird gets the carcass: Temporal segregation and its effects on foraging success in avian scavengers. The Auk: Ornithological Adv. 131: 12–19. doi: 10.1642/AUK-13-201.1
- Kenward, R.E., Marcström, V. & Karlbom, M. 1999. Demographic estimates from radio-tagging: models of age-specific survival and breeding in the goshawk. J. Anim. Ecol. 68: 1020–1033. doi: 10.1046/j.1365-2656.1999.00347.x
- Kenward, R.E., Walls, S.S., Hodder, K.H., Pakhala, M., Freeman, S.N. & Simpson, V.R. 2000. The prevalence of non-breeders in raptor populations: Evidence from rings, radio-tags and transect surveys. Oikos 91: 271–279. doi: 10.1034/j.1600-0706.2000.910207.x
- Kenward, R.E., Walls, S.S. & Hodder, K.H. 2001. Life path analysis: Scaling indicates priming effects of social and habitat factors on dispersal distances. J. Anim. Ecol. 70: 1–13. doi: 10.1046/j.1365-2656.2001.00464.x
- Lambertucci, S.A., Speziale, K.L., Rogers, T.E. & Morales, J.M. 2009. How do roads affect the habitat use of an assemblage of scavenging raptors? Biodivers. Conserv. 18: 2063–2074. doi: 10.1007/s10531-008-9573-3
- Lees, A.C., Newton, I. & Balmford, A. 2012. Pheasants, buzzards, and trophic cascades. Conserv. Lett., 1–4. doi:10.1111/j.1755-263X.2012.00301.x.
- Link, W.A., Barker, R.J. & Sauer, J.R. 1994. Within-site variability in surveys of wildlife populations. Ecology 75: 1097–1108. doi: 10.2307/1939433
- Marques, T.A., Buckland, S.T., Borchers, D.L., Tosh, D. & McDonald, R.A. 2010. Point transect sampling along linear features. Biometrics 66: 1247–1255. doi: 10.1111/j.1541-0420.2009.01381.x
- Melde, M. 1956. Die Mausebussard. Neue Brehm Bucherei, Leipzig.
- Meunier, F.D., Verheyden, C. & Jouventin, P. 2000. Use of roadsides by diurnal raptors in agricultural landscapes. Biol. Conserv. 92: 291–298. doi: 10.1016/S0006-3207(99)00094-4
- Moleón, M., Sánchez-Zapata, J.A., Gil-Sánchez, J.M., Barea-Azcón, J.M., Ballesteros-Duperón, E. & Virgós, E. 2011. Laying the foundations for a human-predator conflict solution: assessing the impact of Bonelli's eagle on rabbits and partridges. PLoS One 6: e22851. doi: 10.1371/journal.pone.0022851
- Morton, R.D., Rowland, C.S., Wood, C.M., Meek, L., Marston, C.G. & Smith, G.M. 2014. Land Cover Map 2007 (Vector, GB) v1.2. NERC Environmental Information Data Centre.
- Musgrove, A., Aebischer, N., Eaton, M., Hearn, R., Newson, S., Noble, D., Parsons, M., Risely, K. & Stroud, D. 2013. Population estimates of birds in Great Britain and the United Kingdom. Brit. Birds 106: 64–100.
- Newson, S.E., Evans, K.L., Noble, D.G., Greenwood, J.J.D. & Gaston, K.J. 2008. Use of distance sampling to improve estimates of national population sizes for common and widespread breeding birds in the UK. J. Appl. Ecol. 45: 1330–1338. doi: 10.1111/j.1365-2664.2008.01480.x
- Newton, I., Davis, P.E. & Davis, J.E. 1982. Ravens and buzzards in relation to sheep farming and forestry in Wales. J. Appl. Ecol. 19: 681–706. doi: 10.2307/2403275
- Nomis – Official Labour Market Statistics. 2016. KS101EW (Usual resident population). Available from: http://www.nomisweb.co.uk/census/2011/ks101ew [Accessed August 2018].
- Öberg, M., Arlt, D., Pärt, T., Laugen, A.T., Eggers, S. & Low, M. 2015. Rainfall during parental care reduces reproductive survival components of fitness in a passerine bird. Ecol. Evol. 5: 345–356. doi: 10.1002/ece3.1345
- Ortega, Y.K. & Capen, D.E. 2002. Roads as edges: Effects on birds in forested landscapes. Forest Sci. 48: 381–390.
- Pain, D.J., Fisher, I.J. & Thomas, V.G. 2009. A global update of lead poisoning in terrestrial birds from ammunition sources. In R. T. Watson, M. Fuller, M. Pokras & W. G. Hunt. (eds) Ingestion of Lead From Spent Ammunition: Implications for Wildlife and Humans, 99–118. The Peregrine Fund, Boise, Idaho.
- Parrott, D. 2015. Impacts and management of common buzzards buteo buteo at pheasant Phasianus colchicus release pens in the UK: a review. Eur. J. Wildlife Res. 61: 181–197. doi: 10.1007/s10344-014-0893-1
- Peterjohn, B.G., Sauer, J.R. & Robbins, C.S. 1995. Population trends from the North American breeding bird survey. In T. E. Martin & D. M. Finch. (ed) Ecology and Management of Neotropical Migratory Birds, 3–39. Oxford University Press, New York.
- Quesada, J., Guallar, S., Pérez-Ruiz, N.J., Estrada, J. & Herrando, S. 2010. Observer error associated with band allocation is negligible in large scale bird monitoring schemes, but how precise is the use of bands at all? Ardeola 57: 23–32.
- Rabe, M.J., Devos, S.S. & Rosenstock Jr, J.C. 2002. Review of big-game survey methods used by wildlife agencies of the western United States. Wildlife Soc. B. 30: 46–53.
- R Core Team. 2016. R: A Language and Environment for Statistical Computing. R Foundation for Statistical Computing, Vienna, Austria. https://www/R-project.org/.
- Riseley, K., Noble, D.G. & Baillie, S.R. 2008. The breeding bird survey 2007. BTO Research Report 508, Thetford, UK.
- Sanderlin, J.S., Block, W.M. & Ganey, J.L. 2014. Optimizing study design for multi-species avian monitoring programmes. J.Appl. Ecol 51: 860–870. doi: 10.1111/1365-2664.12252
- Sim, I.M.W., Campbell, L., Pain, D.J. & Wilson, J.D. 2000. Correlates of the population increase of Common Buzzards Buteo buteo in the West Midlands between 1983 and 1996. Bird Study 47: 154–164. doi: 10.1080/00063650009461171
- Sim, I.M.W., Cross, A.V., Lamacraft, D.L. & Pain, D.J. 2001. Correlates of Common Buzzard Buteo buteo density and breeding success in the West Midlands. Bird Study 48: 317–329. doi: 10.1080/00063650109461231
- Simpson, V.R. 1993. Causes of mortality and pathological conditions observed in Common Buzzards (Buteo buteo) in Cornwall, England. In G. Dorrestein & van den Bergh. (ed) Proc. 1993 Eur. Conf. Avian Med. Surgery, 423–440. Association of Avian Veterinarians, Utrecht.
- Soulé, M.E. 1987. Viable Populations for Conservation. Cambridge University Press, Cambridge.
- Stanbury, A. & Gregory, R. 2009. Exploring the effects of truncated, pooled and sexed data in distance sampling estimation of breeding bird abundance. Bird Study 56: 298–309. doi: 10.1080/00063650902792130
- Swann, R.L. & Etheridge, B. 1995. A comparison of breeding success and prey of the Common Buzzard Buteo buteo in two areas of northern Scotland. Bird Study 42: 37–43.
- Thiollay, J.M. 1967. Ecologie d’une population de rapaces diurnes en Lorraine. Terre Vie 114: 116–183.
- Thomas, L., Buckland, S.T., Rexstad, E.A., Laake, J.L., Strindberg, S., Hedley, S.L., Bishop, R.B., Marques, T.A. & Burnham, K.P. 2010. Distance software: design and analysis of distance sampling surveys for estimating population size. J. Appl. Ecol. 47: 5–14. doi: 10.1111/j.1365-2664.2009.01737.x
- Thompson, W.L. 2002. Towards reliable bird surveys: Accounting for individuals present but not detected. Auk 119: 18–25. doi: 10.1093/auk/119.1.18
- Tubbs, C.R. 1974. The Buzzard. David and Charles, Newton Abbot.
- Walls, S.S. & Kenward, R.E. 1995. Movements of radio-tagged Common Buzzards Buteo buteo in their first year. Ibis 137: 177–182. doi: 10.1111/j.1474-919X.1995.tb03237.x
- Walls, S.S. & Kenward, R.E. 1998. Movements of radio-tagged Buzzards Buteo buteo in early life. Ibis 140: 561–568. doi: 10.1111/j.1474-919X.1998.tb04700.x
- Walls, S.S., Mañosa, S., Fuller, R.M., Hodder, K.H. & Kenward, R.E. 1999. Is early dispersal enterprise or exile? Evidence from radio tagged buzzards. J. Avian Biol. 30: 407–415. doi: 10.2307/3677013
- Wildlife & Countryside Act. 1981. Ch 69, s.1 & s.16.
- Woodward, I.D., Massimino, D., Hammond, M.J., Harris, S.J., Leech, D.I., Noble, D.G., Walker, R.H., Barimore, C., Dadam, D., Eglington, S.M., Marchant, J.H., Sullivan, M.J.P., Baillie, S.R. & Robinson, R.A. 2018. BirdTrends 2018: Trends in Numbers, Breeding Success and Survival for UK Breeding Birds. Research Report 708. BTO, Thetford. www.bto.org/birdtrends