
ABSTRACT
Capsule: There has been no trend in nest survival of Lesser Spotted Woodpecker Dryobates minor in the 70 years since the 1940s whereas the numbers of young per nesting attempt has declined. Late nests in any year are now significantly less productive than early ones.
Aims: To test whether there has been a long-term decline in the nest survival and productivity of the Lesser Spotted Woodpecker in Britain.
Methods: Breeding data from 331 nests over the period 1949–2019 have been analysed. There were three sources – nest records submitted to the British Trust for Ornithology, a study by the Royal Society for the Protection of Birds from 2006 to 2009 and records submitted to the Woodpecker Network from 2015 to 2019. Generalized linear models were used to analyse the records for first egg date, clutch size, numbers of young fledged, and numbers of nest days for which the nest was under observation. Data were grouped into three periods reflecting population trends of the bird (pre-1980, 1980–1999, 2000–2019) and we also analysed trends with year and spring temperature.
Results: There was no trend in first egg date up to 1980 but subsequently it has advanced by 13 days. The mean clutch was 5.3 with no trend with period or year. There were no trends in nest survival during the egg stage or chick rearing. The mean number of young fledged was 2.6, with nests since 1980 fledging lower numbers of young than those pre-1980 and a decline with year. Loss of chicks, probably to starvation, was the main cause of low productivity. In the last period (2000–2019) nests started early in the season fledged more young than those started later, a trend not apparent in the earlier periods.
Conclusions: Low productivity is a widespread problem for the Lesser Spotted Woodpecker which has probably been exacerbated by the trend towards warm springs.
The Lesser Spotted Woodpecker Dryobates minor is in serious decline in Britain and is included on the red list of Birds of Conservation Concern with the estimated population having fallen to 600–1000 pairs in 2015 (Eaton et al. Citation2015, Musgrove et al. Citation2013, Woodward et al. Citation2020). Elsewhere in Europe the Pan European Common Bird Monitoring Scheme (EBCC/BirdLife/RSPB/CSO Citation2019) lists the population trend as uncertain with wide confidence intervals although there was a 75% decline from 1980 to 2016 and a sustained decline of −14% over the period 2007–2016.
On the Pan European scale, the Lesser Spotted Woodpecker is an indicator of mature broadleaved forests (Mikusiński & Angelstam Citation1997, Mikusiński et al. Citation2001, Wiktander et al. Citation2001, Delahaye et al. Citation2010, Olsson et al. Citation1992, Olsson et al. Citation2001) and is often associated with wet woodland (Spitznagel Citation1990, Miranda & Pasinelli Citation2001, Riemer Citation2009, Camprodon et al. Citation2015). In Britain, it is particularly associated with well-wooded landscapes and has been lost from less wooded areas (Charman et al. Citation2010, Broughton et al. Citation2013). In both Britain and Germany, it has been associated with fruit trees in traditional orchards (Glue & Boswell Citation1994, Winnall Citation2001, Gorman Citation2004, Höntsch Citation2004) although in Britain at least this is now less common as such orchards have become restricted in numbers and distribution (Atkinson & Winnall Citation2008).
The population of Lesser Spotted Woodpeckers in Britain has shown varying fortunes since formal monitoring began. From the 1960s up to around 1980 there was a sustained increase in numbers but after that numbers fell to such an extent that they were no longer formally monitored by national schemes after 2000 (Massimino et al. Citation2019). Breeding bird atlases carried out by the British Trust for Ornithology (BTO) between 1968/1972, 1988/1991, and 2008/2011 have shown a marked retraction of range with 889, 792, and 560 occupied 10 km squares respectively in the three periods representing a 41% range reduction over four decades (Sharrock Citation1976, Gibbons et al. Citation1993, Balmer et al. Citation2013). The most notable losses have been in East Anglia and through a belt of middle England from the Wash to the Severn estuary. A widespread survey of breeding birds of lowland woodlands carried out in 2003–2004 found big declines in woods that had previously been surveyed in the 1980s (Hewson et al. Citation2007).
The increase up to 1980 was thought to be fuelled by Dutch Elm Disease, a virulent form of which swept through Britain from the 1960s resulting in the loss of most mature Elm trees Ulmus spp. from the landscape (Gibbs Citation1978, Osborne Citation1982, Citation1983). The exact mechanism driving the increase in Lesser Spotted Woodpeckers was never established although it may have acted through adult and juvenile survival as well as breeding success. The high numbers of dead and dying Elm trees in the landscape supporting large numbers of bark beetles Scolytus spp. and their larvae which would have provided an abundant food resource for birds throughout the year. The dead and dying trees would have also provided many opportunities for nesting and roosting cavities with Elm a frequently used nesting tree at the time (Glue & Boswell Citation1994).
The ultimate causes of the decline since 1980 are not known for certain and probably differ within the British range of the species. There are many suggestions which are fully reviewed in Smith & Charman (Citation2012). One of the strongest indications of the processes driving the decline was provided by a study carried by the Royal Society for the Protection of Birds (RSPB) between 2006 and 2009 which found that breeding success was considerably lower in Britain than reported from elsewhere in Europe (Charman et al. Citation2012, Smith & Charman Citation2012) and probably lower than previously reported from Nest Record Scheme data of the BTO (Glue & Boswell Citation1994). The immediate cause was nest failure or chick starvation often associated with the disappearance of one of the feeding adults and wet weather conditions, although predation by Great Spotted Woodpeckers Dendrocopos major was also a factor (Charman et al. Citation2012). The RSPB study was conducted at a limited number of sites over a short period of years, so it is not clear whether low breeding success is a widespread problem nor whether it has been so for the decades over which the Lesser Spotted Woodpecker population has been in decline.
In this paper, we use nest data collected in Britain from the late 1940s onwards to test the hypothesis that the breeding success was higher in the period up to 1980, when Lesser Spotted Woodpeckers numbers were increasing, than it has been during the period of sustained decline since 1980. We use data from the BTO Nest Record Scheme collected from the first nest reported in 1949 through to 2018 together with the nest data from the RSPB studies from 2006 to 2009. By 2014 the numbers of Lesser Spotted Woodpecker nests reported to the BTO Nest Record Scheme had fallen to only one or two per year. In response, in 2015 we launched an initiative, the Woodpecker Network (www.woodpecker-network.org.uk), to help and encourage observers to report and monitor Lesser Spotted Woodpecker nests and to provide nest inspection equipment to improve the quality of breeding success data collected. This has resulted in increased numbers of nests recorded from 2015 to 2019 which are included in this analysis.
Methods
We used nest records from the BTO Nest Record Scheme (n = 235), the RSPB studies (n = 33), and those collected by Woodpecker Network (n = 63) covering the 70-year period from 1949 to 2019. Each record was processed, making use of all the observations to estimate the date of laying the first egg (first egg date, FED), the numbers of eggs laid, and the numbers of young fledged. For each nest, we estimated the FED by using all the nest record observations assuming an incubation period of 11 days and the period between hatching and fledging of the young of 20 days (Cramp Citation1985, Glutz & Bauer Citation1994, Gorman Citation2004). We calculated the earliest and latest FED from the available observations to provide a range of possible FEDs for each nest. In the analyses, we only used data from nests where the uncertainty in FED was less than ±5 days.
For clutch size, we used data from nests where the eggs were counted at least once and where the FED indicated that the clutch was complete. The number of young fledged was determined from counts of large young where the timing of the nest and observations indicated that the nest had ultimately been successful. Failed nests were usually recorded as such by the observers although in a few cases the visit information made it clear that the nest had failed even though this was not recorded as such by the observer. We used the visit data to estimate the numbers of days during incubation and chick rearing that the nests were under observation so that nest survival in each period could be estimated using Mayfield methods (Mayfield Citation1975).
Great Spotted Woodpecker numbers have increased by 387% in the 50 years since 1967 (Massimino et al. Citation2019) and one hypothesis for the decline of Lesser Spotted is increased levels of nest site interference and predation by the larger woodpecker. We have extracted all the cases of nest failure that were attributed to interference (mainly predation) by Great Spotted Woodpeckers to test the hypothesis that such predation has increased over time.
For the recent RSPB and Woodpecker Network data, the nest contents were checked using video nest inspection cameras (Smith et al. Citation2006, Smith & Charman Citation2012) but for the earlier nests the contents were only determined for those that were accessible to the observers.
It is well known that FED has advanced in many species in response to warmer springs (see Pearce-Higgins & Green Citation2014 for a review). Because our nests were distributed over the whole of southern Britain, we used Central England Temperature (Parker et al. Citation1992) in April (AprCET) to characterize spring conditions in each year. For many species of birds, including woodpeckers (Wiktander et al. Citation1994, Citation2001, Smith Citation2006), earlier nests in any season tend to result in more fledged young than later nests. In order to examine this for the Lesser Spotted Woodpecker, we calculated the median FED for each year with sufficient nests recorded. We then calculated the egg difference (EGGDIFF) for each nest as the number of days difference between the date on which the first egg was laid and the median FED for that year. We were only able to calculate a median FED for years in which at least two nests were recorded. Not all parameters (FED, clutch size, numbers of young fledged, EGGDIFF) were known for each nest so the sample sizes vary for each part of the analyses.
Analyses
We have taken two approaches to analysing the trends in breeding parameters. Firstly, we have split the data into three periods and compared the breeding parameters for each period.
Period A: Pre 1980 – the period when Lesser Spotted Woodpecker numbers were increasing.
Period B: 1980–1999 – the first period of documented decline.
Period C: 2000 onwards – the period when the population trend was no longer monitored nationally. Nests in the sample included some from BTO nest records, the RSPB studies (2005–2009), and the Woodpecker Network studies (2015–2019).
Our second approach was to use regressions and piecewise regression to look at trends against year using generalized linear models with the appropriate error structure and link functions. FED was analysed as a normal gaussian variable expressed as days since 1st April. For both FED and AprCET there were indications of a break in the linear relationships with year, so we have used the package ‘Segmented’ in R to carry out piecewise regressions (Muggeo Citation2008). These model the trends in each phase but also estimate the break points between the differing trends. Clutch size was analysed with Poisson errors and a log link function. The daily nest survival during incubation and chick rearing was analysed as binomial variables with logit link functions with nest success (0 or 1) as the numerator and the days for which the nest was under observation as the denominator. Nest survival during incubation and chick rearing was analysed separately. We carried out a similar analysis for all the nest failures during chick rearing that were attributed to Great Spotted Woodpecker interference.
The productivity (the numbers of young fledged from all nests including failures) was analysed as a quasiPoisson variable with a log link function to allow for over-dispersion (Crawley Citation2007). The significance of all the models was assessed by comparing the residual deviance with that of the null model. For the binomial and Poisson models, the change in deviance was treated as Chi2 whereas for the quasiPoisson models an F test was appropriate (Crawley Citation2007). All statistics were carried out in R (R Core Team Citation2019).
Results
Records were available from 355 nests and we were able to extract at least some useful breeding data from 331 of these. There were 235 nests from the nest record database, 33 from the RSPB studies between 2005 and 2009 and 63 monitored by Woodpecker Network between 2015 and 2019. The first nest record in the database was from 1949 and there were 84 nests in period A (pre-1980), 99 from period B (1980–1999), and 148 from period C (2000–2019).
The values of the breeding parameters in each period are summarized in . There were significant differences between the mean FED in the three periods () and a significant reduction with year (, FED = 583.9–0.28 × year, F1,308 = 140.4, P < 0.001). shows clear evidence that the advance in FED only started around 1980. Piecewise regression gave a better description of the data than linear regression (F2 = 8.59, P < 0.001) with a break year of 1979 ± 3.5 (se) (pre-1979, FED = −118.6 + 0.081 × year; post-1979 FED = −1004.2 – 0.366 × year).
Figure 1. FED of Lesser Spotted Woodpecker in Britain against year from 1949 to 2019 (1 = April 1st). Details of the relationships are given in the text. The dashed line shows the simple linear regression relationship of FED against year whilst the solid line shows the piecewise regression which provided a significantly better description of the data (F2 = 8.59, P < 0.001) with the break year of 1979 ± 3.5 (se).
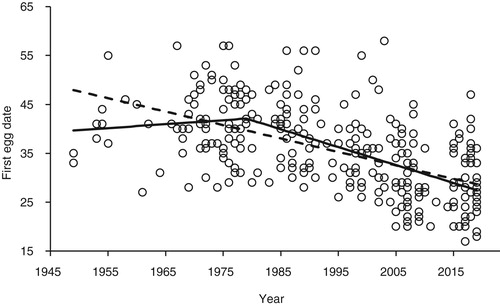
Table 1. A summary of the breeding parameters of Lesser Spotted Woodpeckers in each period with the significance of tests for the differences between periods. Period A – pre-1980, Period B – 1980–1999, Period C – 2000 onwards. Full details of the statistical tests are given in the text. For FED, clutch and young fledged the figures are given ± se but for the nest survival the figures give the 95% confidence range.
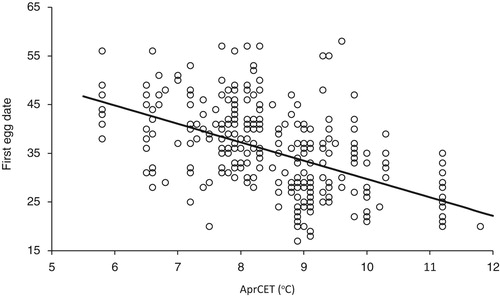
There was a significant trend for April temperature to increase over the period of the study (, AprCET = −55.0 + 0.032 × year, F1,308 = 89.9, P < 0.001) but, as with FED, piecewise regression provided a better description the data (F 2 = 16.9, P < 0.001). The break year was 1978 ± 2.5 (se), similar to that for FED, (pre-1978, AprCET = 90.47 −0.042 × year; post-1978, AprCET = −88.54 + 0.049 × year). There was a significant relationship between FED and April CET with eggs laid earlier in warmer springs (, FED = 67.5–3.78 × AprCET, F1,308 = 110.6, P < 0.001).
Figure 2. April Central England Temperature (AprCET) against year from 1949 to 2019. Details of the relationships are given in the text. The dashed line shows the simple linear regression relationship of AprCET against year whereas the solid line shows the piecewise regression which provided a significantly better description of the data (F 2 = 16.9, P < 0.001). The break year was 1978 ± 2.5 (se).
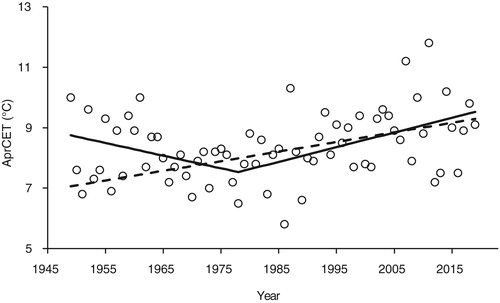
Figure 3. The relationship between the FED (1 = April 1st) of Lesser Spotted Woodpeckers and April Central England Temperature (AprCET). The regression was highly significant (F1 = 110.6, P < 0.001). Full details are given in the text.
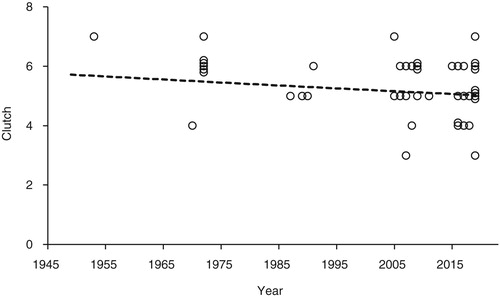
The number of eggs laid (clutch) were known for 61 nests (15 in period A, 9 in period B, and 37 in period C). The overall mean clutch size was 5.27 ± 0.13 (se) with no significant differences between the periods () or trend with year (, change in deviance from null model = −0.40, df = 1, P = 0.53).
Figure 4. The trend in clutch size of Lesser Spotted Woodpeckers in Britain from 1949 to 2019 (n = 45). Some of the points have been plotted with ‘jitter’ to show multiple records with the same clutch size in any year. The trend with year was not significant – see text for details.
The numbers of nest failures were not high. There were seven recorded failures during incubation from a total of 121 nests and 1373 days of nest observation (period A, 29 nests with two failures in 271 nestdays; period B 26 nests with two failures in 245 nestdays; period C, 66 nests with three failures in 857 nestdays). The overall daily nest success during incubation was 0.995 (se range 0.993–0.997) which corresponds to a survival during the 15 days of laying and incubation of 0.93 (se range 0.89–0.95). There were no significant differences in the daily survival between periods () or trend with year (change in deviance from null model = −1.91, df = 1, P = 0.17).
There were 288 nests with observations during the chick rearing period with 29 failures from 3390 nestdays (period A, 66 nests with five failures in 761 nestdays; period B 79 nests with five failures in 840 nestdays; period C 143 nests with 19 failures in 1789 nestdays). Although the numbers of failures in period C appeared to be higher than in the other two this difference was not statistically significant (). Neither was there a significant trend with year (change in deviance from null model = −1.01, df = 1, P = 0.31). The daily nest success during chick rearing was 0.992 (se range 0.990–0.993) which corresponds to a survival during the 20 days of chick rearing of 0.85 (se range 0.82–0.87).
Of the 29 nest failures during chick rearing 16 (55%) were attributed to Great Spotted Woodpecker predation – two in Period A, five in Period B, and nine in Period C. There was no evidence of an increase over time of the loss of nests to Great Spotted Woodpeckers with no trend with year (change in deviance from null model = −0.28, df = 1, P = 0.60). Of the 13 remaining nest failures during chick rearing, two were attributed to human interference, three to chick starvation linked to poor weather, and seven to unknown causes.
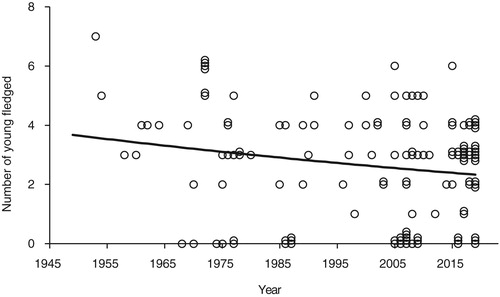
There were 135 records of the numbers of young fledged; 30 in period A, 18 in period B, and 87 in period C. The overall differences between the groups were not quite significant (). However, comparing period A with periods B and C combined gave a significant difference (change in deviance from null model = −6.70, F1 = 5.62, P = 0.02). The regression of the mean number of young fledged against year was significant (, loge(Number fledged) = 13.97–0.0065 × year, F1 = 4.57, P = 0.03).
Figure 5. The numbers of young fledged from all nests (including failed nests) against year from 1949 to 2019 (n = 135). Some of the points have been plotted with ‘jitter’ to show multiple records with the same number of young fledged in any year. The regression was significant (F1 = 4.57, P = 0.03). Full details are given in the text.
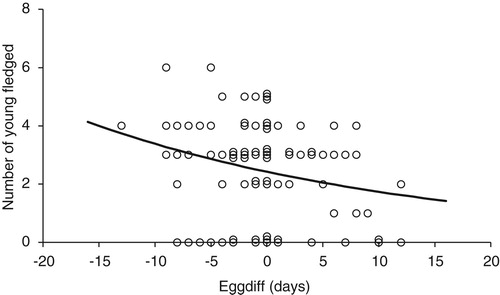
The numbers of records that could be used to look at the relationship between EGGDIFF, clutch size and the numbers of young fledged were limited. However there were no significant relations between clutch size and EGGDIFF for periods A & B combined or period C (, periods A & B, change in deviance from null model = −0.40, df = 1, P = 0.53, n = 12; Period C, change in deviance from null model = −1.05, df = 1, P = 0.30, n = 32). There were no significant relationships between the numbers of young fledged and EGGDIFF in Periods A & B (, change in deviance from null model = −0.40, F1 = 0.253, P = 0.62, n = 43). By contrast in Period C, there was a significant decline (, loge(Number fledged) = 0.885–0.033 × EGGDIFF, change in deviance from null model = −5.98, F1 = 5.41, P = 0.02, n = 84).
Figure 6. The clutch size plotted against EGGDIFF for Periods A & B and period C (○ = Periods A + B, n = 12; ● = Period C, n = 32). Some of the points have been plotted with ‘jitter’ to show multiple records with the same clutch size and EGGDIFF. The trend with EGGDIFF was not significant – see text for details.
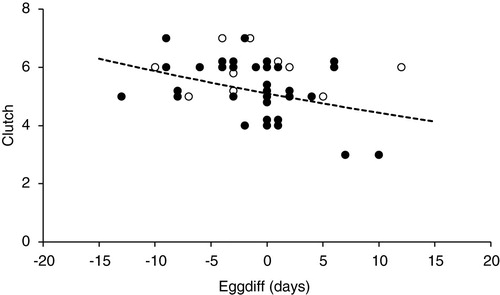
Figure 7. The numbers of young fledged from all nests (including failed nests) against EGGDIFF for Periods A & B (○ = Period A, n = 25; ● = Period B, n = 18). Some of the points have been plotted with ‘jitter’ to show multiple records with the same numbers of young fledged and EGGDIFF. The trend with EGGDIFF was not significant – see text for details.
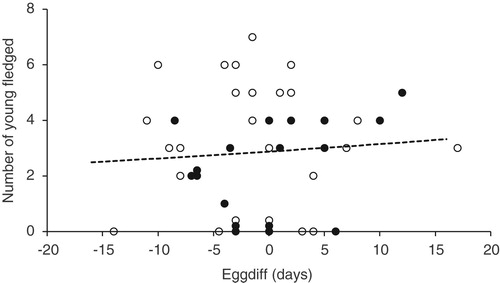
Figure 8. The numbers of young fledged from all nests (including failed nests) against EGGDIFF for Period C (n = 84). Some of the points have been plotted with ‘jitter’ to show multiple records with the same numbers of young fledged and EGGDIFF. The regression was significant (F1 = 5.41, P = 0.02). Full details are given in the text.
Discussion
We provide strong evidence that the productivity of Lesser Spotted Woodpeckers in Britain was higher in the period of stable or increasing population up to 1980 than it is now. The numbers of young fledged per nesting attempt has decreased by about 30% from 3.3 to 2.5. This compares with 3.7 young per nesting attempt in Sweden (Wiktander et al. Citation1994, Citation2001) and 2.7 young in Germany (Rossmanith et al. Citation2007). The RSPB studies between 2006 and 2009 (Charman et al. Citation2012) reported 1.4 young per nesting attempt a particularly low value thought to be related to periods of poor weather in the study years. The mean clutch size has shown no change since the 1960s and is similar to values reported from other studies (Sweden 5.9 eggs, Germany 5.4 eggs, this study 5.3 eggs) (Wiktander et al. Citation1994, Citation2001, Rossmanith et al. Citation2007). The main mechanism limiting productivity appears to be low numbers of fledged young and nest failure mainly during chick rearing. Brood reduction during chick rearing is typical for woodpeckers (Pasinelli Citation2006) but now seems to be particularly marked in the Lesser Spotted Woodpecker in Britain.
Lesser Spotted Woodpeckers have responded to warmer springs by advancing their laying dates. The trend in FED showed a clear break with a slight trend to later nesting up until 1979 followed by a significant trend to earlier nesting through to 2019. This is matched with the pattern in AprCET which showed a break at around the same time when the trend to cooler springs changed to a sustained warming. Although AprCET is a relatively crude measure of spring temperature it seems to be a good predictor of FED over the time span and geographic area covered by these data. Although we think the long-term trend towards earlier spring temperatures has consequences for productivity (see below) we do not believe the change in trend towards warmer springs from about 1980 was the direct cause of the change in population trends of Lesser Spotted Woodpeckers around the same time.
There is clear evidence from the regressions of the numbers of young fledged that the sensitivity to EGGDIFF in Period C is considerably stronger than it was in Periods A & B. Early nests in any particular season are now more productive than late ones. A decrease in the numbers of young fledged with EGGDIFF have been reported for both Lesser and Great Spotted woodpeckers (Rossmanith et al. Citation2007, Wiktander et al. Citation1994, Citation2001, Smith Citation2006) but in all these studies this was largely determined by a decrease in clutch size with EGGDIFF. By contrast in our study, there was no significant decline in clutch size with EGGDIFF so the lower productivity was the result of lower survival of the young in late nests.
It is striking that we found no relationship between numbers fledged and EGGDIFF for periods A & B. In those periods there was no evidence of early nests doing better than late ones. It is possible that limited quality of data from nests in periods A & B has meant that the relationship was masked but the sample size is good and if the relationship was being lost to noise we would expect at least some evidence of a downward trend with EGGDIFF. In fact, what we have seen is a small but non-significant upward trend (). The lack of a downward trend could be related to the super abundance of available food during the main period of Dutch Elm Disease which allowed late nests to be as successful as early ones. It cannot be ruled out that the cooler spring conditions in Periods A and B did not place such a premium on early nesting compared with the current situation with some of the warmest springs on record occurring in recent years.
Previous studies in Britain, Sweden, and Germany have shown that the Lesser Spotted Woodpecker is a late nesting species compared with other woodland birds (Glue & Boswell Citation1994, Wiktander et al. Citation1994, Citation2001, Rossmanith et al. Citation2007). In Britain, the mean FED is about five days later than that of the Great Spotted Woodpecker for instance (Glue & Boswell Citation1994, BTO data in Massimino et al. Citation2019) and this has always been the case – certainly since records were first collected. It is not clear whether this late nesting is the result of a constraint on the timing of egg laying or an adaption to feeding conditions during chick rearing although the former is the most likely. Wiktander et al. (Citation1994) found that FED corresponded to oak Quercus spp. budburst and suggested that the birds depended on the first emergence of defoliating caterpillars before being able to lay their eggs. However, Olsson et al. (Citation1999, Citation2001) showed the birds with access to good foraging resources in early spring nested early suggesting that lay date was limited by early season feeding resources long before oak budburst. Wiktander et al. (Citation1994, Citation2001) suggested that the late nesting ensures that hatching occurs when the defoliating caterpillar abundance is at its peak and the adults can collect prey quickly to provision the young. The suggestion being that the young are particularly vulnerable at this stage as they are small and require constant brooding in an unlined poorly insulated nest. There is some support for the idea that this is a critical period for the young as the evidence from our own observations and others (Wiktander et al. Citation2001) is that much of the brood reduction seems to happen soon after the young hatch. It is only in periods of particularly wet weather that older young are lost (Charman et al. Citation2012). Many other woodland species are thought to time their nesting so that the peak food demand for the young (normally when the young are around 10 days old) matches the spring peak in defoliating caterpillars (Perrins Citation1991, Lundberg & Alatalo Citation1992).
Through the winter and early spring, Lesser Spotted Woodpeckers feed by excavating invertebrates from living and dead wood but when feeding their young they switch to taking surface dwelling invertebrates. (Olsson Citation1998). Török (Citation1990) showed that the diet brought to nestlings was dominated by lepidoptera larvae and aphids Aphidae with the former providing the bulk of the biomass. Rossmanith et al. (Citation2007) showed that the nestling diet was dominated by surface dwelling larvae and craneflies Tipulid spp. for early nests but there was a switch to aphids for the later stages of chick rearing. With their comparatively late nesting season Lesser Spotted Woodpeckers are not as strongly adapted to exploit the spring peak of defoliating caterpillars as other woodland species and are more reliant on other invertebrate prey which may be available later into the season.
Although we have not measured budburst or the temporal patterns of defoliating caterpillars as part of this study it is valuable to compare our FED data with what is known about frass fall (a measure of defoliating caterpillar abundance) in southern England. From 2008 to 2019 frass fall from oak trees was measured in a Hertfordshire wood towards the centre of the Lesser Spotted Woodpecker range in southern England where we found 10 nests in the period 1986–2016 (Smith & Smith Citation2019, Smith pers comm.). On average, over the 12 years where we measured frass, the peak date of frass fall was about two days after the estimated hatch date of our national sample of Lesser Spotted Woodpecker nests. This means at best the young are hatching and developing in a period when the numbers of defoliating caterpillars are falling. However, there was a wide variation in the relative timing of the caterpillar peak from 10 days before the mean hatch date in warm years to 14 days afterwards in cool springs. For tits Cyanistes and Parus spp. and Pied Flycatchers Ficedula hypoleuca, the peak period of food demand is when the young are around 10 days old (Perrins Citation1991, Lundberg & Alatalo Citation1992). By the time young Lesser Spotted Woodpeckers reach this age the availability of defoliating caterpillars will have fallen and the birds will have to switch to other prey.
A further factor leading to late nesting could be inter-specific competition for nest sites. Woodpeckers, including Lesser Spotted, invest considerable time in excavating their nest cavity, often taking two to three weeks to complete the task (Gorman Citation2004). There are many reports through woodpecker-network.org.uk of interactions between Lesser Spotted and Great Spotted Woodpeckers around potential nest sites and there is now growing evidence of Lesser Spotted Woodpecker cavity loss before egg laying to other species such as Blue Tits Cyanistes caeruleus and Marsh Tits Poecile palustris as well as Great Spotted Woodpeckers (Cleverley et al. Citation2019). Similarly, Parry & Broughton (Citation2018) have shown that Willow Tits Poecile montanus suffer significant losses of their first nest cavities to Blue Tits which may be a factor in their decline in Britain. This may be an increasingly important factor for Lesser Spotted Woodpeckers and lead to delayed nesting.
Although Great Spotted Woodpecker numbers have increased considerably over the period of this study (Massimino et al. Citation2019) and they are well known to predate Lesser Spotted Woodpecker nests there is no compelling evidence that this nest predation has increased over time. Our evidence is that loss of chicks, probably to starvation, is the biggest factor in reduced productivity and this is probably linked to food shortages exacerbated by increased mismatch with warm springs.
Lesser Spotted Woodpeckers are often associated with wet woodland (Spitznagel Citation1990, Miranda & Pasinelli Citation2001, Riemer Citation2009, Camprodon et al. Citation2015). It is often suggested that this selection for wet sites is related to the availability of dead and decaying nesting trees such as birch Betula spp. and Alder Alnus glutinosa. But it could also be that with the damp conditions and a diverse range of tree species these habitats provide a more diverse prey base which is available for longer through the breeding season than in drier woodlands. Wetland habitats are known to have a less pronounced spring peak of invertebrate availability compared with woodlands (Both et al. Citation2010) and Shutt et al. (Citation2019) have shown clearly that defoliating caterpillars are available for longer into the breeding season on birch and willows Salix spp. compared with oak trees. These tree species could also be important in the pre-breeding season. Olsson et al. (Citation2001) showed that in Sweden three key prey species were important in the diet of Lesser Spotted Woodpeckers in early spring. The larvae of the moth Argyresthia goedarthella which feed in the bark of small twigs on birch and Alder and are present in early spring and the larvae of the small longhorn beetles (Cerambycidae) Stenostola dubia and Saperda populnae which are found on limes Tilia spp. and Poplars Populus spp. respectively.
We have shown that productivity is at historically low levels, but it is also possible that there could be carry-over effects of this low productivity in reducing annual adult survival. In Sweden, Wiktander (Citation1998) showed that the breeding season was the period of greatest mortality of his colour ringed birds, probably to avian predation, suggesting that this was the period of the year of most risk for adults. This was the case even in a country that experiences severe winter conditions. This suggests that the birds in Britain could well be experiencing reduced adult survival in addition to low breeding success.
The conservation of Lesser Spotted Woodpeckers in Britain is a high priority and these results provide some pointers as to the areas of further study and actions that may help the species. Far more data are required on the diet of birds both in the lead up to breeding but also in the period of chick rearing. The birds are nesting late and are mismatched with the peak availability of defoliating caterpillars. What is their alternative prey and can we improve this by providing a particular mix of tree species? In the pre-breeding period is there anything that can be done to make their FED earlier to improve the synchrony with the spring prey peak of defoliating caterpillars? For instance, supplementary feeding has been shown to make the FED of Great Spotted Woodpeckers earlier and to increase productivity (Smith & Smith Citation2013). Could something similar be achieved with the Lesser Spotted Woodpecker at least on an experimental basis and could this be achieved without increasing nest site interference and predation from generalist woodland species such as Blue Cyanistes caeruleus and Great Tits Parus major and Great Spotted Woodpeckers?
Acknowledgements
We wish to thank all the recorders who have submitted their observations to the BTO Nest Records Scheme over the last 70 years. Carl Barimore extracted the BTO nest record data and Liz Charman and Paul Bellamy helped with the data from the RSPB studies. We especially wish to thank all the observers who have responded to the Woodpecker Network appeal over the last few years increasing the numbers of nests recorded. Ricky Cleverley, Mat Shore, Andy Sims, Gerry Hinchon, Tara Dempsey, Simon Currie, Jack Baddams, Nick Gates, Ben MacDonald, Lewis Thomson, Mark Swann and Rob Clements deserve particular thanks for their dedication to the species and for reporting multiple nests.
References
- Atkinson, G. & Winnall, R.A. 2008. Rejuvenating traditional orchards, how multidisciplinary landscape partnership schemes can serve as a vehicle for restoration – Wyre Forest, West Midlands, United Kingdom. Landsc. Archaeol. Ecol. 7: 19–22.
- Balmer, D.E., Gillings, S., Caffrey, B.J., Swann, R.L., Downie, I.S. & Fuller, R.J. 2013. Bird Atlas 2007-11: the breeding and wintering birds of Britain and Ireland. BTO, Thetford.
- Both, C., Van Turnhout, C.A.M., Bijlsma, R.G., Siepel, H., Van Strien, A.J. & Foppen, R.P.B. 2010. Avian population consequences of climate change are most severe for long-distance migrants in seasonal habitats. Proc. Roy. Soc. B 277: 1259–1266. doi: 10.1098/rspb.2009.1525
- Broughton, R.K., Hill, R.A. & Hinsley, S.A. 2013. Relationships between patterns of habitat cover and the historical distribution of the Marsh Tit, Willow Tit and Lesser Spotted Woodpecker in Britain. Ecol. Inform. 14: 25–30. doi: 10.1016/j.ecoinf.2012.11.012
- Camprodon, J., Faus, J., Salvanyà, P., Soler-Zurita, J. & Luis Romero, J. 2015. Suitability of Poplar Plantations for a cavity-nesting Specialist, the Lesser Spotted Woodpecker Dendrocopos minor, in the Mediterranean Mosaic landscape. Acta Ornithol. 50: 157–169. doi: 10.3161/00016454AO2015.50.2.004
- Charman, E.C., Smith, K.W., Dillon, I.A., Dodd, S., Gruar, D.J., Cristinacce, A., Grice, P.V. & Gregory, R.D. 2012. Drivers of low breeding success in the Lesser Spotted Woodpecker Dendrocopos minor in England – the roles of parental care, weather and interspecific interactions. Bird Study 59: 255–265. doi: 10.1080/00063657.2012.662941
- Charman, E.C., Smith, K.W., Gruar, D.J., Dodd, S. & Grice, P.V. 2010. Characteristics of woods used recently and historically by Lesser Spotted Woodpeckers Dendrocopos minor in England. Ibis 152: 543–555. doi: 10.1111/j.1474-919X.2010.01020.x
- Cleverley, R., Shore, M., Smith, L. & Smith, K. 2019. Observation of a Lesser Spotted Woodpecker losing its nest hole to Marsh Tits. Br. Birds 112: 683–685.
- Cramp, S., ed. 1985. The Birds of the Western Palaearctic, Vol. 4. Oxford University Press, Oxford.
- Crawley, M.J. 2007. The R Book. John Wiley & Sons, Chichester.
- Delahaye, L., Monticelli, D., Lehaire, F., Rondeux, J. & Claessens, H. 2010. Fine-scale habitat selection by two specialist woodpeckers occurring in Beech and Oak-dominated forests in southern Belgium. Ardeola 57: 339–362.
- Eaton, M., Aebischer, N., Brown, A., Hearn, R., Lock, L., Musgrove, A., Noble, D., Stroud, D. & Gregory, R. 2015. Birds of Conservation Concern 4: the population status of birds in the UK, Channel Islands and Isle of Man. Br. Birds 108: 708–746.
- EBCC/BirdLife/RSPB/CSO. 2019. http://pecbms.info accessed December 2019.
- Gibbons, D.W., Reid, J.B. & Chapman, R.A. 1993. The New Atlas of Breeding Birds in Britain and Ireland: 1988–1991. T. & A.D. Poyser, London.
- Gibbs, J.N. 1978. Intercontinental epidemiology of Dutch elm disease. Ann. Rev. Phytopathol. 16: 287–307. doi: 10.1146/annurev.py.16.090178.001443
- Glue, D.E. & Boswell, T. 1994. Comparative nesting ecology of the three British breeding woodpeckers. Br. Birds 87: 253–269.
- Glutz von Blotzheim, U. & Bauer, U.K. 1994. Handbuch der Vögel Mitteleuropas, Band 9. AULA-Verlag GmbH, Wiesbaden.
- Gorman, G. 2004. Woodpeckers of Europe. Chalfont St Peter, Bruce Coleman.
- Hewson, C.M., Amar, A., Lindsell, J.A., Thewlis, R.M., Butler, S., Smith, K.W. & Fuller, R.J. 2007. Recent changes in bird populations in British broadleaved woodland. Ibis 149: 14–28. doi: 10.1111/j.1474-919X.2007.00745.x
- Höntsch, K. 2004. Der Kleinspecht (Picoides minor): Autokologie einer bestandsbedrohten Vogelart im hessischen Vordertaunus. PhD Thesis, University of Frankfurt.
- Lundberg, A. & Alatalo, R.V. 1992. The Pied Flycatcher. T & A D Poyser, London.
- Massimino, D., Woodward, I.D., Hammond, M.J., Harris, S.J., Leech, D.I., Noble, D.G., Walker, R.H., Barimore, C., Dadam, D., Eglington, S.M., Marchant, J.H., Sullivan, M.J.P., Baillie, S.R. & Robinson, R.A. 2019. BirdTrends 2019: trends in numbers, breeding success and survival for UK breeding birds. BTO Research Report 722. BTO, Thetford. www.bto.org/birdtrends.
- Mayfield, H. 1975. Suggestions for calculating nest success. Wilson Bull. 87: 456–466.
- Mikusiński, G. & Angelstam, P. 1997. European woodpeckers and anthropogenic habitat change: a review. Vogelwelt 118: 277–283.
- Mikusiński, G., Gromadzki, M. & Chylarecki, P. 2001. Woodpeckers as indicators of forest bird diversity. Conserv. Biol. 15: 208–217. doi: 10.1046/j.1523-1739.2001.99236.x
- Miranda, B. & Pasinelli, G. 2001. Habitatansprüche des Kleinspechts (Dendrocopos minor) in wäldern der Nordost-Schweiz. J. Ornithol. 142: 295–305.
- Muggeo, V.M.R. 2008. Segmented: an R package to fit regression models with broken-line relationships. R News 8 (1): 20–25.
- Musgrove, A., Aebischer, N., Eaton, M., Hearn, R., Newson, S., Noble, D., Parsons, M., Risely, K. & Stroud, D. 2013. Population estimates of birds in Great Britain and the United Kingdom. Br. Birds 106: 64–100.
- Olsson, O. 1998. Through the eyes of a woodpecker: understanding habitat selection, territory quality and reproductive decisions from individual behaviour. PhD thesis, University of Lund, Lund.
- Olsson, O., Nilsson, I.N., Nilsson, S.G., Pettersson, B., Stagen, A. & Wiktander, U. 1992. Habitat preferences of the Lesser Spotted Woodpecker Dendrocopos minor. Ornis Fenn. 69: 119–125.
- Olsson, O., Wiktander, U., Holmgren, N.M.A. & Nilsson, S.G. 1999. Gaining ecological information about Bayesian foragers through their behaviour. II. A field test with woodpeckers. Oikos 87: 264–276. doi: 10.2307/3546741
- Olsson, O., Wiktander, U., Malmqvist, A. & Nilsson, S.G. 2001. Variability of patch type preferences in relation to resource availability and breeding success in a bird. Oecologia 127: 435–443. doi: 10.1007/s004420000596
- Osborne, P. 1982. Some effects of Dutch elm disease on nesting farmland birds. Bird Study 29: 2–16. doi: 10.1080/00063658209476733
- Osborne, P. 1983. The influence of Dutch elm disease on bird population trends. Bird Study 30: 27–38. doi: 10.1080/00063658309476772
- Parker, D.E., Legg, T.P. & Folland, C.K. 1992. A new daily Central England temperature series, 1772-1991. Int. J. Climatol. 12: 317–342. doi: 10.1002/joc.3370120402
- Parry, W. & Broughton, R.K. 2018. Nesting behaviour and breeding success of Willow Tits Poecile montanus in north-west England. Ringing Migr. 33: 75–85. DOI: 10.1080/03078698.2018.1631610.
- Pasinelli, G. 2006. Population biology of European woodpecker species: a review. Ann. Zool. Fenn. 43: 96–111.
- Pearce-Higgins, J.W. & Green, R.E. 2014. Birds and Climate Change. Cambridge University Press, Cambridge.
- Perrins, C.M. 1991. Tits and their caterpillar food supply. Ibis 133: 49–54. doi: 10.1111/j.1474-919X.1991.tb07668.x
- R Core Team. 2019. R: A Language and Environment for Statistical Computing. R Foundation for Statistical Computing, Vienna, Austria.
- Riemer, S. 2009. Population Densities and Habitat Use of Woodpeckers in a Danube Floodplain Forest in Eastern Austria. Universität Wien.
- Rossmanith, E., Höntsch, K. & Blaum, N. 2007. Reproductive success and nestling diet in the Lesser Spotted Woodpecker (Picoides minor): the early bird gets the caterpillar. J. Ornithol. 148: 323–332. doi: 10.1007/s10336-007-0134-4
- Sharrock, J.T.R. 1976. The Atlas of Breeding Birds in Britain and Ireland. BTO/IWC, Tring, Hertfordshire, UK.
- Shutt, J.D., Burgess, M.D. & Phillimore, A.B. 2019. A spatial perspective on the phenological distribution of the spring woodland caterpillar peak. Am. Nat. 194: 109–121. doi: 10.1086/705241
- Smith, K.W., Butcher, N. & Eddowes, M. 2006. Using video cameras to inspect nest contents. Nest Record News 22: 14–15.
- Smith, K.W. 2006. The implications of nest site competition from starlings Sturnus vulgaris and the effect of spring temperatures on the timing and breeding performance of great spotted woodpeckers Dendrocopos major in southern England. Ann. Zool. Fenn. 43: 177–185.
- Smith, K.W. & Charman, E.C. 2012. The ecology and conservation of the Lesser Spotted Woodpecker. Br. Birds 105: 294–307.
- Smith, K.W. & Smith, L. 2013. The effect of supplementary feeding in early spring on the breeding performance of the Great Spotted Woodpecker Dendrocopos major. Bird Study 60: 169–175. doi: 10.1080/00063657.2013.776004
- Smith, K.W. & Smith, L. 2019. Does the abundance and timing of defoliating caterpillars influence the nest survival and productivity of the Great Spotted Woodpecker Dendrocopos major. Bird Study 66: 187–197. doi: 10.1080/00063657.2019.1637396
- Spitznagel, A. 1990. The influence of forest management on woodpecker density and habitat use in floodplain forests of the upper Rhine valley. In A. Carlson & G. Aulén. (ed) Conservation and Management of Woodpecker Populations, 117–145. Swedish University of Agricultural Sciences. Department of Wildlife Ecology, Uppsala.
- Török, J. 1990. Resource partitioning among three woodpecker species Dendrocopos spp during the breeding season. Holarct. Ecol. 13: 257–264.
- Wiktander, U., Nilsson, S.G., Olsson, O. & Stagen, A. 1994. Breeding success of a Lesser Spotted Woodpecker Dendrocopos minor population. Ibis 136: 318–322. doi: 10.1111/j.1474-919X.1994.tb01101.x
- Wiktander, U. 1998. Reproduction and survival in the lesser spotted woodpecker - effects of life history, mating system and age. PhD Thesis, Lund University, Lund.
- Wiktander, U., Olsson, O. & Nilsson, S.G. 2001. Annual and seasonal reproductive trends in the Lesser Spotted Woodpecker Dendrocopos minor. Ibis 143: 72–82. doi: 10.1111/j.1474-919X.2001.tb04171.x
- Winnall, R. 2001. Woodpeckers of Rock Coppice. Wyre Forest Study Group Review 2001, 25–31.
- Woodward, I., Aebischer, N., Burnell, D., Eaton, M., Frost, T., Hall, C., Stroud, D. & Noble, D. 2020. Population estimates of birds in Great Britain and the United Kingdom. Br. Birds 113: 69–104.