
ABSTRACT
Capsule: Linear censusing and occupancy models based on fixed sampling points are alternative widely used techniques to determine bird densities in riparian ecosystems, although it cannot be always properly executed.
Aims: The aim is to assess the survey efficiency for river birds using occupancy models in contexts of impaired visibility owing to dense vegetation along the banks.
Methods: We tested whether increasing sampling periods within each survey unit (point) at occupancy models would result in increasing detection probability values. We used two approaches in order to identify the ‘best’ design for White-throated Dippers Cinclus cinclus along forested river stretches: minimizing survey effort of standard single-season site occupancy modelling and exploratory power analysis.
Results: With a detection probability of 0.26 (i.e. much lower than in previous studies), a design with 60 sites surveyed 10 min 6 times a year would be the option to survey White-throated Dippers in forested habitats if an acceptable power is required. Simulations further revealed the consistency of the results.
Conclusion: We provide guidelines to establish a cost-effective survey design for any long-term monitoring citizen-based programme of a White-throated Dipper population when detection probabilities are low. A strength and novelty of the method is to take advantage of advanced probabilistic approaches (e.g. GRTS) to select the survey sites providing, among other major interests, a spatially balanced geographic coverage.
The implementation of accurate sampling methods is crucial for a proper estimation of the occurrence and population size of a certain species in an area and its potential long-term evolution (Bibby et al. Citation2000). At the same time, however, reducing the sampling effort to an optimal minimum is desirable, especially in long-term monitoring programmes where there is no possibility to invest huge amounts of money and human-resources, as happens in many citizen-science based surveys (Devictor et al. Citation2010, Jiguet et al. Citation2012). Therefore, a balance between high accuracy and low sampling effort is a recurrent need during the design of long-term monitoring programmes. Good environmental monitoring and decision making relies, among other things, on formulating good questions as well as strong partnerships between different actors including scientists, policy-makers and managers (Lindenmayer & Likens Citation2010) to which we can add a good survey design (Legg & Nagy Citation2006). Spatially balanced sampling is becoming a popular design for surveys in biological and environmental management because it ensures acceptable spatial coverage resulting in a satisfactory representation of the population of interest (Brown et al. Citation2015, Kermorvant et al. Citation2019a, Citationb).
Linear censusing is a widely used technique to determine bird densities in riparian ecosystems (Vaughan et al. Citation2007). However, for a survey to be effective, the species needs to have a relatively high visibility (Peris et al. Citation1991). When the river banks are covered by dense foliage and/or the observer is forced to wade along the river because there is no possibility to walk along the bank, an effective census can become difficult or impossible. Alternatively, occupancy models based on fixed sampling points have been shown to be very useful for monitoring different aspects of riparian bird populations (Ormerod et al. Citation1986, D'Amico & Hemery Citation2003, Charbonnel et al. Citation2014). Overall, these models allow estimating jointly the probability of detection (p) and the probability of occupation (ψ) (MacKenzie et al. Citation2003a). The estimation of ψ and its change over time is useful to assess parameters such as long-term population trends, colonization and local extinction rates (MacKenzie et al. Citation2003a).
The White-throated Dipper Cinclus cinclus (hereafter, Dipper) is a Palaearctic riparian songbird that specializes in breeding in well-preserved freshwater streams (Tyler & Ormerod Citation1994). Previous works based on occupancy models (D’Amico, unpublished) and linear censusing techniques reported that three visits were sufficient to detect all the Dipper pairs that could be breeding in a given river stretch, and even 2 visits would enable a probability of detection of over 0.95 (D'Amico & Hemery Citation2003). However, these tests were carried out in a zone with rivers having bare banks, with no or low densities of trees, which increases bird detection probability. The application of this method to other areas might be interesting to implement long-term Dipper population monitoring programmes, which is of conservation interest in a species of concern in some European countries (Tucker & Heath Citation2004), including Spain. Without a proper test, especially in areas with dense riparian vegetation, a direct implementation of the method may provide unreliable or erroneous results. As clearly stated already (Mackenzie & Royle Citation2005, Guillera-Arroita et al. Citation2010), the design of an occupancy survey should ideally start with clear statements of the project requirements both in terms of the quality of estimators (e.g. maximum authorized variance) and total survey effort available. Optimal design can be built to alternatively (1) maximize the quality (performance) of estimators or (2) minimize the effort engaged. In the context of our study we aimed at lowering the effort made while maintaining a quality threshold of moderate intensity. Moreover, especially when the survey is built on a long-term basis to assess temporal trends in occupancy status (McKann et al. Citation2013), the aim of detecting potential variation in the spatial and temporal occupancy estimation cannot be ignored (Guillera-Arroita & Lahoz-Monfort Citation2012). The underlying challenge to design a survey is thus to overcome the capacity to detect a difference in occupancy status between two samples with a given power, knowing that species detection of river birds along forested stream networks is undoubtedly very low. Power analysis can be made either using closed formulae or simulations, as proposed by Guillera-Arroita & Lahoz-Monfort (Citation2012), which provides the required sample size (number of sites to survey) given power. Closed formulae may be a good option for surveyors because they are straightforward and simple analytical expressions that are easy to use and require basic skills in statistics; however, such mathematical expressions (see equation 4 in Guillera-Arroita & Lahoz-Monfort Citation2012) are based on approximations and provide only low bounded estimates. Simulation does not have this shortcoming but requires advanced skills in statistics which can deter some field surveyors.
The aim of this paper is to assess the census efficiency for river birds using occupancy models in contexts of impaired visibility owing to dense vegetation along the banks. Our test thus contributes to the implementation of this type of model to monitor riparian species of birds when there is poor visibility (i.e. low detectability), focusing on having a good balance between reaching estimators as accurate as possible, although investing a moderate sampling effort in order to design long-term sustainable sampling protocols. Specifically, using both closed formulae and simulation, we tested whether increasing sampling period within each survey unit (point) at occupancy models would result in increasing p values (a topic seldom addressed even in papers specifically dealing with components affecting detection probabilities; Fletcher & Hutto Citation2006, Schmidt et al. Citation2013), which would allow to reduce the number of sampling points significantly and lower the cost of any long-term monitoring programme. The overall aim is to facilitate the implementation of any species survey network in homogenous and dense habitats, for example in the context of citizen science involvement on a long-term basis.
Methods
Study area and data collection
This study was carried out in the province of Gipuzkoa, northern Spain. Extended within an area of approximately 1980 km2, the altitude of Gipuzkoa ranges from 0 to 1550 m above sea level and the mean annual precipitation (mostly as rainfall) is close to 1500 mm. The main rivers of Gipuzkoa flow across a south–north axis into the Bay of Biscay, whilst, overall, their subsidiaries flow across east–west or west–east (). The main rivers have a mean length slightly longer than 50 km and the mean flow is 12 m3/s (source: Gipuzkoa Administration; www.gipuzkoa.eus). The Dipper breeds in the upper zones of these rivers and mostly in the subsidiary rivers and brooks that flow into them (Aierbe et al. Citation2001). Generally, banks of these rivers, especially when the Dipper breeds, are covered by dense and homogeneous riparian vegetation, providing suitable conditions for the purpose of this study.
Figure 1. The province of Gipuzkoa and its main rivers and first-order subsidiaries. The dots are the 60 randomly and spatially balanced GRTS survey points. See text and online Appendix S2 for details on site selection procedure.
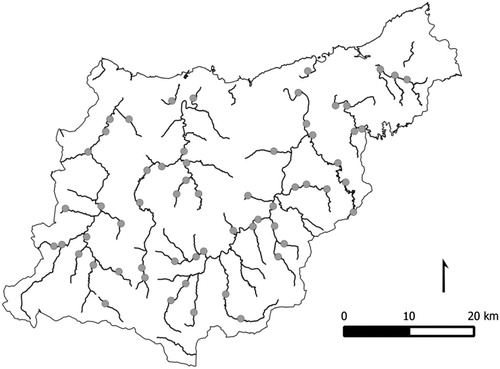
Field work was carried out in 2015 and 2016. The number of sampling points was set following the occupancy survey design procedure described in the literature and using the software tool SODA (Single-season Occupancy study Design Assistant) or alternatively its analytical codes to search a suitable design (Guillera-Arroita et al. Citation2010). To do so, initial (tentative) values for the parameters (here ψ and p) to be assessed were required. These parameters can be derived from results of a pilot study or studies carried out for the same or similar species in comparable circumstances or on expert opinion. In our case, we used as reference values those obtained in previous publications (D'Amico & Hemery Citation2003) on the same species in a nearby region within the Pyrenees, where p is high. According to this pilot simulation, a combination of 60 points with 6 visits at each point was found to be an optimal design to survey the Dipper occurrence along Gipuzkoa rivers. To ensure a representative coverage of the whole study area and get robust statistical results, it is advised to use a spatially balanced survey design (Kermorvant et al. 2019). Among the different methods available (Wang et al. Citation2012), we chose the most broadly used, namely Generalized Random Tessellation Stratified sampling (GRTS), originally developed by Stevens & Olsen (Citation2004) and reviewed in Kermorvant et al. 2019. Briefly, in this design an invertible mapping technique is used to transform and generate a systematic sample along a one-dimensional linear representation where points are selected using Brewer and Hanif’s method (Citation1983) before mapping back the resulting spatially balanced sampling points in the two-dimensional original space. Survey sites were drawn using the command ‘grts’ in the R package ‘spsurvey’ (Kincaid & Olsen Citation2019) which selects a sample using a GRTS survey design and offers several options such as provisioning for an oversample. The 60 randomly spatially balanced points (sites) were situated all along the main and first-order subsidiary rivers of Gipuzkoa (). Reservoirs and low part, tide-influenced, river stretches close to their mouth were removed from this analysis.
Each year, we conducted 6 visits (one per fortnight) from March to May at each sampling site. At each site, the observer remained still on the bank and noted the presence of Dipper individuals during a given period of 10 min (year 2015) or 20 min (year 2016). Only adult birds were considered for the analyses as we were interested in estimating parameters relative to the breeding population and not on birds that might be in dispersal processes (as could be in some first-year birds that might be already seen in May). The visits at each site were carried out during the morning, almost always within a period of 2 h starting at dawn, when the birds were more active.
Statistical models for occupancy assessment
Using data on the presence and absence (or better stated: detection / non detection data) of Dippers (coded as 1 or 0, respectively), we calculated the probability of detection (p) and the probability of occupation (psi, ψ) separately. The function occu in the R-package ‘unmarked’ (Fiske & Chandler Citation2011) was used to obtain maximum likelihood estimates (MLE) of the two parameters (ψ and p). Apart from the bird survey itself, to assess homogeneity of the dense forested environment, we recorded for each site the QBR index (Qualitat del Bosc de Ribera index or riparian forest index), used to assess the quality of riparian forest vegetation in rivers (Munne et al. Citation2003) and additional information with 7 environmental variables describing the habitat (see online supplementary Appendix S1)
Assessment of performance of occupancy estimators
Using actual values derived from surveys made in 2015 and 2016, we estimated the performance (assessed both through bias and variance) of ψ in an a posteriori analysis to check what would have been the optimal survey design. We set a quality threshold of 0.056 for the variance and subsequently made a simulation to see the effect of varying the number of sites on ψ under the two conditions (i.e. under 10- and 20-minute survey effort condition) using the SODA software assuming asymptotic convergence (variance = MSE), with 1000 iterations, choosing the ‘test design’ option as detailed in Guillera-Arroita et al. (Citation2010).
Power and associated design trade-offs
To explore related design trade-offs (i.e. discuss between decreasing the number of sites to survey or temporal survey replicates within each site in a season) we used tools for power analysis applied in studies aiming at detecting occupancy differences under imperfect detection (Guillera-Arroita & Lahoz-Monfort Citation2012). The power of a statistical test is the probability of detecting an effect, given there is an effect. A significance level commonly chosen in statistical tests is 0.05 (α = 0.05), and in terms of power, levels around 0.8 are often used. In this study, we use two values for alpha (α = 0.05 and α = 0.10) because, in practice, α-values may reflect the relative seriousness of Type I and II errors. When the condition of asymptotic approximations is satisfied, formula in closed form conveniently allow determining the sample size required to detect a difference in occupancy with a given power (here 0.8). R stands for this proportional difference in occupancy from t to t+1, so that ψt+1 = ψt × (1 – R), with R > 0 representing a decline (so R < 0 an increase). When parameter estimates of ψ and p are imprecise or, as shown above, when initial values for the parameters are taken from other study cases and likely to be somewhat different (e.g. because the habitat is different), then a simulation approach is needed to adequately assess power. For sake of simplicity, only results obtained using closed formulae are presented and discussed whereas the simulation approach is provided in online supplementary Appendix S2.
Results
From 57 sampling points surveyed in total (3 points were rejected due to the lack of data on the QBR index), we detected the presence of Dippers in 26 points (45.6%) which represents the naïve occupancy estimate.
Parameter estimates
Overall, we did not find significant differences between the selected factors associated with habitat quality in zones with and without detected Dippers, indicating as expected a rather uniform environment between survey points (full explanatory details in online Appendix S1).
Considering a 10-minutes survey effort, model averaged estimates resulted in a mean ψ = 0.512 (CI = 0.147–0.865), and a mean p = 0.273 (CI = 0.191–0.370), which are close to the estimates from the constant model with a mean ψ = 0.519 (CI = 0.348–0.685), and a mean p = 0.264 (CI = 0.185–0.361). Doubling the survey effort (i.e. 20-minutes survey effort) almost resulted in a doubling of the detection probability (p = 0.518, CI = 0.387–0.647).
Optimal design
Under a 10-minute survey effort, assuming a quality (variance) threshold of 0.056 and a total survey effort of 360 (6 visits × 60 sites), the assistant SODA did not give a single optimal design, but the following alternative suggested designs: (1) K = 6 visits, S = 60 sites (providing a simulated variance = 0.007) or (2) K = 7 visits, S = 51 sites (also providing a simulated variance = 0.007). Under a 20-minute survey effort condition, with a proportional survey effort (180, just a half of that required for the 10-minute survey), there was still no optimal design as reported by SODA, but an alternative suggested design of K = 3 visits and S = 60 sites, providing a simulated variance of 0.006.
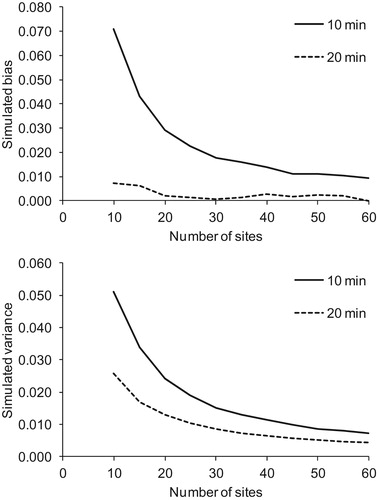
Increasing the number of sites surveyed also enhances performance () and a survey of 20 min allowed us to minimize simulated positive bias well below a value of 0.01. As for the bias, a tremendous decrease of variance is observed with an increasing survey effort, and again the effect is much stronger when considering a 20-minute survey (). It is noteworthy to state that MSE values (data not shown) are equal to variance values only when surveys last for 20 min but differ somewhat when surveys last for 10 min, indicating that asymptotic conditions are only met under the larger effort of 20 min (Guillera-Arroita & Lahoz-Monfort Citation2012).
Figure 2. Simulated effects of decreasing the number of survey sites on model performance in relation to sampling time per site and day (10 or 20 min). Above: effects on bias; Below: effects on variance. Total number of visits kept constant (K = 6 visits).
Power analysis
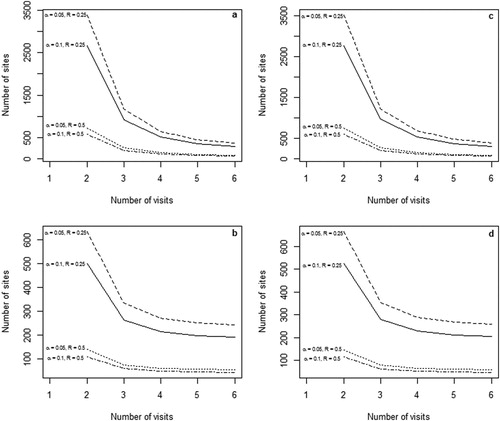
Whatever the detection probability (p = 0.27 or p = 0.51) and the significance level (α = 0.05 or α = 0.10), the curves tend to reach an asymptote with increasing number of visits. Moreover, the results are consistent whether either empirical values (data collected in 2015 and 2016) or theoretical values (simulation) were used. The requested number of survey sites to reach a power of 0.8 increased with smaller values of R (). When detection is low (p = 0.27), the number of sites required would reach a value prohibitively high (over 1000) if number of visits is 3 or less ().
Figure 3. Number of requested sampling sites (S) to reach a power of 0.8 to detect either moderate (R = 0.25) or strong (R = 0.50) occupancy declines considering a variable number of survey visits (K) as well as significance levels of α = 0.05 or 0.010. Empirical (A,B) and simulated (C,D) values for two situations are considered: (A) observed initial occupancy for Dippers is ψ = 0.51 and detection probability is p = 0.27 (as found in 2015 for surveys lasting 10 min); (B) observed initial occupancy for Dippers is ψ = 0.51 and detection probability is p = 0.51 (as found in 2016 for surveys lasting 20 min); (C) simulated initial occupancy for Dippers is ψ = 0.51 and detection probability is p = 0.27; (D) observed initial occupancy for Dippers is ψ = 0.51 and detection probability is p = 0.51. A varying scale is used for the y-axis to allow detailed comparison.
Discussion
This is the first study aiming to estimate ψ and p parameters within a Dipper population breeding in rivers with low detectability. Previous studies carried out in other parts of Europe (such as France and the United Kingdom) provided p values over 0.5 (D'Amico & Hemery Citation2003), which are well above the mean obtained in Gipuzkoa (0.27) as expected in this kind of forested habitat with dense vegetation along the river banks. This contrasts somewhat with other studies carried out with other river bird species (Fletcher & Hutto Citation2006) or strictly specialist river species where p estimation was influenced by habitat features, as revealed by a recent survey with the Pyrenean Desman Galemys pyrenaicus, a highly elusive river mammal (Charbonnel et al. Citation2014, Charbonnel et al. Citation2015).
The main goal was to investigate the strengths and weaknesses of a method allowing to identify the ‘best’ design to survey a river bird species (here the Dipper) when detectability is low because of habitat obscuring visibility (here along forested river stretches). Combination of a minimizing approach from standard single-season site occupancy modelling and an exploratory power analyses using both closed formulae and simulation makes the bulk of the framework. Derived from a pilot simulation, a combination of 60 points with 6 visits lasting 10 min at each point was expected to be an optimal design to survey the Dipper occupancy along Gipuzkoa rivers. This total survey effort of 3600 (6 visits × 10 min × 60 sites) represented also a satisfactory trade-off between quality of estimations and feasibility of the study in the field (including distances between survey sites and availability of voluntary field observers), but the calculations did not give a single optimal design if a quality threshold of 0.056 (variance) was to be met. Six visits lasting 10 min at 60 sites provided the same quality (variance = 0.07) as seven visits made at 51 sites. Increasing the duration of each field survey to 20 min provided a tenuous gain in quality (variance = 0.06) but would bring some gain in overall survey cost as fewer visits would be required for the same survey effort of 3600 (3 visits x 20 min × 60 sites).
However, given these logistical constraints (S = 60 sites), it would be impossible to detect low to moderate variations (R < 0.25) in occupancy from year to year, even when a higher value of alpha (α = 0.10) is authorized. By contrast, moderate to high turn-over in occupancy status (R > 0.50) would be easily detected even with a low value of alpha (α = 0.05). In this latter case, it would be preferable to survey 60 sites and make at least 4 visits; if a higher alpha value is accepted (α = 0.10), then surveying 40 sites 4–5 times a year could even be efficient. It is well known that for a given temporal change in occupancy status (noted R above; Box 1) or change in space (e.g. does occupancy status differ between regions?), power increases as the number of sampling sites increase and as the number of replicates also increase (Sewell et al. Citation2012) but this is generally at a prohibitive cost, well above what can be afforded in the framework of a citizen science involvement on a long-term basis. Eventually, we conclude that a design with an effort of 60 survey points, surveyed 10 min 6 times per season may reach an acceptable statistical power; ‘downgrading’ (i.e. accepting a weaker power and increasing alpha value) the design to 30–40 sites surveyed 20 min 4–5 times a year would be at a high price: risking of accepting more false positives being also probably unable to significantly detect long-term or between-regional changes in occupancy.
Imagine that an occupancy survey made in 2017 (whatever the survey effort) gave an initial occupancy (ψ1) of 0.9, and that the following year, the subsequent occupancy (ψ2) was 0.7, then the difference was ψ2−ψ1 = 0.2.
In the context of the study the task is to detect this difference of 0.2, and the power of the statistical test is the probability of detecting such an effect. In this case, R is the proportional difference in occupancy, and it is equal to the rounded value of 0.2; being positive, this describes a decline in occupancy between the two years, as defined above. Likewise, with a same initial occupancy (ψ1 = 0.9), a value of R = 0.5 would correspond to a stronger decline with ψ2 = 0.4 (ψ2−ψ1 = 0.5).
Monitoring a bird population at 60 sites surveyed 6 times during a single breeding season might seem for most citizen ornithologist much more ambitious and heavier than what is commonly done. Moreover, judging from performance and power capabilities, there is every reason to believe that the results do not match expectations and the reliability leaves something to be desired. However, it should be kept in mind that this study deliberately deals with difficult field conditions, in a dense and wooded environment, in which the bird species is hard to detect. Under these unfavourable conditions, however, our study reassures that it is possible to conduct a robust study nonetheless.
If optimal design assessment and power analysis are both useful and necessary approaches, it must be recognized too that they are still imperfect approaches. They must be considered exploratory tools providing only an indication on the magnitude of the problem to be solved (for example how many sampling sites should be surveyed in an optimal design?) rather than the exact solution. It is reassuring to see that both closed formulae and simulation provides similar meaningful information that must serve, eventually, in the process of final decision-making on the optimal design, which is always a compromise between practicalities and science resulting necessarily in a realistic and affordable sample size for the design. These apparent weaknesses and limitations should not undermine our confidence in this approach based on the search for an optimal design, an approach that will seem, wrongly, too complex for many users. One must not be deterred: in the end, a weakness in design is not a major issue and will still lead to comparable results.
Also, the information used to decide what should be an acceptable or optimal survey design should make sense in terms not only of number of sites and number of visits, but also on the time effort to allow for each survey (here the time spent, be it 10 or 20 min, if seeking to increase detection probability). That considered, it does not answer the question: where sites should be located in the survey region? This is an often neglected issue in the process of designing a field survey, as it is common for ecologists to choose the locations of sampling units haphazardly rather than using a properly random sampling design (Smith et al. Citation2017) or, even better, an advanced sampling design (Kermorvant et al. Citation2020). A strength, and a novelty, of our study was to first select the survey sites using a recent advanced probabilistic approach (GRTS) providing, among other major interests, a spatially balanced geographic coverage (Brown et al. Citation2015), as well as better performance than simple random sampling, allowing us to achieve a similar accuracy with a decreasing sampling intensity as compared to a simple random sampling design (Kermorvant et al. 2019). We thus advocate the use of both model-based and design-based approaches by first selecting spatially balanced survey sites (Kermorvant et al. 2019 for a recent review of the properties of those designs and their practical implementation) and then relying on a class of hierarchical models called ‘site-occupancy models’ – also known as zero-inflated binomial models – introduced independently by MacKenzie et al. (Citation2003b) and Tyre et al. (Citation1994). As a whole, this mixed approach is an extremely flexible modelling framework that should increase the performance quality of estimators.
Supplemental Material
Download MS Word (30.6 KB)Supplemental Material
Download MS Word (30.6 KB)Acknowledgements
This study was carried out thanks to the collaboration of many people (observers): A. Arnaiz, A. Díez, A. Erkiaga, A. Galdos, A. Urruzola, E. Iriarte, F. Ansorregi, H. Beñaran, J. Amundarain, J. Etxezarreta, J. I. Jauregi, J. Ugarte, L. Arbeola, N. Pagaldai, T. Aierbe, X. Saralegi. The research was partly funded by the Gipuzkoa Administration and the Basque Government. We thank Steve Ormerod for valuable advice made on a former draft of the manuscript.
Additional information
Funding
References
- Aierbe, T., Olano, M. & Vázquez, J. 2001. Atlas de las aves nidificantes de Gipuzkoa. Munibe 52: 5–138 (Suppl).
- Bibby, C.J., Burgess, N., Hill, D.A. & Mustoe, S.H. 2000. Bird Census Techniques. Academic Press, London.
- Brewer, K.R.W. & Hanif, M. 1983. Sampling with Unequal Probabilities. Lecture Notes in Statistics. Springer-Verlag, New York.
- Brown, J.A., Robertson, B.L. & McDonald, T. 2015. Spatially balanced sampling: application to environmental surveys. Proc. Environ. Sci. 27: 6–9. doi: 10.1016/j.proenv.2015.07.108
- Burnham, K.P. & Anderson, D.R. 1998. Model Selection and Inference. A Practical Information Theoretic Approach. Springer-Verlag, New York.
- Charbonnel, A., Buisson, L., Biffi, M., D’Amico, F., Besnard, A., Aulagnier, S., Blanc, F., Gillet, F., Lacaze, V., Michaux, J.R., Némoz, M., Pagé, C., Sanchez-Perez, J.M., Sauvage, S. & Laffaille, P. 2015. Integrating hydrological features and genetically validated occurrence data in occupancy modeling of an endemic and endangered semi-aquatic mammal, Galemys pyrenaicus, in a Pyrenean catchment. Biol. Conserv. 184: 182–192. doi: 10.1016/j.biocon.2015.01.019
- Charbonnel, A., D'Amico, F., Besnard, A., Blanc, F., Buisson, L., Némoz, M. & Laffaille, P. 2014. Spatial replicates as an alternative to temporal replicates for occupancy modelling when surveys are based on linear features of the landscape. J. Appl. Ecol. 51: 1425–1433. doi: 10.1111/1365-2664.12301
- D'Amico, F. & Hemery, G. 2003. Calculating census efficiency for river birds: a case study with the White-throated Dipper cinclus cinclus in the Pyrenees. Ibis 145: 83–86. doi: 10.1046/j.1474-919X.2003.00108.x
- Devictor, V., Whittaker, R.J. & Beltrame, C. 2010. Beyond scarcity: citizen science programmes as useful tools for conservation biogeography. Divers. Distrib. 16: 354–362. doi: 10.1111/j.1472-4642.2009.00615.x
- Fiske, I. & Chandler, R. 2011. Unmarked: An R Package for Fitting Hierarchical Models of Wildlife Occurrence and Abundance. 43:23.
- Fletcher, R.J. & Hutto, R.L. 2006. Estimating detection probablities of river birds using double surveys. Auk 123: 695–707. doi: 10.1093/auk/123.3.695
- Guillera-Arroita, G. & Lahoz-Monfort, J.J. 2012. Designing studies to detect differences in species occupancy: power analysis under imperfect detection. Methods in Ecology and Evolution 3: 860–869. doi: 10.1111/j.2041-210X.2012.00225.x
- Guillera-Arroita, G., Ridout, M.S. & Morgan, B.J.T. 2010. Design of occupancy studies with imperfect detection. Methods in Ecology and Evolution 1: 131–139. doi: 10.1111/j.2041-210X.2010.00017.x
- Jiguet, F., Devictor, V., Julliard, R. & Couvet, D. 2012. French citizens monitoring ordinary birds provide tools for conservation and ecological sciences. Acta Oecol. 44: 58–66. doi: 10.1016/j.actao.2011.05.003
- Kermorvant, C., Caill-Milly, N., Bru, N. & D’Amico, F. 2019a. Optimizing cost-efficiency of long term monitoring programs by using spatially balanced sampling designs: The case of Manila clams in Arcachon bay. Ecol. Inform. 49: 32–39. doi:10.1016/j.ecoinf.2018.11 doi: 10.1016/j.ecoinf.2018.11.005
- Kermorvant, C., Coube, S., D'Amico, F., Bru, N. & Caill-Milly, N. 2020. Sequential process to choose efficient sampling design based on partial prior information data and simulations. Spatial Statistics 38: 100439. doi:10.1016/j.spasta.2020.100439.
- Kermorvant, C., D’Amico, F., Bru, N., Caill-Milly, N. & Robertson, B. 2019b. Spatially balanced sampling designs for environmental surveys. Environ. Monit. Assess. 191 (8): 524. doi:10.1007/s10661-019-7666-y.005 doi: 10.1007/s10661-019-7666-y
- Kincaid, T.M. & Olsen, A.R. 2019. Spsurvey: spatial survey design and analysis. R Package Version 4.0.0.
- Legg, C.J. & Nagy, L. 2006. Why most conservation monitoring is, but need not be, a waste of time. J. Environ. Manag. 78: 194–199. doi: 10.1016/j.jenvman.2005.04.016
- Lindenmayer, D.B. & Likens, G.E. 2010. The science and application of ecological monitoring. Biol. Conserv. 143: 1317–1328. doi: 10.1016/j.biocon.2010.02.013
- MacKenzie, D.I., Nichols, J.D., Hines, J.E., Knutson, M.G. & Franklin, A.B. 2003a. Estimating site occupancy, colonization, and local extinction when a species is detected imperfectly. Ecology 84: 2200–2207. doi: 10.1890/02-3090
- MacKenzie, D.I., Nichols, J.D., Hines, J.E., Knutson, M.G. & Franklin, A.B. 2003b. Estimating site occupancy, colonization, and local extinction when a species is detected imperfectly. Ecology 84: 2200–2207. doi: 10.1890/02-3090
- Mackenzie, D.I. & Royle, J.A. 2005. Designing occupancy studies: general advice and allocating survey effort. J. Appl. Ecol. 42: 1105–1114. doi: 10.1111/j.1365-2664.2005.01098.x
- McKann, P.C., Gray, B.R. & Thogmartin, W.E. 2013. Small sample bias in dynamic occupancy models. J. Wildl. Manage. 77: 172–180. doi: 10.1002/jwmg.433
- Munne, A., Prat, N., Sola, C., Bonada, N. & Rieradevall, R. 2003. A simple field method for assessing the ecological quality of riparian habitat in rivers ans streams: QBR index. Aquatic Conservation: Marine and Freshwater Ecosystems 13: 147–163. doi: 10.1002/aqc.529
- Ormerod, S.J., Allinson, N., Hudson, D. & Tyler, S.J. 1986. The distribution of breeding dippers (Cinclus cinclus (L), Aves) in relation to stream acidity in upland Wales. Freshw. Biol. 16: 501–507. doi: 10.1111/j.1365-2427.1986.tb00993.x
- Peris, S.J., González-Sánchez, N., Carnero, J.I., Velasco, J.C. & Masa, A.I. 1991. Algunos factores que inciden en la densidad y poblacióon del mirlo acuático (Cinclus cinclus) en el centro-occidente de la Península Ibérica. Ardeola 38: 11–20.
- Schmidt, J.H., McIntyre, C.L. & MacCluskie, M.C. 2013. Accounting for incomplete detection: what are we estimating and how might it affect long-term passerine monitoring programs? Biol. Conserv. 160: 130–139. doi: 10.1016/j.biocon.2013.01.007
- Sewell, D., Guillera-Arroita, G., Griffiths, R.A. & Beebee, T.J.C. 2012. When is a species declining? Optimizing survey effort to detect population changes in reptiles. Plos One 7: e43387. doi: 10.1371/journal.pone.0043387
- Smith, A.N.H., Anderson, M.J. & Pawley, M.D.M. 2017. Could ecologists be more random? straightforward alternatives to haphazard spatial sampling. Ecography 40: 1251–1255. doi: 10.1111/ecog.02821
- Stevens, D.L. Jr.& Olsen, A.R. 2004. Spatially-balanced sampling of natural resources. Journal of American Statistical Association 99: 262–278. doi: 10.1198/016214504000000250
- Tucker, G.M. & Heath, M.F. 2004. Birds in Europe: Population Estimates, Trends and Conservation Status. BirdLife International, Cambridge.
- Tyler, S.J. & Ormerod, S.J. 1994. The Dippers. T & A. D. Poyser, London.
- Vaughan, I.P., Noble, D.G. & Ormerod, S.J. 2007. Combining surveys of river habitats and river birds to appraise riverine hydromorphology. Freshw. Biol. 52: 2270–2284. doi: 10.1111/j.1365-2427.2007.01837.x
- Wang, J.-F., Stein, A., Gao, B.-B. & Ge, Y. 2012. A review of spatial sampling. Spat. Stat. 2: 1–14. doi: 10.1016/j.spasta.2012.08.001