
 ?Mathematical formulae have been encoded as MathML and are displayed in this HTML version using MathJax in order to improve their display. Uncheck the box to turn MathJax off. This feature requires Javascript. Click on a formula to zoom.
ABSTRACT
Capsule
The increase in autumn sowing of crops is probably an additional contributory factor to the national ban on lead angling weights in influencing the large increase in British Mute Swan Cygnus olor numbers since the 1970s.
Aims
The national population of Mute Swans in Great Britain has more than doubled since the 1970s, and previous correlative analyses of national population changes identified a national ban on lead angling weights in 1987 as the main driver of this change. We examine regional variation in Mute Swan population changes to test the contribution of additional environmental covariates to the observed increase.
Methods
We explore regional and national variation in Mute Swan population trends to changes in climate, agriculture, water quality, and angling to assess whether the same patterns emerge at different scales.
Results
Changes in the extent of oilseed rape and wheat, which provide winter food for Mute Swans, showed a consistent positive association with the spatial and temporal pattern of Mute Swan population trends, while a proxy for the expected change in the exposure of swans to lead weights from angling contributed much less.
Conclusion
The lead weight ban occurred alongside rapid changes in arable cropping area, with swans probably benefitting from both increased food resources and reduced rates of lead ingestion. Our study highlights the value of exploiting both spatial and temporal variation in abundance when exploring potential drivers of population change. Future changes in agricultural policy and practice in Great Britain may influence Mute Swan populations.
Identifying environmental changes that influence the abundance and distribution of wild species is necessary for the development of effective conservation policy and practice (Baillie Citation2001). Several drivers of change often act simultaneously on a population, and it is sometimes difficult to quantify their relative importance (Green Citation1995, Citation2002, Bowler et al. Citation2018). For example, correlative analyses of temporal variation in population change within a large geographical area may identify drivers different from those identified when the population changes and drivers are analysed at smaller spatial scales.
The British population of the Mute Swan Cygnus olor declined in the 1960s, probably as a result of increased mortality during severe winters (Boyd & Ogilvie Citation1964, Ogilvie Citation1967), and remained low throughout the 1970s (Ogilvie Citation1981, Kirby et al. Citation1994). In the 1980s, many studies linked deaths of Mute Swans to the ingestion of lead angling weights accidentally deposited in waterbodies and waterways (Simpson et al. Citation1979, Hardman & Cooper Citation1980, Birkhead Citation1982, Birkhead & Perrins Citation1985). The Goode Report (Citation1981) identified lead poisoning as the largest cause of death of Mute Swans in the UK. Lost or discarded lead fishing weights, widely used by recreational anglers for coarse fishing were often ingested by Mute Swans, and were the principal cause of lead poisoning of the species in many areas. In January 1987, the importation, supply, and use of lead angling weights of sizes 0.06–28.35 g was banned throughout the UK by The Control of Pollution (Anglers’ Lead Weights) Regulations 1986 (HMSO Citation1986).
Since this legislation came into effect, the Mute Swan population in Great Britain has increased substantially (Kirby et al. Citation1994, Wood et al. Citation2019). The median blood lead concentration in live-captured Mute Swans on the River Thames declined after the ban and by 1991 it was approximately half of the level reported in 1980 (Lievesley Citation1997). However, this rapid decline was not sustained; although swan numbers continued to increase, in 2000/2001, blood lead levels in wild-caught swans at several sites were broadly similar to those in 1991 (Perrins et al. Citation2003). Nonetheless, there was a post-ban decrease in the incidence of lead poisoning (Sears & Hunt Citation1991) and a large decrease in the proportion of Mute Swan deaths attributable to lead poisoning (Newth et al. Citation2013, Wood et al. Citation2019). Hence, a post-ban reduction in mortality caused by lead poisoning is a strong candidate as a major contributory cause of the Mute Swan population increase (Wood et al. Citation2019). However, recent warmer winters, increases in autumn-sown crop area as a winter food supply and improved water quality in waterways were also suggested by Wood et al. (Citation2019) as factors which may have contributed to increased swan numbers.
Warmer winters in Great Britain, especially since the 1980s (Houghton et al. Citation2001), may have reduced mortality of Mute Swans. Thermoregulatory costs are higher in cold winters, and safe refuges and some food sources may be limited if waterbodies freeze over (Boyd & Ogilvie Citation1964, Esselink & Beekman Citation1991, Perrins Citation1991). Mild winters may also allow female swans to reach peak body condition earlier in the breeding season and result in an earlier date of egg-laying, larger mean clutch size, and greater fledgling success (Birkhead et al. Citation1983, Beekman Citation1991).
Arable farming in Great Britain has changed markedly in recent decades, particularly in the switch from spring to autumn sowing of cereal crops and the crop types grown (Chamberlain et al. Citation2001, Butler et al. Citation2007). In regions with arable crops, Mute Swans graze the leaves of autumn-sown oilseed rape and wheat in winter, especially when their other food resources are scarce (Sears Citation1989, Rees et al. Citation1997, Chisholm & Spray Citation2002, Rowell & Spray Citation2004). Reports by farmers of damage by swans to autumn-sown crops have increased, with oilseed rape being the crop most often reported to be damaged (McKay & Parrott Citation2002). These farming changes are therefore likely to have enhanced winter food supplies of Mute Swans, with possible effects on survival and population size. Mute Swan population increases in the Netherlands have also been linked with increased use of food supplies on farmland (van Eerden et al. Citation2005).
Measures were introduced to improve water quality in UK watercourses and waterbodies in response to the European Union Water Framework Directive (European Commission Citation2000), including decreases in nutrient run-off pollution in many areas (Civan et al. Citation2018). Phosphorus load is an indicator of water quality and pollution, and plant and algal growth in many waterbodies is limited by phosphorus availability (Balls et al. Citation1989, Conley et al. Citation2009). Decreasing phosphorus loads may reduce the incidence of algal blooms and hypoxia (Jarvie et al. Citation2015), which may increase abundance of submerged aquatic macrophytes on which swans also feed (Balls et al. Citation1989, Rowell & Spray Citation2004).
Wood et al. (Citation2019) analysed the trend in the national Mute Swan population of Great Britain as a whole and correlated this temporal variation with the timing of the national ban on lead angling weights and changes in climate, crop area, and phosphorus levels in rivers at a national level, which they considered to be the most plausible environmental drivers of population change, for the reasons described above. They concluded that the Mute Swan population increase was best explained by the introduction of the lead angling weight ban, with the apparent effects of other covariates being minor. However, the study did not explore the considerable regional variation in Mute Swan population change. British Mute Swans are non-migratory and disperse over relatively short distances (Wernham et al. Citation2002, Paradis et al. Citation1998), so correlations between changes in Mute Swan populations and potential drivers would be expected at a regional scale, as well as the national scale examined by Wood et al. (Citation2019).
British Mute Swans breed in a range of lowland semi-natural and artificial wetland habitats (Rowell & Spray Citation2004). They feed on submerged aquatic and bankside vegetation and on terrestrial plants, leaves, roots, and seeds from arable crops and crop residues. In urban areas, they also eat food, such as bread, provided directly by humans (Kiorboe Citation1980, Sears Citation1989), and frequently occur and breed in areas used by people (Tuite et al. Citation1984). They can reach submerged vegetation at a considerable depth because of their long necks and ability to up-end (Owen et al. Citation1986). Their tolerance of humans and foraging behaviour bring Mute Swans into frequent contact with lost and discarded artificial materials, including lead angling weights, at the bottom of waterbodies frequented by people.
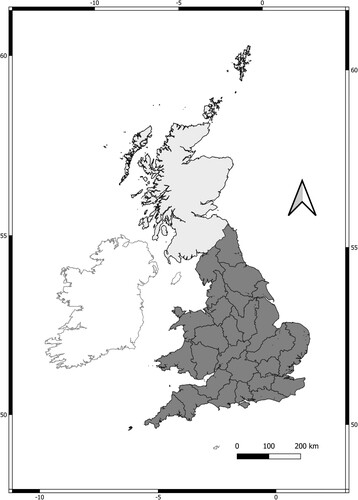
Here, we quantify associations between both regional and national trends in Mute Swan population sizes and changes in arable resources, climate warming, water quality, and use of lead fishing weights. Our aim is to quantify the relative importance of these covariates in their influence on Mute Swan populations, as was done using similar covariates in the analysis by Wood et al. (Citation2019), but with a strong focus on both the regional and national scales ().
Figure 1. Areas contributing data to the analyses of national and regional variation in Mute Swan population trends. The national analysis was conducted for Great Britain between 1974 and 2012 (light and dark grey-shaded areas enclosed by black lines combined). The regional analysis was conducted across 26 regions of England and Wales (shaded in dark grey) using data from the ecological years between 1974/1975 and 2016/2017. The divisions within the dark grey-shaded area are boundaries of Environment Agency regions.
Methods
National scale changes in the Mute Swan population of Great Britain
To measure the change in Mute Swan numbers across Great Britain, we obtained Mute Swan numbers from the Wetland Bird Survey (WeBS), which is a programme organized by the British Trust for Ornithology (BTO). WeBS citizen scientists count waterbird species at freshwater and coastal sites throughout the UK (Frost et al. Citation2019). Counts are conducted monthly, where possible, at defined survey sectors (count unit) across the UK with most being made during the winter because the principal objective of WeBS is to monitor populations of wintering birds (BTO, Citation2017). From these WeBS counts, the BTO calculates national population index values, which are arbitrarily set to the value 100 in the most recent winter of the series, with values for other winters being scaled accordingly (Frost et al., Citation2021).
To relate national scale Mute Swan population change to changes in the four potential explanatory variables, we used the Great Britain (GB) WeBS annual population index values for the years 1974–2012 for Great Britain. We did not include WeBS data for Northern Ireland because data on most covariates in Northern Ireland were not comparable with those for Great Britain (England, Scotland, and Wales). The index values refer to the period between July of one year and June of the next, which we refer to as an ecological year and we identified ecological years by the initial calendar year of the period (e.g. 1974 = 1974/1975). Following Wood et al. (Citation2019), we defined the period prior to the ban on lead angling weights (pre-ban) as being up to 1986, and we define an additional period of approximate population stability following the increase after the ban (stable post-ban) as being from 2000 onwards, by plotting the intrinsic rate of growth of the population r against year (online Figure S1) and based upon inspection of online Figure S2a.
Regional changes in Mute Swan abundance in England and Wales
To calculate the regional changes in Mute Swan populations, we used the raw monthly WeBS count data available for the ecological years 1974–2016; each was assigned to a sector, calendar month, and ecological year. The counts used in the analysis came from 4890 informative (containing at least one non-zero Mute Swan count and data for at least two winters) survey sectors (60–425 sectors per Environmental Agency (EA) region) in England and Wales.
Because the ban on lead angling weights is a likely driver of the population increase (Wood et al. Citation2019), we thought it important to include in our regional analysis a measure of geographical variation in coarse fishing (angling) intensity, as a proxy for exposure to lead angling weights before the ban and therefore the likely reduction in exposure to lead weights when the ban came into force. Coarse fishing is a recreational activity common in Great Britain and Ireland, which consists of sport angling for non-salmonid fish. This requirement severely constrained the geographical scope and spatial scale of our analyses. The only source of quantitative data on regional variation in coarse fishing we located (Simpson Citation2001) provided values for annual fishing days in each of 26 EA regions of England and Wales in 2000–2001 (). Although this survey was conducted 13 years after the ban on lead angling weights, this was the earliest date for which regional estimates of coarse fishing intensity were available, and we therefore assumed that the pattern of geographical variation it revealed was a valid proxy for geographical variation in coarse fishing prior to the ban. We consulted two experienced coarse fishermen (W. Peach & P. Grice), whose opinion was that regional differences in fishing intensity were unlikely to have changed greatly between the 1980s and 2000. We were unable to locate comparable data for Scotland or Northern Ireland. A single value of mean fishing intensity in 2000–2001 was available for each EA region. Hence, for comparison with these values, we calculated changes in the number of Mute Swans and values of other covariates as mean values for each of these 26 regions, despite data on them being available at finer spatial scales. Analysis at this coarse spatial scale has the advantage of reducing the degree to which correlations between region-specific population changes and region-specific covariates are weakened by regional populations not being completely closed. For example, net movements of birds from a region with higher-than-average fecundity and survival to adjacent regions with less favourable demographic rates would tend to weaken such correlations.
To characterize regional population change, we first fitted separate Poisson regression models (with a log-link) to the counts for each EA region, with sector, calendar month, and ecological year as fixed categorical variables. The resulting year-specific regression coefficients for each region represent the natural logarithms of the ratio of abundance in a given year to that in the first year of the time series (1974), with the coefficient value for the first year being assigned a value of zero. The exponent of the coefficient therefore represents the abundance in each year relative to the first year. We took arithmetic means of these back-transformed annual index values for each region across the pre-ban period (1974–1986) and the post-ban period of stability (2000–2016). We calculated the ratio of the post-ban to pre-ban mean index value for each region and obtained the natural logarithm of this ratio as a measure of population change. We did not conduct any significance testing or estimation of confidence intervals for these log-ratios, so we considered it unnecessary to allow for overdispersion of counts when fitting the Poisson models. The magnitude of the estimated log-ratios would be unaffected by this.
Exposure of Mute Swans to lead angling weights
For the GB-level analysis, and following Wood et al. (Citation2019), we scored the level of regulation of lead angling weights in each ecological year as binary, being zero for the 13 years before the ban (1974–1986) and one for the 26 years since the ban (1987–2012). For the regional analysis, we assumed that regional variation in exposure to lead angling weights in the period before the ban was related to variation in coarse fishing intensity (Spray & Milne Citation1988). We considered it likely that Mute Swans in regions with high coarse fishing intensity had high exposure to lead angling weights prior to the ban. If the ban was uniformly effective, regions that had the highest coarse fishing intensity should have undergone the greatest decrease in exposure to lead angling weights when the ban came into force.
In calculating regional coarse fishing intensity, we used the estimated number of days fished for coarse fish at all types of fishing locations in each EA region from Table 25 of Simpson (Citation2001). We had coarse fishing data for each of three waterbody types but used results for all types combined. This was because regional variation in the results for the three waterbody types were positively correlated (River vs Still Water: r = 0.782; River vs Canal: r = 0.572; Still Water vs Canal: r = 0.841), and there was no prior evidence to suggest a particular waterbody type was most associated with exposure of Mute Swans to fishing weights. Mute Swans are largely confined to lowland areas at less than 200 m elevation (Balmer et al. Citation2013) and, as coarse fishing is also predominantly conducted in lowland areas, we divided the annual number of days fished in the region by its lowland area (i.e. extent of the region at <200 m elevation), to give our proxy measure of pre-ban exposure of Mute Swans to lead angling weights. We obtained elevation data at 50 m resolution for each region from Ordnance Survey (Citation2019).
Bioclimate variables
We used annual values of two bioclimate variables, the mean temperature of the coldest month (MTCO) and the growing degree-days above 5°C (GDD5) to represent the potential effects of changes in cold winters and warm springs, respectively, on Mute Swan demography and abundance.
We calculated GB values of MTCO and GDD5 for the GB-level analysis for each ecological year. We obtained monthly minimum and mean temperatures from July 1974 to June 2016 from Hadley Centre for Climate Prediction and Research (Citation2017) at a resolution of 5 km2. We calculated MTCO and GDD5 values for each ecological year at 5 km2 resolution. We then took arithmetic means across GB of the annual values at the 5 km2 resolution. For the regional analysis, we followed the same procedure, but took means for each year across each of the EA regions. We used the absolute difference in mean MTCO and GDD5 between the regional pre-ban (1974–1986) and stable post-ban (2000–2015) periods as our measure of regional change. The UKCP09 dataset was only available until December 2016, so we could not obtain values for the ecological year 2016–2017. Therefore, we calculated the stable post-ban period mean for the period 2000–2015.
Area of crops
For the GB-level analysis, we used annual estimates of all wheat and oilseed rape crop area. We obtained annual estimates of wheat crop area from the Department for Environment, Food, and Rural Affairs (Defra, Citation2019b) and annual estimates of oilseed rape crop area from annual Ministry of Agriculture, Fisheries and Food (MAFF) Reports (Citation1978, Citation1980, Citation1981, Citation1982, Citation1983, Citation1984, Citation1986a, Citation1986b, Citation1988, Citation1989, Citation1990, Citation1991, Citation1992, Citation1993, Citation1994, Citation1995, Citation1996, Citation1997, Citation1998), Defra (Citation2019a, Citation2019b), National Assembly for Wales (Citation2003), and Scottish Government (Citation2014). For the regional analysis of data for England and Wales, we used the differences in the regional crop areas of wheat and oilseed rape between 1981 and 2010, the years with the most complete data coverage for pre-ban and post-ban periods (EDINA Agcensus Citation2014). EDINA Agcensus database is derived from data collected in the MAFF/Defra June agricultural census. These areas were for autumn-sown and spring-sown areas combined for these two crops. We would have preferred to use just the areas of autumn-sown oilseed rape and wheat, because Mute Swans mainly graze autumn-sown crops, but these were not available separately. However, the great majority of oilseed rape and wheat are autumn-sown (e.g. all oilseed rape in 2010 was autumn-sown, EDINA Agcensus Citation2014; Robinson & Sutherland Citation2002). We obtained the crop areas of all oilseed rape and all wheat at 5 km2 resolution for 1981 and 2010, and summed across each EA region to give the total pre-ban and stable post-ban crop area respectively. We divided the absolute difference in area between these two years by the lowland area within each region, to allow for variation among regions in the absolute and relative extent of lowlands and uplands, because both Mute Swans and coarse fishing are largely confined to lowland areas (Balmer et al. Citation2013) and because changes in swan demographic rates in a region caused by changes in food supply would be expected to be related to the proportional change in food supply rather absolute change.
Water quality in rivers
For the GB-level analysis, we used the annual GB estimates of Total Reactive Phosphorus (i.e. orthophosphate) concentrations given by Civan et al. (Citation2018). For the regional analysis, we obtained orthophosphate concentration measurements recorded from 205 sites in major rivers and tributaries across England and Wales between 1974 and 2013 (Environment Agency Citation2013), and calculated the arithmetic average of values across each site for each ecological year. We excluded sites with fewer than 10 data points between 1974 and 2013, or data points concentrated in either pre- or post-ban period (i.e. 1973–1986 and 2000–2013, respectively), leaving 180 of the 205 sites eligible for inclusion. For each site, we fitted a general additive model (GAM), relating the natural logarithm of the annual site orthophosphate concentration to year using the mgcv package (Wood Citation2019). We predicted the orthophosphate concentration for a given site and year from the fitted regression model, by calculating the antilogarithm of the GAM predicted annual values of the natural logarithm of orthophosphate concentration. As numbers of measurements per year varied across sites and years, we used annual predicted site orthophosphate concentration values, as opposed to the measured values. We used logarithmic transformation and back-transformation to avoid the GAMs predicting negative concentrations. We then calculated the arithmetic mean of annual predicted orthophosphate concentration for the pre-ban and stable post-ban periods for each site, and calculated site-level change as the natural logarithm of the ratio of the post-ban to pre-ban orthophosphate concentration. We took the arithmetic mean of these log-ratios across all sites in an EA region as the region-specific measure of the change in orthophosphate concentration.
Modelling change in GB-level annual Mute Swan abundance indices
Based on the 39 years we could obtain GB-level data for all variables (1974–2012), we modelled the GB national Mute Swan annual index values using deterministic logistic population models. We fitted two sets of models using non-linear ordinary least squares. Lead regulation and weather conditions are thought to have an effect on annual survival, so we expected that they might influence maximum population growth rate rmax. Meanwhile, crop area and water quality, which changed gradually and may have influenced the swans’ food supply, might thereby influence carrying capacity K. However, despite these prior expectations, we fitted both types of model for all covariates.
In the first set, we modelled the maximum population growth rate rmax as a linear function of the environmental covariates. In the second set, we modelled the carrying capacity K as a linear function of the environmental covariates. The two types of models are presented in the following equations.
(1)
(1)
(2)
(2) where Ni is the population index value in year i, Ni+1 is the population index value in the following year, rmax is the maximum population growth rate, K is the carrying capacity, v0, v1, b0, and b1 are fitted constants, and xi is the covariate value in year i.
Models were fitted using the NONLIN module of SYSTAT version 7 (Systat Software Inc., San Jose, California, USA, www.sigmaplot.com) by minimizing the sum of squares of differences between observed and expected values rather than untransformed
, because this allowed the residuals to be independent of the magnitude of the expected values. We used a stepwise forward selection procedure. Models were fitted first for each covariate in turn, with just one covariate in each model. Two-tailed t-tests of significance were used to select the univariate model with the most significant covariate. Models were then fitted with two covariates: the most significant covariate from the first step and each of the other covariates in turn. The statistical significance of both covariates was assessed using t-tests. The procedure was continued by adding the effect of each covariate in turn to a model identified in the previous step as having all covariates significant at P < 0.05 until none of the covariates added to the model had a significant effect.
Modelling change in regional Mute Swan population abundance indices
Regional variation in population change was analysed using generalized least squares regression models with the region-specific measure of pre-ban to post-ban Mute Swan population change as the dependent variable, and change in exposure to lead angling weights, climate, crops, and river phosphorus as fixed effects. The analyses were conducted in R statistical program version 4.0.3 (R Core Team Citation2020), using the program R Studio version 1.3.959 (R Studio Team Citation2020). Generalized least squares regression allowed us to account for potential spatial autocorrelation in variables between the different regions (Beale et al. Citation2010). We first fitted the full models with five different error autocorrelation structures (exponential, gaussian, spherical, linear, quadratic ratio) and without spatial autocorrelation structure. We calculated the geometric centre of mass (i.e. centroid) for each region to account for their distances for spatial autocorrelation. We fitted these models using the nlme package (Pinheiro et al. Citation2020), and calculated the region centroids using the sf package (Pebesma Citation2018) in R. We used the maximum likelihood method of estimating parameters. We selected the model structure with the lowest AICc (Akaike’s Information Criterion adjusted for small sample size) score for variable selection. The generalized least squares (GLS) regression analysis with different model structures found the model without spatial autocorrelation structure had the lowest AICc value (Table S1). Hence, we selected this model for the final analyses. GLS models with no autocorrelation are equivalent to ordinary least squares regression models. We tested collinearity of variables by calculating the Pearson correlation coefficient between each pair of variables (Table S2).
With only 26 EA regions and six candidate explanatory variables (one lead weight variable, two bioclimate variables, two crop area variables, and one river phosphorus variable), we had a high ratio of samples to structural parameters. We fitted alternative starting models using either MTCO or GDD5 (both measures of climate warming that positively correlated with each other across regions; r = 0.619, P < 0.001) and grouped the two crop types together to give the change in the crop area for the two crop types combined, expressed as a proportion of the lowland area, to reducing the number of variables in our starting models from six to four. This changed the ratio of samples to structural parameters from 4.3 to 6.5, however this ratio is still substantially lower than the recommended lower limit (10) of Burnham and Anderson (Citation2002), so model outputs should therefore be interpreted with caution.
Alternative starting models were fitted with coarse fishing intensity, crop area change and orthophosphate concentration change, and either MTCO change or GDD5 change. The least significant variable was identified using P values from t-tests, then removed from the starting model. This procedure was repeated with one variable being removed at each step until all the remaining variables were significant with P < 0.05. If crop area change was found to be important in either of the two model sets, we fitted a model which only included the two crop types as separate variables and we conducted backwards elimination again. We also repeated the regional analyses using the information theoretic approach (Burnham & Anderson Citation2002) with our methods and results detailed in online Appendix S1.
Unstandardized regression coefficients and standard errors were standardized for comparison, by multiplying the unstandardized coefficient by the standard deviation of the explanatory variable across the 26 regions and dividing by the standard deviation of the Mute Swan change variable across regions. Hence, the standardized coefficient (with confidence intervals) represents the number of standard deviations which the Mute Swan change variable increases with each standard deviation increase in an explanatory variable. Climate and agricultural regional change values were extracted using Raster to Point (Conversion), Extract Values to Points (Spatial Analyst), Join Data and Merge (Data Management) tools, and we calculated the lowland area (i.e. < 200 m) for each EA region using Mosaic to New Raster (Data Management), Reclassify (Spatial Analyst), and Tabulate Area (Zonal) tools in ArcMap 10.6.1 GIS Software (Environmental Systems Research Institute Citation2017).
Results
Change in the Mute Swan population in Great Britain
The annual index value for the Mute Swan population of Great Britain more than doubled between 1974 and 2012, and was approximately stable from about 2000 onwards (online Figure S2a). The phase of rapid population growth began around 1984 (Figure S2a), slightly before the ban on lead angling weights came into force. However, fluctuations in the index at that time prevent robust identification of the beginning of the increase.
For univariate models relating rmax to annual GB-level values of covariates, rmax was significantly positively related to both the area of oilseed rape and the area of wheat, with the effect of oilseed rape being more significant (). For models of rmax which included oilseed rape and each of the other covariates in turn, none of the other covariates had a significant effect. Hence, we selected the model with oilseed rape as the final model. For univariate models relating K to annual values of covariates, none of the covariates had a statistically significant effect, though we note that the area of oilseed rape and the area of wheat, which were the two most significant variables in the univariate analyses of rmax, also both had positive coefficients in the analysis of K, with P ∼ 0.06 for both variables ().
Table 1. Results from univariate models of logistic population growth in Mute Swan national WeBS population indices between 1974 and 2012 in Great Britain. Models where the maximum population growth rate (rmax) was modelled as a linear function of the environmental covariates (left) and models where the carrying capacity (K) was modelled as a linear function of the covariates (right). Covariates statistically significant at P < 0.05 are shown in bold.
Regional changes in Mute Swan populations in England and Wales
Most regions of England and Wales showed an increase in the abundance of Mute Swans between 1974–1986 (pre-ban) and 2000–2016 (stable post-ban) periods. However, there was considerable regional variation in the magnitude of this population change, with populations in some regions undergoing a seven-fold increase whilst others decreased slightly ((a)).
Figure 2. Variation among Environment Agency regions across England and Wales in (a) change in Mute Swan abundance between the pre-lead weight ban period (1974–1986) and the post-ban stable period (2000–2016), as the log-ratio of the post-ban to pre-ban mean population index value; (b) coarse fishing intensity, as the mean number of coarse fishing days in 2000–2001 per lowland hectare; change in (c) mean temperature of the coldest month and (d) growing degree-days above 5°C, as the arithmetic difference between the pre-ban period and post-ban stable period value; change in area of (e) oilseed rape and (f) wheat, as the arithmetic difference in crop area between 1981 and 2010 per lowland hectare; and (g) change in orthophosphate concentration, as the log-ratio of the mean river orthophosphate concentration for the post-ban stable period relative to the pre-ban period.
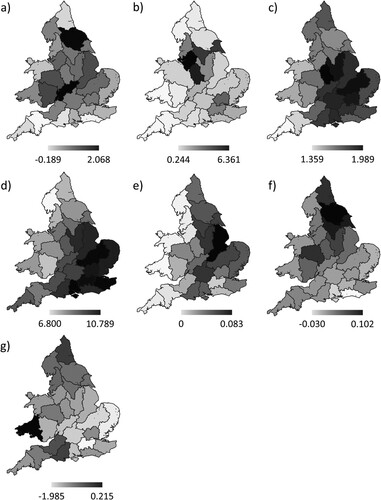
Coarse fishing intensity varied regionally, with a six-fold range between the lowest and highest values ((b)). There was also regional variation in the extent of change in MTCO and GDD5; warming occurred in all regions, but the largest increases tended to be in central and south-eastern England ((c, d)). The area of oilseed rape and wheat tended to increase, with regions in the east and the northeast showing the largest increases in oilseed rape and wheat areas respectively ((e, f)). The quality of river water, as indicated by orthophosphate concentration, improved substantially in most regions ((g)), with decreased concentrations found in all regions except one (southeast Wales).
In both starting models, Mute Swan abundance increased to a significantly greater extent in regions with an increased combined area of crops (a, b, (a)). However, in the starting model that also included GDD5, lower GDD5 increases were also associated with greater Mute Swan abundance increases (b; (b)). When the two crop types were included in the model selection as separate covariates, only increased wheat crop area was significantly positively associated with the change in Mute Swan abundance (c, (c)).
Figure 3. Variation in regional Mute Swan abundance change in relation to change in (a) crop area, (b) growing degree-days above 5°C (GDD5), and (c) wheat crop area. Mute Swan abundance change is the natural logarithm of the ratio of mean Mute Swan abundance in 2000–2016 to that in 1974–1986. Crop area change (a) is the arithmetic difference in wheat and oilseed rape crop area between 1981 and 2010 per lowland hectare. GDD5 change (b) is the arithmetic difference between the pre-ban period and post-ban stable period GDD5 values. Wheat area change (c) is the arithmetic difference in wheat crop area between 1981 and 2010 per lowland hectare. Each point represents an Environment Agency region of England and Wales (N = 26).
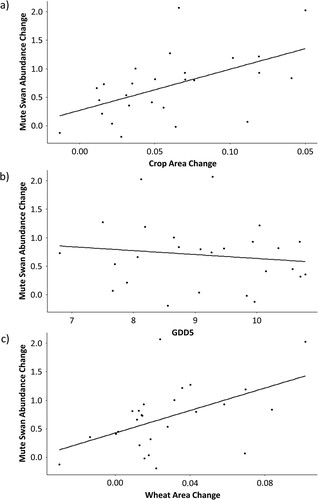
Table 2. Ordinary least squares regression models of regional variation in change in mean Mute Swan abundance index across 26 regions in England and Wales between 1974–1986 and 2000–2016 in relation to potential environmental covariates. As we had a high ratio of data points (n = 26) to covariates (n = 6), we fitted alternative starting models (see Methods for details) where Model A included coarse fishing intensity, mean temperature of the coldest month (MTCO), crop area and orthophosphate; Model B included coarse fishing intensity, growing degree-days (GDD5), crop area, and orthophosphate; and Model C included oilseed rape and wheat crop area. For each model, variables included in the minimal models are shown in bold above the solid line. Non-significant variables, estimates, and associated probabilities from the full model are below the solid line.
Discussion
This study has revealed substantial regional variation in Mute Swan population trends in the UK throughout a period of sustained national population increase. The large increase in WeBS counts of Mute Swans in Great Britain is in accord with other analyses of WeBS data (Wood et al. Citation2019) and also with measures of the breeding population, such as the Common Birds Census/Breeding Bird Survey (CBC/BBS) and atlas studies of changes in extent of the breeding distribution (Balmer et al. Citation2013). We found evidence of large regional differences in the magnitude of increases in Mute Swan abundance in England and Wales. These differences might arise because of long-term differences among regions in reproductive and/or survival rates, and/or differences in net immigration/emigration between regions. The scarcity of long-distance movements of Mute Swans detected by ringing recoveries (Wernham et al. Citation2002) suggests that regional differences in reproduction and/or survival are the more likely explanation, but region-specific data on demographic rates will be needed to identify the demographic mechanisms underlying the regional differences in population change.
Our analyses found that the increase in the predominately autumn-sown oilseed rape and wheat crop area was a better predictor of the timing and geographical pattern of the magnitude of the Mute Swan population increase than the ban on lead angling weights, contrary to Wood et al. (Citation2019). In addition, regions that have undergone lower rates of spring warming have seen greater increases in Mute Swan populations.
The difference between our findings and those from Wood et al. (Citation2019) could reflect differences in the way that the two studies modelled density-dependent population processes. Wood et al. (Citation2019) used generalized least squares regression analysis with the population index as the dependent variable, and a similar range of covariates to those we used, and incorporated an autocorrelation structure to account for non-independence of population estimates in successive years. However, exactly how their modelling approach represents density-dependence is unclear. Our logistic models make explicit assumptions about density-dependence, in that either the rate of population growth or the carrying capacity is assumed to be linearly related to the covariates.
Our analysis of regional variation in the scale of the population increase in England and Wales indicated a stronger influence of increased autumn sowing of crops than the ban on lead angling weights. The proxy measure we used for regional variation in the exposure of Mute Swans to lead angling weights before the ban came into force in 1987 was a survey of coarse fishing conducted 13 years after the ban. Marked changes in the geographical distribution of coarse fishing effort over this period could obscure a real effect of the ban, but while the popularity of coarse fishing has changed in recent decades (rod licence sales increased from 1.09 million in 2000/2001 to 1.47 million in 2009/2010, and declined to 0.89 million in 2017/2018; Environment Agency Citation2019), we have not found information suggesting changes in the distribution of fishing. It is also possible that the relationship between exposure of swans to lead weights and coarse fishing effort varied among regions before the ban. Also, our regional analyses did not include data on coarse fishing intensity for Scotland. If available, these data could potentially have influenced our results, although we consider it unlikely that this would have influenced our overall interpretation. In Scotland, for example, lead poisoning risks are likely to be relatively low due to the predominance of game fishing, which uses little lead relative to coarse fishing (Spray & Milne Citation1988, Wood et al. Citation2019) and Scotland also has large areas of upland with few arable crops relative to England and Wales.
Compliance with the lead regulation seems to have been high (Perrins et al. Citation2002) and lack of compliance is thus unlikely to be the reason for finding little effect of the ban in our analyses. Blood lead levels of Mute Swans declined immediately after the ban, but the decline appears not to have continued (Perrins et al. Citation2003), which may reflect a legacy of lead angling weights from the pre-ban era or other sources of lead, such as ammunition and the legal use of very small shot in fishing (Pain et al. Citation2015). Alternatively, Mute Swans may be ingesting spent lead gunshot pellets in arable fields in winter. Whooper Swans Cygnus cygnus and Bewick’s Swans Cygnus columbianus bewickii suffer from lead poisoning from this exposure route (Newth et al. Citation2013). Analysis of lead isotope ratios in Mute Swans with high levels might allow the provenance of the lead to be established. However, the proportion of Mute Swan deaths attributable to lead poisoning has declined markedly since the ban and remains quite low (Newth et al. Citation2013, Wood et al. Citation2019).
The increase in autumn-sown crop area is one of the most striking post-war changes in farming practices in Great Britain (Butler et al. Citation2007), with positive and negative effects on bird populations. For example, Woodpigeon Columba palumbus populations have increased in line with increases in oilseed rape, which the species grazes in winter (Inglis et al. Citation1997), while declines in several granivorous passerine bird species have been linked to changes in the area and timing of cereal stubbles, which were left unploughed over winter when spring sowing of crops was more prevalent (Green Citation1978, Chamberlain et al. Citation2001, Donald et al. Citation2001). The increased food resources provided by autumn-sown crops could improve survival and possibly also breeding productivity of Mute Swans (Rowell & Spray Citation2004). Increased crop area may also reduce the incidence of food-stress in swans and the composition of the diet may influence the effects of ingested lead (Jordan & Bellrose Citation1951). The UK breeding population of Mute Swans in arable habitats has more than doubled between 1994 and 2011 (Woodward et al. Citation2020), which may indicate that Mute Swans are altering their breeding distribution alongside these cropping changes to make more use of small wetlands in arable areas, with the improved winter food resources there from autumn-sown arable crops.
Greater increase in GDD5 was negatively associated with Mute Swan population increase. Whilst seeming counterintuitive, it is possible that warmer springs have allowed crops, such as oilseed rape, to progress through plant growth faster and to flower and develop secondary compounds earlier (Crauford & Wheeler Citation2009). This would shorten the time in which these crops are available as food resources and lead to a negative effect on population change, either through lower survival or productivity (Chisholm & Spray Citation2002).
Identifying the drivers of population changes in wild species is inevitably complex, and analyses at different spatial scales may identify different drivers. Our study highlights the value of exploring both spatial and temporal variation in population trends and potential drivers when using correlative and comparative approaches. In the case of the British Mute Swan population, the lead weight ban occurred during a period of rapid changes in arable cropping area, and swans are likely to have benefitted from both increased food resources, as suggested by our analyses, and reduced rates of lead ingestion, as suggested previously through national analyses. Future changes to agriculture are likely to affect Mute Swans, but the direction and the magnitude of the impact cannot be predicted and our analyses suggest that they are likely to vary regionally.
Supplemental Material
Download MS Word (318.2 KB)Acknowledgements
We thank T. Finch and C. Morrison for much useful discussion, N. Calbrade, S. Gillings, and F. Worrall for their help with data; W. Peach and P. Grice for advice on coarse fishing; and P. Fox for guidance on measurements of fishing intensity. We thank the amazing citizen scientists who contributed swan counts to WeBS; without them this project would not have been possible. We thank the editors and our two reviewers for their invaluable comments, which have greatly improved the manuscript. This work was undertaken as part of an MSc in Applied Ecology and Conservation at the University of East Anglia (UEA), for which T.L.T.K. received kind funding support from the UEA International Excellence Scholarship and the Santander Postgraduate Scholarship.
Disclosure statement
No potential conflict of interest was reported by the author(s).
Data availability statement
We obtained the raw data used to calculate derived environmental change variables in our analyses from published sources cited in the text. We obtained the raw count data on Mute Swan populations from the BTO's WeBS programme and are available from the BTO on application. We have archived the values for environmental change and swan population change variables we derived from these raw data on Zenodo (https://doi.org/10.5281/zenodo.8162813).
References
- Baillie, S.R. 2001. The contribution of ringing to the conservation and management of bird populations: a review. Ardea 89: 167–184.
- Balls, H., Moss, B. & Irvine, K. 1989. The loss of submerged plants with eutrophication I. Experimental design, water chemistry, aquatic plant and phytoplankton biomass in experiments carried out in ponds in the Norfolk Broadland. Freshw. Biol. 22: 71–87.
- Balmer, D., Gillings, S., Caffrey, B., Swann, B., Downie, I. & Fuller, R. 2013. Bird Atlas 2007-11: the breeding and wintering birds of Britain and Ireland. British Trust for Ornithology, Thetford.
- Beale, C.M., Lennon, J.J., Yearsley, J.M., Brewer, M.J. & Elston, D.A. 2010. Regression analysis of spatial data. Ecol. Lett. 13: 246–264.
- Beekman, J.H. 1991. Laying date and clutch size in relation to body weight in the Mute Swan Cygnus olor. Wildfowl S1: 279–287.
- Birkhead, M. 1982. Causes of mortality in the Mute Swan Cygnus olor on the River Thames. J. Zool. 198: 15–25.
- Birkhead, M., Bacon, P.J. & Walter, P. 1983. Factors affecting the breeding success of the Mute Swan Cygnus olor. J. Anim. Ecol. 52: 727–741.
- Birkhead, M. & Perrins, C. 1985. The breeding biology of the Mute Swan Cygnus olor on the River Thames with special reference to lead poisoning. Biol. Conserv. 32: 1–11.
- Bowler, D.E., Heldbjerg, H., Fox, A.D., O’Hara, R.B. & Böhning-Gaese, K. 2018. Disentangling the effects of multiple environmental drivers on population changes within communities. J. Anim. Ecol. 87: 1034–1045.
- Boyd, H. & Ogilvie, M. 1964. Losses of Mute Swans in England in the winter of 1962-63. Wildfowl 15: 4.
- BTO. 2017. Wetland Bird Survey: Survey Methods, Analysis & Interpretation. British Trust for Ornithology, Thetford.
- Burnham, K.P. & Anderson, D.R. 2002. Model Selection and Multimodel Inference: a practical information-theoretic approach. 2nd ed. Springer-Verlag, New York, NY.
- Butler, S.J., Vickery, J.A. & Norris, K. 2007. Farmland biodiversity and the footprint of agriculture. Science 315: 381–384.
- Chamberlain, D.E., Fuller, R.J., Bunce, R.G.H., Duckworth, J.C. & Shrubb, M. 2001. Changes in the abundance of farmland birds in relation to the timing of agricultural intensification in England and Wales. J. Appl. Ecol. 37: 771–788.
- Chisholm, H. & Spray, C. 2002. Habitat usage and field choice by mute and whooper swans in the tweed valley, Scotland. Waterbirds Int. J. Waterbird Biol. 25: 177–182.
- Civan, A., Worrall, F., Jarvie, H.P., Howden, N.J.K. & Burt, T.P. 2018. Forty-year trends in the flux and concentration of phosphorus in British rivers. J. Hydrol. 558: 314–327.
- Conley, D.J., Paerl, H.W., Howarth, R.W., Boesch, D.F., Seitzinger, S.P., Havens, K.E., Lancelot, C. & Likens, G.E. 2009. Controlling eutrophication: nitrogen and phosphorus. Science 323: 1014–1015.
- Crauford, P.Q. & Wheeler, T.R. 2009. Climate change and the flowering time of annual crops. J. Exp. Bot. 60: 2529–2539.
- Defra (Department for Environment, Food & Rural Affairs). 2019a. Structure of the agricultural industry in England and the UK at June - England Annual Time Series: 1983 to 2019. https://www.gov.uk/government/statistical-data-sets/structure-of-the-agricultural-industry-in-england-and-the-uk-at-june.
- Defra (Department for Environment, Food & Rural Affairs). 2019b. Structure of the agricultural industry in England and the UK at June - Key Crop Areas and Livestock Numbers: UK and Country Level Data 1866-2018. https://www.gov.uk/government/statistical-data-sets/structure-of-the-agricultural-industry-in-england-and-the-uk-at-june.
- Donald, P.F., Buckingham, D.L., Moorcroft, D., Muirhead, L.B., Evans, A.D. & Kirby, W.B. 2001. Habitat use and diet of Skylarks Alauda arvensis wintering on lowland farmland in southern Britain. J. Appl. Ecol. 38: 536–547.
- EDINA Agcensus. 2014. Agricultural census [Data set]. https://access.edina.ac.uk/agcensus/.
- Environment Agency. 2013. Historic UK Water Quality Sampling Harmonised Monitoring Scheme Detailed Data [Data set]. https://ea.sharefile.com/d-sc3fe58e6bcb47f59.
- Environment Agency. 2019. Annual summary of rod licence sales. https://data.gov.uk/dataset/2b303513-bc81-4bef-880f-8a587db9b3a1/annual-summary-of-rod-licence-sales.
- Environmental Systems Research Institute (ESRI). 2017. Arcgis Desktop: Release 10.6.1 (Version 10.6.1). Environmental Systems Research Institute, Redlands, CA, USA.
- Esselink, H. & Beekman, J.H. 1991. Between year variation and causes of mortality in the non-breeding population of the Mute Swan Cygnus olor in The Netherlands, with special reference to hunting. Wildfowl S1: 110–119.
- European Commission. 2000. Directive 2000/60/EC of the European Parliament and of the Council of 23 October 2000 establishing a framework for Community action in the field of water policy. Pub. L. No. 32000L0060, OJ L 327 327.
- Frost, T.M., Austin, G.E., Calbrade, N.A., Mellan, H.J., Hearn, R.D., Robinson, A.E., Stroud, D.A., Wotton, S.R. & Balmer, D.E. 2019. Waterbirds in the UK 2017/18: the Wetland Bird Survey. BTO, RSPB and JNCC, in association with WWT. British Trust for Ornithology, Thetford.
- Frost, T.M., Calbrade, N.A., Birtles, G.A., Hall, C., Robinson, A.E., Wotton, S.R., Balmer, D.E. & Austin, G.E. 2021. Waterbirds in the UK 2019/20: the Wetland Bird Survey. BTO, RSPB and JNCC, in association with WWT. British Trust for Ornithology, Thetford.
- Goode, D.A. 1981. Lead Poisoning in Mute Swans. Nature Conservancy Council, London.
- Green, R.E. 1978. Factors affecting the diet of farmland Skylarks, Alauda arvensis. J. Anim. Ecol. 47: 913–928.
- Green, R.E. 1995. Diagnosing causes of bird population declines. Ibis 137: S47–S55.
- Green, R.E. 2002. Diagnosing causes of population declines and selecting remedial actions. In Norris, K. & Pain, D.J. (eds) Conserving Bird Biodiversity, 139–156. Cambridge University Press, Cambridge.
- Hadley Centre for Climate Prediction and Research. 2017. UKCP09: land and marine past climate and future scenario projections data for the UK [Data set]. http://catalogue.ceda.ac.uk/uuid/094d9c9b9dda42c0aa1a1848af9fb56b.
- Hardman, J.A. & Cooper, D.R. 1980. Mute Swans on the Warwickshire Avon – a study of a decline. Wildfowl 31: 29–36.
- HMSO. 1986. The Control of Pollution (Anglers’ Lead Weights) Regulations 1986. HMSO, UK.
- Houghton, J.T., Ding, Y., Griggs, D.J., Noguer, M., van der Linden, P.J., Dai, X., Maskell, K. & Johnson, C.A. 2001. Climate Change 2001: The Scientific Basis. Intergovernmental Panel on Climate Change, Cambridge.
- Huntley, B., Green, R.E., Collingham, Y.C. & Willis, S.G. 2007. A Climatic Atlas of European Breeding Birds. Lynx Edicions, Barcelona.
- Inglis, I.R., Isaacson, A.J., Smith, G.C., Haynes, P.J. & Thearle, R.J.P. 1997. The effect on the Woodpigeon (Columba palumbus) of the introduction of oilseed rape into Britain. Agric. Ecosyst. Environ. 61: 113–121.
- Jarvie, H.P., Sharpley, A.N., Flaten, D., Kleinman, P.J.A., Jenkins, A. & Simmons, T. 2015. The pivotal role of phosphorus in a resilient water–energy–food security nexus. J. Environ. Qual. 44: 1049–1062.
- Jordan, J.S. & Bellrose, F.C. 1951. Lead poisoning in wild waterfowl. Illinois Natural History Survey. Biol. Notes 26: 27.
- Kiorboe, T. 1980. Distribution and production of submerged macrophytes in Tipper Grund (Ringkobing Fjord, Denmark), and the impact of waterfowl grazing. J. Appl. Ecol. 17: 675–687.
- Kirby, J., Delany, S. & Quinn, J. 1994. Mute Swans in Great Britain: a review, current status and long-term trends. Hydrobiologia 279: 467–482.
- Lievesley, P. 1997. Factors affecting the survival and reproductive success of mute swans in the Thames Valley. Ph.D. thesis, University of Oxford, UK.
- MAFF (Ministry of Agriculture, Fisheries and Food). 1978. Agricultural Statistics 1975, United Kingdom. HMSO, London.
- MAFF (Ministry of Agriculture, Fisheries and Food). 1980. Agricultural Statistics 1976-77, United Kingdom. HMSO, London.
- MAFF (Ministry of Agriculture, Fisheries and Food). 1981. Agricultural Statistics, United Kingdom: 1978/79. HMSO, London.
- MAFF (Ministry of Agriculture, Fisheries and Food). 1982. Agricultural Statistics, United Kingdom: 1980 and 1981. HMSO, London.
- MAFF (Ministry of Agriculture, Fisheries and Food). 1983. Agricultural Statistics, United Kingdom: 1982. HMSO, London.
- MAFF (Ministry of Agriculture, Fisheries and Food). 1984. Agricultural Statistics, United Kingdom: 1983. HMSO, London.
- MAFF (Ministry of Agriculture, Fisheries and Food). 1986a. Agricultural Statistics, United Kingdom: 1984. HMSO, London.
- MAFF (Ministry of Agriculture, Fisheries and Food). 1986b. Agricultural Statistics, United Kingdom: 1985. HMSO, London.
- MAFF (Ministry of Agriculture, Fisheries and Food). 1988. Agricultural Statistics, United Kingdom: 1986. HMSO, London.
- MAFF (Ministry of Agriculture, Fisheries and Food). 1989. Agricultural Statistics, United Kingdom: 1987. HMSO, London.
- MAFF (Ministry of Agriculture, Fisheries and Food). 1990. Agricultural Statistics, United Kingdom: 1988. HMSO, London.
- MAFF (Ministry of Agriculture, Fisheries and Food). 1991. Agricultural Statistics, United Kingdom: 1989. HMSO, London.
- MAFF (Ministry of Agriculture, Fisheries and Food). 1992. The Digest of Agricultural Census Statistics: United Kingdom 1991. HMSO, London.
- MAFF (Ministry of Agriculture, Fisheries and Food). 1993. The Digest of Agricultural Census Statistics: United Kingdom 1992. HMSO, London.
- MAFF (Ministry of Agriculture, Fisheries and Food). 1994. The Digest of Agricultural Census Statistics: United Kingdom 1993. HMSO, London.
- MAFF (Ministry of Agriculture, Fisheries and Food). 1995. The Digest of Agricultural Census Statistics: United Kingdom 1994. HMSO, London.
- MAFF (Ministry of Agriculture, Fisheries and Food). 1996. The Digest of Agricultural Census Statistics: United Kingdom 1995. HMSO, London.
- MAFF (Ministry of Agriculture, Fisheries and Food). 1997. The Digest of Agricultural Census Statistics: United Kingdom 1996. HMSO, London.
- MAFF (Ministry of Agriculture, Fisheries and Food). 1998. The Digest of Agricultural Census Statistics: United Kingdom 1997. HMSO, London.
- McKay, H.V. & Parrott, D. 2002. Mute swan grazing on winter crops: evaluation of three grazing deterrents on oilseed rape. Int. J. Pest Manag. 48: 189–194.
- National Assembly for Wales. 2003. Digest of Welsh Statistics 2002: agriculture, fishing & forestry. https://gov.wales/digest-welsh-statistics-2002.
- Newth, J.L., Cromie, R.L., Brown, M.J., Delahay, R.J., Meharg, A.A., Deacon, C., Norton, G.J., O’Brien, M.F. & Pain, D.J. 2013. Poisoning from lead gunshot: still a threat to wild waterbirds in Britain. European Journal of Wildlife Research 59: 195–204.
- Ogilvie, M.A. 1967. Population changes and mortality of the Mute Swan in Britain. Wildfowl 18: 64–73.
- Ogilvie, M.A. 1981. The Mute Swan in Britain, 1978. Bird Study 28: 87–106.
- Ordnance Survey. 2019. OS Terrain 50 [Data set]. https://www.ordnancesurvey.co.uk/business-and-government/products/terrain-50.html.
- Owen, M., Atkinson-Willes, G.L. & Salmon, D.G. 1986. Wildfowl in Great Britain. 2nd ed. Cambridge University Press, Cambridge.
- Pain, D.J., Cromie, R. & Green, R.E. 2015. Poisoning of birds and other wildlife from ammunition-derived lead in the UK. In Delahay, R.J. & Spray, C.J. (eds) Oxford Lead Symposium, 58–84. Edward Grey Institute, Oxford.
- Paradis, E., Baillie, S.R., Sutherland, W.J. & Gregory, R.D. 1998. Patterns of natal and breeding dispersal in birds. J. Anim. Ecol. 67: 518–536.
- Pebesma, E. 2018. Simple features for R: Standardized support for spatial vector data. R. J. 10: 439–446.
- Perrins, C.M. 1991. Survival rates of young Mute Swans Cygnus olor. Wildfowl S1: 95–103.
- Perrins, C.M., Cousquer, G. & Waine, J. 2003. A survey of blood lead levels in Mute Swans Cygnus olor. Avian Pathol. 32: 205–212.
- Perrins, C.M., Martin, P. & Broughton, B. 2002. The Impact of Lost and Discarded Fishing Line and Tackle on Mute Swans (No. W1-051/TR). Environment Agency, Bristol.
- Pinheiro, J., Bates, D., DebRoy, S., Sarkar, D. & R Core Team. 2020. nlme: linear and nonlinear mixed effects models. R package version 3.1-149.
- R Core Team. 2020. R: a language and environment for statistical computing. R Foundation for Statistical Computing. https://www.rproject.org/.
- R Studio Team. 2020. RStudio: integrated development for R. RStudio, Inc. http://www.rstudio.com/.
- Rees, E.C., Kirby, J.S. & Gilburn, A. 1997. Site selection by swans wintering in Britain and Ireland; the importance of habitat and geographic location. Ibis 139: 337–352.
- Robinson, R.A. & Sutherland, W.J. 2002. Post-war changes in arable farming and biodiversity in Great Britain. J. Appl. Ecol. 39: 157–176.
- Rowell, H. & Spray, C. 2004. Mute Swan Cygnus Olor (Britain and Ireland Populations) in Britain and Northern Ireland 1960/61-2000/01. Wildfowl & Wetlands Trust/Joint Nature Conservation Committee, Slimbridge.
- Scottish Government. 2014. Abstract of Scottish Agricultural Statistics 1982 to 2013. https://www2.gov.scot/Topics/Statistics/Browse/Agriculture-Fisheries/PubAbstract/Abstract2013.
- Sears, J. 1989. Feeding activity and body condition of Mute Swans Cygnus olor in rural and urban areas of a lowland river system. Wildfowl 40: 88–98.
- Sears, J. & Hunt, A.E. 1991. Lead poisoning in Mute Swans Cygnus olor in England. Wildfowl S1: 383–388.
- Simpson, D. 2001. Survey of Rod Licence Holders (No. W2-057/TR). Environmental Agency, Bristol.
- Simpson, V.R., Hunt, A.E. & French, M.C. 1979. Chronic lead poisoning in a herd of Mute Swans. Environ. Pollut. 18: 187–202.
- Spray, C.J. & Milne, H. 1988. The incidence of lead poisoning among Whooper and Mute Swans Cygnus cygnus and C. olor in Scotland. Biol. Conserv. 44: 265–281.
- Tuite, C.H., Hanson, P.R. & Owen, M. 1984. Some ecological factors affecting winter wildfowl distribution on inland waters in England and Wales, and the influence of water-based recreation. J. Appl. Ecol. 21: 41–61.
- Van Eerden, M.R., Drent, R.H., Stahl, J. & Bakker, J.P. 2005. Connecting seas: Western Palaearctic continental flyway for water birds in the perspective of changing land use and climate. Glob. Chang. Biol. 11: 894–908.
- Wernham, C., Toms, M., Marchant, J.H., Clark, J., Siriwardena, G.M. & Baillie, S.R. 2002. The migration Atlas: movements of the Birds of Britain and Ireland. British Trust for Ornithology, Thetford.
- Wood, K.A., Brown, M.J., Cromie, R.L., Hilton, G.M., Mackenzie, C., Newth, J.L., Pain, D.J., Perrins, C.J. & Rees, E.C. 2019. Regulation of lead fishing weights results in Mute Swan population recovery. Biol. Conserv. 230: 67–74.
- Wood, S.N. 2019. mgcv: mixed GAM computation vehicle with GCV/AIC/REML smoothness estimation and GAMMs by REML/PQL, R package version 1.8.28.
- Woodward, I.D., Massimino, D., Hammond, M.J., Barber, L., Barimore, C., Harris, S.J., Leech, D.I., Noble, D.G., Walker, R.H., Baille, S.R. & Robinson, R.A. 2020. BirdTrends 2020: trends in numbers, breeding success and survival for UK breeding birds. BTO Research Report 732. British Trust for Ornithology, Thetford. www.bto.org/birdtrends.