
ABSTRACT
The long-term benefits of academically selective schools have not been thoroughly explored in the Australian context. This research draws on data from a longitudinal study of Australian young people (n = 2933) and utilises Nearest-neighbour matching techniques to explore whether individuals who attend academically selective schools have better outcomes than those who attend non-selective schools. This research explores a range of post-school outcomes, including engagement in education or employment, years of education and life satisfaction. Participants who graduated from academically selective schools reported slightly higher general life satisfaction scores. Limitations around the available data and measures used for identifying selective schools are discussed, but these results indicate that attending an academically selective school is not associated with major benefits for individuals. We argue that academically selective schools contradict the principles of inclusive and equitable education which underpin Australia’s school system. The results speak to policy makers who play a key role in evaluating and regulating selective processes.
1. Introduction
An increasingly marketised and competitive system of schooling in Australia has coincided with increased school selectivity, defined as school and system-devised processes that go beyond enrolment based on local catchment areas (Tham, Citation2021). Compared to other Organisation for Economic Co-operation and Development (OECD) countries, selectivity is a common feature in many Australian schools (Varsik, Citation2022), which scholars attribute to many factors. For example, schools that consistently produce high results become what Windle (Citation2015) refers to as ‘high-demand schools’. High-demand schools can utilise various forms of selectivity such as standardised entrance exams, feeder-school reports, written application essays and assessments results for both general or specific achievement domains such as science.
Similar to grammar schools in the United Kingdom (UK), Australian fully academically selective schools are part of the government sector and select all their students via a standardised and high stakes entrance exam (Ho, Citation2018). State governments purport that selective schools ‘make a difference in supporting the development of academic talent and the wellbeing of high potential and gifted students’ (NSW Government, Citation2024b).
The evidence base around why parents enrol their children into selective schools is relatively established. Studies of school choice highlight that parents can be motivated to enrol their children into such high-performing schools because they believe it will increase the chances of their children getting into prestigious universities, increasing the likelihood of securing a well-paid and high-status occupation (Campbell et al., Citation2009). Arguably, discourses of school choice position parents as consumers of education and opportunities (Windle, Citation2015) and in the case of Asian migrant families, there can be additional motivations of ‘anxiety and aspiration’ (Ho, Citation2020) that underpin their approaches towards entry into high-performing schools, such as selective schools. Much less is known about whether selective school graduates have better outcomes in adulthood than non-selective school students. One study has explored the end of year exam results of fully selective school students in one Australian state (Houng and Ryan, Citation2018), but there are no published studies that critically tracks and compares longer-term outcomes of students who attend selective schools compared to non-selective schools into adulthood.
To address this gap, this research is based on an analysis of data from the Longitudinal Surveys of Australian Youth (LSAY), the 2009 cohort (Y09). LSAY is a nationally representative survey program that follows young Australians over an 11-year period. LSAY features annual surveys from cohorts of Australian young people from 15 to 25 years of age, as they move through school to further study, work and beyond. As part of the LSAY, school principals complete a questionnaire, comprising questions about their pupils, school management and school admission policies. We draw on principal’s self-reports of academic selectivity related to school enrolment and admission processes as a measure for school selectivity. Employing matching techniques, we also compare long-term education, employment and life satisfaction outcomes by academic selectivity status.
The aim of this study is to investigate whether students who graduate from academically selective schools have better education, employment and life satisfaction outcomes at two time points: At age 19, we investigate how secondary school completion rates and whether students are fully engaged in education or work might vary between schools of different academic selectivity status. At age 25, we explore whether graduates of academically selective schools are more likely to be employed (part-time or full-time), fully engaged in education or work, have completed more years of education and have greater general life satisfaction.
2. School Academic Selectivity in Australia
Australia has three school sectors: Government schools and non-government schools which comprise Catholic schools and ‘independent schools’, which are mostly religiously affiliated (Campbell and Proctor, Citation2014). In this paper, we will refer to ‘government schools’, ‘Catholic’ and ‘independent’ schools.
Government schools generally enrol students who live in their local area, but in the case of fully selective government schools, only the highest achieving students obtain a place, as determined by a competitive entrance exam. Each state has a different number of fully selective schools. New South Wales has the highest, with 21 fully selective schools (NSW Government, Citation2024a), Victoria has four and Queensland and Western Australia have one each. These fully selective schools are often the highest performing in each state (Ho, Citation2018). Some research indicates that fully selective school students do slightly better than their peers at end of year exams (Houng and Ryan, Citation2018). Gemici and Tham (Citation2014) reported that students who attended academically selective schools were just as engaged in school (cognitive and emotional) at age 15 compared to their non-selective school peers.
There are also a number of partially selective government schools, mainly concentrated in New South Wales (24) (NSW Government, Citation2023) and Victoria (22 metropolitan and 13 regional) (SEAL Academy, Citation2024). These schools enrol the majority of their students from the local area, but non-local students are selected for academically streamed classes within the schools.
There are also some other government schools, often high-performing schools located in inner-city areas (Rowe and Windle, Citation2012) that can engage in academic selectivity to enrol their students because the local demand outstrips the number of available places. High-performing and reputable schools, often located in affluent suburbs, as well as specialist schools for science and other disciplines can enrol their students based on principals’ discretion (for academic performance), they can also ask prospective students to write essays or undergo interviews to determine their enrolment (Windle, Citation2015). Therefore, whilst most government schools enrol local students without any prior testing or consideration of academic performance, academic selectivity can occur in the government sector outside of fully and partially selective schools.
Academic selectivity also permeates across non-government schools. Research highlights that independent schools for example, often consider students’ previous performance, as well as a range of other factors when enrolling their students (Windle, Citation2015). So far, Australian studies have compared the long-term education, employment and life outcomes between sectors (Chesters, Citation2018; Dockery, Citation2016), but not by school academic selectivity status. For example, a study highlighted that by age 24, former private school students were no more likely to be employed full-time, be employed in a managerial/professional occupation or have higher weekly earnings than former government school students (Chesters, Citation2018). In terms of employment outcomes, Dockery (Citation2016) analysed HILDA data and concluded that independent and Catholic private school students had higher salaries than government school students, by an average of 10 and 15%, respectively.
How selective school students fare post-schooling is difficult to ascertain in the Australian context because of limitations around student-level post-school data. No research to the knowledge of the authors have investigated the long-term outcomes associated with school selectivity in Australia. By analysing the data by school academic selectivity status, this research seeks to address this gap in the literature. The following section focuses on the international research, where there has been more development in longitudinal research that tracks and compares the outcomes of young people by school selectivity.
3. Background
International studies have utilised large-scale datasets to explore relationships between attending a selective school and students’ long-term education, occupations, and wellbeing outcomes. Much of the recent research has been based in the UK (Capsada-Munsech and Boliver, Citation2021; Sullivan et al., Citation2014), exploring the outcomes of grammar school students. Grammar schools are government-funded schools that only enrol the highest performing students, determined by a standardised entrance exam that students take at age 11. It was more common for scholars to study the education and employment outcomes of adults as they related to schools attended in the teenage years (Coe et al., Citation2008), but more recently, researchers have broadened the scope of their analyses to investigate life and wellbeing outcomes (Jerrim and Sims, Citation2020).
The results from recent research in the UK are mixed. Capsada-Munsech and Boliver (Citation2021) highlights that students who attend grammar schools are more likely to enrol into university compared to non-selective government schools. Similarly, Sullivan et al. (Citation2018) analysed data from the British Cohort study, comparing government, modern and grammar school outcomes for students at ages 16, 18 and 42. Regression analyses were undertaken controlling for a range of socioeconomic, income and religious affiliation factors and the researchers reported that attending a grammar school was associated with higher academic achievement in secondary school and higher qualifications attained in the sample of adults. Saliently, other researchers analysing data from the UK indicated no significant differences between education, income and life satisfaction outcomes of academically selective grammar schools and government schools, once student socioeconomic background are controlled for (Henderson et al., Citation2022; Sullivan et al., Citation2014).
For students who are high-achieving, analysis must ensure students attending academically selective schools are matched with students attending non-selective schools, enabling meaningful comparisons to be made between students when tracking their long-term outcomes. Recently, researchers have been using participant matching techniques to explore student wellbeing outcomes after attending selective schools. Drawing on propensity score matching techniques, Jerrim and Sims (Citation2020) concluded from their research based on the Millennium Cohort Study in Britain, that grammar school attendance had very little impact on students’ later socio-economical outcomes, such as self-confidence, self-esteem and aspirations. Jones et al. (Citation2018) were interested in whether attending a selective school influences health, wellbeing, mental health, and labour outcomes. Their study concluded that the type of school attended did not influence participants’ health and well-being outcomes at age 33 and 45. Selective school students did have better labour market outcomes, such as higher hourly wages and likelihood of being employed at age 33 and 50. Henderson et al. (Citation2022) analysed data from Next Steps, a longitudinal study of young people born in 1989. Multiple regression analyses revealed no significant differences by school type for mental health or life satisfaction at age 14 and 25.
This research focuses on life satisfaction, a key outcome that is captured and measured in the LSAY. Distinct from happiness and wellbeing, life satisfaction or ‘the degree to which an individual judges the overall quality of his life-as-a-whole favourably’ (Veenhoven, Citation1996, p. 10) has also been linked to individuals’ education attainment and work status (Dockery, Citation2003). Underpinned by this research, we expect that after matching, young people who have attended academically selective schools may have better education and employment outcomes compared to those who attend non-selective schools; however, we do not expect there to be significant differences when comparing broader life outcomes, such as life satisfaction.
4. Data and Measures
In 2009, over 14,000 students participated in the Programme for International Student Assessment (PISA), which is an initiative of the OECD. These students undertook tests in mathematical literacy, reading literacy, and scientific literacy, and completed a brief questionnaire, which included scales to measure their attitudes as well as questions to collect information on their backgrounds. All students who participated in PISA were then approached to become part of the LSAY Y09 cohort, the participants of this research.
LSAY is a nationally representative survey of Australian young people. They are tracked over 11 years, with yearly surveys from 15 to 25 years of age. The purpose of the LSAY is to provide insights into the educational activities and labour market outcomes of young people, but data related to satisfaction and wellbeing are also collected to provide a more complete picture of a young person’s life.
The LSAY comprises the largest sample of longitudinal data of Australian young people, but there is a high attrition rate over time, which is common in longitudinal surveys. In our sample of young people, the response rate dropped to 61.5% (or 8,759 respondents) at wave 2 when the LSAY began and further to 20.6% (2,933 respondents) at the last wave (wave 11) (please refer to see Appendix A for rates).
Attrition, especially non-random attrition, leads to two problems in analysing longitudinal data: bias so that the sample no longer represents the original sample and small sample sizes for sub-groups such as Indigenous population and non-English speakers (Department of Education, Citation2014). Other research suggests that attrition and non-response are generally higher among males, young people, non-English speakers, single people and single person households, those with lower levels of education or from low SES backgrounds, non-home owners or those living in urban locations (Watson and Wooden, Citation2009).
Detecting bias in LSAY is not straight-forward as comparable whole sub-population data may not be readily available. Generating population estimates beyond the first wave of LSAY requires benchmarking against other available data sources and careful management of the survey to ensure that it continues to match the populations of interest. This is not generally possible and thus the use of LSAY to provide age-based population estimates is therefore limited.
However, an important feature of the LSAY Y09 data is that the distribution of student samples attending each type of school by selectivity are broadly consistent over time (please see Appendix B). For example, respondents attending ‘always’ selective schools account for 18.3% of all respondents, while they account for 18.8% at the last wave (wave 11). This means that although the sample number was reduced at each later wave, the overall composition of students by their school academic selectivity is consistent across waves, ensuring accurate comparisons between participants from different school types. Moreover, Nearest-neighbour matching controls for participations characteristics in our analysis, minimising the possibility of bias in treatment effect estimates.
As such, for this paper, we used data collected at wave 1, wave 5 and wave 11, when participants were aged 15 (2009), 19 (2013) and 25 (2019) respectively, to examine whether individuals who attend academically selective schools have better long-term outcomes than non-selective school students.
School Academic Selectivity
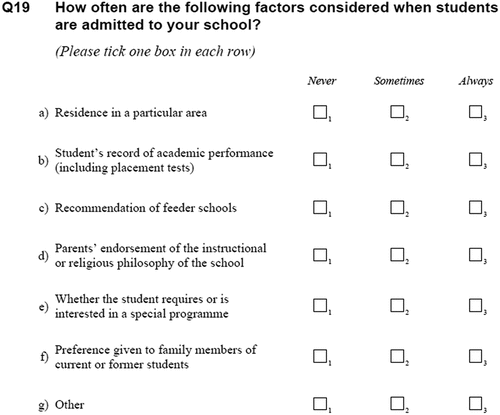
Data were also collected from schools through the LSAY questionnaire, where school principals or leaders provided information about their pupil’s backgrounds, as well as school management and admission policies. Schools were asked if they consider ‘student’s record of academic performance (including placement tests) [during admission]’ and asked to ‘please tick one box’ – ‘never’, ‘sometimes’ or ‘always’ (please refer to Appendix C for the survey item). Principal’s responses to this item are chosen as our measure for school academic selectivity status (as this is the only survey item that provides information related to school selectivity) and we are confident that they would provide accurate information.
As mentioned previously, academic selectivity occurs across Australia’s three school sectors, and this is reflected in the following table that provides the number and percentages of students attending schools of varying academic selectivity by sector. As expected, these data suggest that academic selectivity permeates across all three school sectors although surprisingly, a similar proportion of government and independent schools ‘always’ engage in academically selective practices, 17.9 and 16%, respectively. In contrast, 22.6% of Catholic schools enrolled their students via selective practices.
Overall, almost one in five students in our sample, or 18.3%, attended a school that ‘always’ considered academic performance during admission. Whilst the ‘sometimes’ category is somewhat ambiguous, our analysis will enable us to compare schools that ‘never’ utilise academic selection to those that ‘always’ use academic performance for enrolment and admission purposes.
below outlines how many academically selective schools make up our sample within each state. The information is consistent with the number of fully and partially selective schools in each state. New South Wales has the highest number of ‘always’ and ‘sometimes’ selective schools since it has the most fully and partially selective schools, followed by Victoria. In the late 1980s, selective schools became politically popular, which enabled selective schools to expand in New South Wales, whereas this did not occur in the other states (see Campbell, Citation2019).
Table 1. Distribution of school samples by school selective status across states (LSAY09, wave 1)
Outcome Measures
Education and employment outcomes at age 19 include the completion of Year 12 or equivalent qualifications and being fully engaged in education or work.Footnote1 At age 25, we are interested in participants’ employment status (part- or full-time employment), being fully engaged in education or work, the number of years in education and their general life satisfaction.
The measure of general satisfaction in LSAY incorporated young people’s ratings of their happiness with their lives at home, social lives, spare time activities, standards of living, where they live, how they get along with others, their independence and their lives as a whole. Respondents reported happiness with different aspects of their life at the time of interview. Information is recorded for all respondents at wave 11. The respondents use a scale from zero to ten where zero means very unhappy and ten means very happy to indicate how happy you are with each aspect of their life.
5. Methodology
This research aims to explore whether attending an academically selective secondary schools pay off for individuals as adults, in terms of their education, employment and life satisfaction outcomes. We engage in a two-step process to address this goal. The first involves descriptive analyses to estimate how the average outcomes for participants vary with the academic selectivity of the school they attended, using weighted survey data. This first step will provide a broad overview of the relationships between school selectivity and adult outcomes.
The second step involves the application of Nearest-neighbour matching to test treatment effects at age 25. In this technique, available data is used to match survey respondents that attended an academically selective school (‘always’ and ‘sometimes’), with respondents that did not (schools that were ‘never’ academically selective). The matching process is then used to impute the missing potential outcome of what would have occurred if a respondent that had attended an academically selective school, instead did not (StataCorp, Citation2021).
Three separate matching models were used. Model 1 used the following variables: school grade, gender, Indigenous status, language background other than English (LBOTE) status, geolocation (metropolitan, provincial or remote), and the Index of Economic, Social and Cultural Status. Model 2 included these same variables, with the addition of the PISA reading score. Model 3 included these same variables, with the addition of the PISA mathematics score.
Nearest-neighbour matching was used instead of propensity score matching for two reasons. Firstly, Nearest-neighbour matching is more intuitive to explain to the public, by virtue of being underpinned by seeking a ‘closest’ match using multiple variables simultaneously. Secondly, it can provide more accurate matches than propensity-score matching, which is underpinned by a single probability estimate of being in the treatment group or not. In the current context, students could be ‘matched’ in propensity score matching but still be relatively dissimilar.
The default caliper was used in the Nearest-neighbour matching, meaning that all observations were potential matches regardless of how dissimilar they are. Due to the use of plausible values in the analysis, it was not straightforward to identify how many observations were excluded. However, ad hoc analysis suggested that all ‘treatment’ observations were able to be matched with a control.
6. Limitations
This research has some limitations around the measure for school selectivity. We draw on school principals’ self-reports of whether their school ‘always’, ‘sometimes’ or ‘never’ ‘considered students record of academic performance (including placement tests)’ during admission (see Appendix C for survey item). Firstly, the word ‘consider’ is ambiguous as it impossible to tell the extent to which academic performance is the main factor that determines student enrolment, or whether schools consider academic performance in combination with other factors. Hence, the data analysis does not enable us to know on what basis the schools were selective, or whether students may not be admitted if they do not meet the school selection criteria. A more robust measure would be to ask principals whether they use scores derived from entrance exams to enrol their students, but this information is not available in the Australian context.
We also report on individuals’ full- and part-time work status as an outcome measure in adulthood. This measure does not provide any insights into the types of jobs that participants are engaged in, which makes it difficult to situate the findings within a broader context of the youth labour market. In the introduction, it was outlined that selective schools in New South Wales for example, state that they provide their students with opportunities related to both academic and wellbeing outcomes. Implied in this statement is that greater opportunities are achieved through selective schooling, compared to non-selective schooling. Our research does not aim to provide a complete picture of participants’ lives at age 25, but seeks to investigate the relativity of participant outcomes, as it relates to schools of varying types of selectivity. While full and part-time employment status are relatively blunt measures on their own, coupled with other outcomes, we argue that these measures enable us to engage with a relatively large and representative sample of individuals to address this aim.
7. Results
The socioeconomic, achievement and cultural compositions of schools vary with academic selectivity. As expected, academically selective schools, both ‘sometimes’ and ‘always’, have a higher-level concentration of high performers, as measured by PISA mathematics and reading scores. There is a higher proportion of students from high socioeconomic backgrounds (quartile four) in ‘sometimes’ selective schools 31.2 compared to ‘always’ selective schools, 22.2%, which is attributed to school sector influences. Socioeconomically advantaged students in our sample are more likely to attend independent schools (please refer to Appendix D), which are not selective (shown in ). Meanwhile, government schools feature more frequently in the ‘always’ category, but only 16.8% of their students are from quartile 4. Hence, the overall proportion of high socioeconomic students in ‘always’ selective schools is somewhat lower than expected. Moreover, as academic selectivity increases, so too does the proportion of students from non-English backgrounds [Language Background Other Than English (LBOTE)]. outlines the school profiles by school academic selectivity status. Note that the estimates in used 80 replicate weights (Balanced Repeated Replication with Fay’s adjustment), thus accounting for complex survey designs in the estimation of sampling variances. It also allows for analyses with multiply imputed variables (plausible values), where the average estimator across plausible values is reported and the imputation error is added to the variance estimator.
Table 2. Student distribution by sector and school selective status (LSAY09, wave 1)
Table 3. Student profile by school selection status (LSAY09, wave 1), weighted
Table 4. Student outcomes, descriptive statistics (weighted)
The descriptive analysis in suggests there is little difference in the education, employment and life satisfaction outcomes of students by their school selectivity status. The greatest difference was observed between participants who attended schools non-academically selective schools versus ‘always’ selective schools when measuring their outcomes on full engagement in education and work at age of 19 years, with 77.6% compared to 81%, respectively. Although, this estimate was not statistically significant when weights were used in the analysis.
When Nearest-neighbour matching was applied to the data, only two significant outcomes of attending an academically selective school were identified, related to general life satisfaction and likelihood of being employed part- or full-time at age 25.
The three models included a range of student characteristics such as age, gender, cultural, socioeconomic and geographical location. Model 1 includes these characteristics. Model 2 included these variables, with the addition of the PISA reading score, and Model 3 adding the PISA mathematics score.
The results from Model 1 indicate that attending a school that ‘always’ applies academic selection when enrolling students increases General Life Satisfaction by 0.19 points. Separately, the results from Model 3 indicate that attending a school that ‘sometimes’ applies academic selection reduces the part or full-time employment rate of students by -3.5% points. This may be because students who attend selective schools may still be studying at age 25, which would mean that they are less likely to be employed. Results are in , which used unweighted data.
Table 5. Outcomes, by treatment effects analysis results
As a validation, the analysis was also undertaken using regression models, where the same control variables were used as in the treatment effect analysis. These models use regression functions appropriate to the data – logit, ordinary least squares, or Poisson, and also used weighted and unweighted models. The marginal effects from these regression models are presented in Appendix E. These additional results are broadly in line with those presented in .
8. Discussion and Conclusion
This research compared the long-term education, employment and life satisfaction outcomes of a cohort of young people who attended secondary schools of varying academic selectivity in Australia. After applying matching techniques, there were two significant results from the treatment effects analysis. The first was that the probability of being employed (either full or part-time) reduced for students who attended ‘sometimes’ academically selective schools. Second, for students that attended a school that ‘always’ considered academic performance, there was 0.19 point increase in General Life Satisfaction. These very modest findings indicate that attending an academically selective school does not appear to pay off in large benefits for individuals.
Our research only tracks graduates of academically selective schools until the age of 25, but based on some research in UK grammar schools, employment and life benefits may emerge after 25 and into adulthood. For example, Sullivan’s et al. (Citation2018) study of over 10,000 individuals from the British Cohort Study reported that grammar school students were more likely to work in a job with higher occupational status, obtain higher level educational qualifications, earn higher incomes and own a home at age 42, compared to government comprehensive school students. On the other hand, Birkelund et al. (Citation2021) found no relationship between earnings and grammar school attendance. No matching techniques were applied in either study, which we and others Houng and Ryan (Citation2018) argue to be important when analysing data on cohorts of students who attend academically selective schools.
Although, when we look at studies that utilise matching techniques, the findings of international research are somewhat inconsistent. Jones et al. (Citation2018) analysed data from the NCDS (N = 9,000) and utilised entropy balancing techniques and parametric regression analysis. Jones et al. (Citation2018) concluded that when correcting for pre-treatment differences in pupil characteristics, the average effect of type of school is not a significant predictor of long-term outcomes, with the exception of some labour outcomes (with grammar school attendance associated with a 9% increase in hourly wages compared to government comprehensive schools, and a 10% likelihood increase of being employed at age 50). They also further stated that in the short-term, pupils who attended grammar and secondary modern schools displayed a more positive attitude towards school than comprehensive pupils. This effect may translate into higher wages and better employment prospects later over individuals’ lifetimes. Without accurate measures for school selectivity and large-scale student-level data, an examination of selective schools cannot take place in Australia that reflects this important research conducted in the UK.
We argue that research that critically compares the long-term outcomes of students attending fully and partially selective schools to non-selective school students is long-overdue. One study that compares the end of year examination outcomes of selective school students has been undertaken in Victoria, for three of the four fully selective schools in the state (Houng and Ryan, Citation2018). No such study of partially selective schools in New South Wales or Victoria is available in the public domain.
We also highlight the broader issue related to the lack of transparency around school’s selective enrolment processes. Beyond fully and partially selective schools that use entrance exams, there is no public information about the types of selective methods schools are using to enrol their students. In our sample, 38.9% of students attended a school that ‘sometimes’ considered academic performance during enrolment, but what form of academic performance is being considered (standardised tests, school assessments, written essays), and how many students are selected in this way is unclear. Australian schools, especially publicly funded government schools, are intended to be inclusive and provide opportunity to all (Education Council, Citation2019). We argue that if schools are enacting selective processes, they should be upfront about how they are doing so. This is important information for policy makers and researchers because selectivity can contribute to school stratification and residualisation in non-selective schools, as evidenced in both Australia (Bonnor and Shepherd, Citation2016; Ho, Citation2018) and the UK (Gorard and Siddiqui, Citation2018).
Future research on school selectivity is both important and timely in Australia since the states and territories are currently in the process of updating their school agreements with the federal government (Australian Government, Citation2023). An expert panel has been tasked with reviewing schools to guide the new agreement. Recently, the expert panel commissioned a report to explore international approaches to reduce segregation and reducing academic selectivity was highlighted as one approach that could be applied in the Australian context (Nous, Citation2023). Prior to this, New South Wales, reviewed entrance examination processes (NSW Government, Citation2020) and quotas for disadvantaged students were implemented (NSW Government, Citation2022), but no changes have been proposed in other Australian states, such as Victoria.
We argue that academically selective schools in the government sector contradict the principles of inclusive and equitable education which underpin Australia’s school system (Education Council, Citation2019). Rather than tweak some aspects of the enrolment processes, we see greater value in conducting a thorough and critical examination of fully and partially selective schools, and scaling back selectivity if the supposed benefits are not found.
10. Disclosure Statement
No potential conflict of interest was reported by the author(s).
Additional information
Funding
Notes
1. Includes persons who are engaged in either full-time work or study or who combine any hours of work with any hours of study.
12. References
- Australian Government. (2023). Improving Outcomes for all: Australian Government Summary Report of the Review to Inform a Better and Fairer Education System. Retrieved from https://www.education.gov.au/review-inform-better-and-fairer-education-system/review-inform-better-and-fairer-education-system-reports
- Birkelund, J. F., Capsada‐Munsech, Q., Boliver, V., and Karlson, K. B. (2021) Lives on track? long‐term earnings returns to selective school placement in England and Denmark, The British Journal of Sociology, 72 (3), 672–692. doi: 10.1111/1468-4446.12856
- Bonnor, C. and Shepherd, B. (2016). Uneven Playing Field: The State of Australia’s Schools. Retrieved from Sydney: https://cpd.org.au/wp-content/uploads/2016/05/The-State-of-Australias-Schools.pdf
- Campbell, C. (2019, 22 July). New South Wales has 48 selective schools, while Victoria has 4. There’s an interesting history behind this. The Conversation. Retrieved from https://theconversation.com/new-south-wales-has-48-selective-schools-while-victoria-has-4-theres-an-interesting-history-behind-this-118823
- Campbell, C. and Proctor, H. (2014) A History of Australian Schooling (Crows Nest, Allen & Unwin).
- Campbell, C., Proctor, H., and Sherington, G. (2009) School Choice: How Parents Negotiate the New School Market in Australia (Crows Nest, Allen & Unwin).
- Capsada-Munsech, Q. and Boliver, V. (2021) The early labour-market returns to upper secondary qualifications track in England, Longitudinal and Life Course Studies, 12 (3), 299–322. doi: 10.1332/175795921x16119468619598
- Chesters, J. (2018) The marketisation of education in Australia: does investment in private schooling improve post‐school outcomes?, Australian Journal of Social Issues, 53 (2) 139–157. doi: 10.1002/ajs4.38
- Coe, R., Jones, K., Searle, J., Kokotsaki, D., Mohd Kosnin, A., and Skinner, P. (2008). Evidence on the Effects of Selective Educational Systems. Retrieved from Durham https://www.gov.gg/CHttpHandler.ashx?id=97485&p=0
- Department of Education. (2014). A Review of the Longitudinal Surveys of Australian Youth Discussion Paper. Retrieved from Australian Government Department of Education: https://www.lsay.edu.au/publications/search-for-lsay-publications/2844
- Dockery, A. M. (2003). Happiness, Life Satisfaction and the Role of Work: Evidence from Two Australian Surveys (1740672798). Retrieved from https://www.researchgate.net/publication/228848009_Happiness_Life_Satisfaction_and_the_Role_of_Work_Evidence_from_Two_Australian_Surveys
- Dockery, A. M. (2016). Does Private Schooling Pay? Evidence and Equity Implications for Australia. Retrieved from https://hdl.handle.net/10620/18309
- Education Council. (2019). Alice Springs (Mparntwe) Education Declaration. Retrieved from https://www.dese.gov.au/alice-springs-mparntwe-education-declaration/resources/alice-springs-mparntwe-education-declaration
- Gemici, S. and Tham, L. (2014). Do Schools Influence Student Engagement in the High School Years? (1922056995). Retrieved from https://www.ncver.edu.au/research-and-statistics/publications/all-publications/do-schools-influence-student-engagement-in-the-high-school-years
- Gorard, S. and Siddiqui, N. (2018) Grammar schools in England: a new analysis of social segregation and academic outcomes, British Journal of Sociology of Education, 39 (7), 909–924. doi: 10.1080/01425692.2018.1443432
- Henderson, M., Anders, J., Green, F., and Henseke, G. (2022) Does attending an english private school benefit mental health and life satisfaction? From adolescence to adulthood, Cambridge Journal of Education, 52 (5), 539–553. doi: 10.1080/0305764X.2022.2040951
- Ho, C. (2018). Institutionalised Separation: The Impact of Selective Schools. Retrieved from Sydney: https://cpd.org.au/wp-content/uploads/2018/07/Institutionalised-Separation-Report-13-July.pdf
- Ho, C. (2020) Aspiration and Anxiety: Asian Migrants and Australian Schooling (Melbourne, Melbourne University Publishing).
- Houng, B. and Ryan, C. (2018). Achievement Gains from Attendance at Selective High Schools. Retrieved from Melbourne.
- Jerrim, J. and Sims, S. (2020) The association between attending a grammar school and children’s socio-emotional outcomes. New evidence from the millennium cohort study, British Journal of Educational Studies, 68 (1), 25–42. doi: 10.1080/00071005.2018.1518513
- Jones, A. M., Pastore, C., and Rice, N. (2018). Tracking Pupils into Adulthood: Selective Schools and Long-Term Well-Being in the 1958 British Cohort. Retrieved from http://www.york.ac.uk/economics/postgrad/herc/hedg/wps/
- Nous. (2023). Review of Policy Interventions to Increase Socio-Economic Diversity and Improve Learning Outcomes. Retrieved from https://www.education.gov.au/review-inform-better-and-fairer-education-system/resources/review-policy-interventions-increase-socioeconomic-diversity-and-improve-learning-outcomes
- NSW Government. (2020). Review of Selective Education Access: Findings and Action Plan. Retrieved from New South Wales: https://education.nsw.gov.au/content/dam/main-education/about-us/strategies-and-reports/media/documents/Review-of-Selective-Education-Access.pdf
- NSW Government. (2022). Selective School Changes Ensure Fair Access for All. Retrieved from https://education.nsw.gov.au/news/latest-news/selective-school-changes-ensure-fair-access-for-all
- NSW Government. (2023). Data Masterset. Retrieved from https://data.cese.nsw.gov.au/data/dataset/nsw-public-schools-master-dataset
- NSW Government. (2024a). List of Selective High Schools. Retrieved from https://education.nsw.gov.au/schooling/parents-and-carers/choosing-a-school-setting/selective-high-schools-and-opportunity-classes/year-7/what-are-selective-high-schools/list-of-selective-high-schools
- NSW Government. (2024b). What are Selective High Schools?. Retrieved from https://education.nsw.gov.au/schooling/parents-and-carers/choosing-a-school-setting/selective-high-schools-and-opportunity-classes/year-7/what-are-selective-high-schools
- Rowe, E. and Windle, J. (2012) The Australian middle class and education: a small-scale study of the school choice experience as framed by ‘my school’ within inner city families, Critical Studies in Education, 53 (2), 137–151. doi: 10.1080/17508487.2012.672327
- SEAL Academy. (2024). List of Accredited SEAL Schools. Retrieved from https://www.sealacademy.org.au/index.php/list-of-academy-seal-schools/school-list-2
- StataCorp. (2021) Stata Treatment Effects Reference Manual: Potential Outcomes/Counterfactual Outcomes. College Station (Texas, StataCorp LLC).
- Sullivan, A., Parsons, S., Green, F., Wiggins, R. D., Ploubidis, G., and Huynh, T. (2018) Educational attainment in the short and long term: Was there an advantage to attending faith, private, and selective schools for pupils in the 1980s?, Oxford Review of Education, 44 (6) 806–822. Retrieved from.10.1080/03054985.2018.1481378
- Sullivan, A., Parsons, S., Wiggins, R., Heath, A., and Green, F. (2014) Social origins, school type and higher education destinations, Oxford Review of Education, 40 (6), 739–763. doi: 10.1080/03054985.2014.979015
- Tham, M. (2021) School selectivity and socioeconomic and academic stratification in metropolitan Sydney and Melbourne. CIRES Working Paper 02/2021. Melbourne: Centre for International Research on Education Systems, Victoria University. https://vuir.vu.edu.au/42148/1/cires-working-paper-02-2021-final%20%281%29.pdf
- Varsik, S. (2022). A Snapshot of Equity and Inclusion in OECD Education Systems: Findings from the Strength through Diversity Policy Survey. Retrieved from Paris: https://www.oecd.org/education/a-snapshot-of-equity-and-inclusion-in-oecd-education-systems-801dd29b-en.htm#:~:text=Findings%20from%20the%20Strength%20through%20Diversity%20Policy%20Survey,-The%20Strength%20through&text=Education%20systems%20identified%20equity%2Finclusion,non%2Dinstructional%20support%20to%20students
- Veenhoven, R. (1996) The Study of Life-Satisfaction (Budapest, Eötvös University Press).
- Watson, N. and Wooden, M. (2009) Identifying factors affecting longitudinal survey response. In P. Lynn (Ed.) Methodology of Longitudinal Surveys (Chichester, John Wiley and Sons), 157–179.
- Windle, J. (2015) Making Sense of School Choice: Politics, Policies, and Practice under Conditions of Cultural Diversity (New York, Springer).
Appendix A.
Sample sizes and response rates, LSAY09.
Appendix B.
Student sample numbers by school academic admission status.
Appendix C.
Sample of the LSAY ite We used responses to Q19b.
Appendix D.
Distribution of students across school sectors by socioeconomic quartile.
Appendix E.
Outcomes, by regression analysis results: marginal effects.