Abstract
1. The study examined the practicality and usefulness of fractal analyses in evaluating the temporal organisation of avian ambulatory behaviour by using female Japanese quail in their home boxes as the model system. To induce two locomotion activity levels, we tested half of the birds without disturbance (Unstimulated) and the other half when food was scattered on the floor of the home box after 3 h of feeder withdrawal (Stimulated).
2. Ambulatory activity was recorded during 40 min at a resolution of 1 s and evaluated by: (1) detrended fluctuation analyses (DFA), (2) the frequency distribution of the duration of the walking or non-walking events (FDD-W or FDD-NW, respectively), and (3) the transition probabilities between walking/non-walking states. Conventional measures of total time spent walking and average duration of the walking/non-walking events were also employed.
3. DFA showed a decreased value of the self-similarity parameter (α; indicative of a more complex ambulatory pattern) in Stimulated birds compared to their Unstimulated counterparts. The FDD-NW showed a more negative scaling factor in Stimulated than in Unstimulated birds. Stimulated birds also had more transitions between non-walking and walking states, consistent with stimulated exploratory activity. No differences were found between groups in the FDD-W, in percentage of total time spent walking, or in average duration of the walking events.
4. The temporal walking pattern of female Japanese quail has a fractal structure and its organisation and complexity is altered when birds are stimulated to explore. The fractal analyses detected differences between the Unstimulated and Stimulated groups that went undetected by the traditional measurements of the percentage of total time spent walking and the duration of the walking events suggesting its usefulness as a tool for behavioural studies.
Introduction
The use of fractal analyses (FA) as effective tools to measure the temporal complexity of a particular behaviour is emerging. Because FA consider the complete sequence of the given behaviour, they provide additional and complementary information to the standard (conventional) behavioural analyses that often summarises a specific behavioural activity performed without considering the structure of the activity sequence. For example, Rutherford et al. (Citation2003) showed in domestic chickens that FA were particularly sensitive to changes in the organisation of temporal behavioural patterns such as an increase in the complexity of vigilance behaviour following restraint and blood sampling. The home pen behavioural complexities they reported using FA were not revealed by the standard measurements of total time spent vigilant. Moreover, FA can help in understanding biological systems. Goldberger et al. (Citation2002) proposed that the application of FA may aid the assessment of cardiac risk and help forecast sudden cardiac death in humans. They also suggested that similar approaches show promise in assessing other regulatory systems, such as human gait control in health and disease.
The use of FA as a non-invasive means of assessing welfare-related behaviours is receiving growing attention as well. For example, FA in pregnant or parasitised Spanish ibex showed a less complex pattern of vigilance and feeding behaviours than found in the controls (Alados et al., Citation1996). Lowered complexity in the reproductive behaviour of fathead minnows exposed to lead (Alados and Weber, Citation1999) and in the social behaviour of diseased chimpanzees (Alados and Huffman, Citation2000) has also been reported using FA. More recently, Rutherford et al. (Citation2003) and María et al. (Citation2004) both found FA to be an effective non-invasive method to evaluate stress related responses in domestic fowl.
A key feature of fractal patterns is the statistical property of scaling. In this context, scaling means that the properties of the structure or process do not vary with the scale or resolution of the analyses. Fractal structures or processes are made up of subunits (and sub-subunits, etc.) that resemble, statistically, the structure or process of the overall object or phenomena (Goldberger et al., Citation2002). For a fractal object or process, a power law describes the relationship between measured size and measurement scale. In FA, the degree of scaling is measured and assigned a parameter, typically called the fractal dimension, which is seen as a measure of complexity of the phenomenon studied (Goldberger et al., Citation2002). Fractal time series have another interesting characteristic, long-range autocorrelation, when the behaviour at any instant depends (in a statistical sense) on the behaviour at relatively remote times and its influence decays in a scale-invariant, fractal manner (Hausdorff et al., Citation2001). Detrended fluctuation analysis (DFA) is a FA that detects long-range (auto-) correlations in time series, even if they are non-stationary (that is, their statistical properties change with time). The self-similarity parameter, α, estimated with DFA indicates the autocorrelation structure of the time series, and also is inversely related to a typical fractal dimension. For the correct interpretation of the scaling results obtained by DFA, it is crucial to understand the intrinsic dynamics of the system under study. One of the common challenges is that crossovers (changes in the α-value for different ranges of scales) often exist (Blesić et al., Citation2003; Ferri et al., Citation2005). A crossover can arise from actual changes in the correlation properties of the signal at different time or space scales (two levels of complexity), or from trends (a smooth and monotonic or slowly oscillating pattern caused by external effects) that were not correctly eliminated by the DFA (Hu et al., Citation2001; Kantelhardt et al., Citation2001). The existence of trends in time series generated by biological systems is very common and almost unavoidable (Hu et al., Citation2001). For this reason, efforts should be made to systematically study the trends in time series data. However, most of the biological studies that use DFA do not appear to consider the presence of trends of orders higher than one in their time series.
Behaviours are often performed with short events and inter-event intervals. Mishra et al. (Citation2005) found that many behavioural events are non-randomly distributed in the sense that the start or end of an event did not follow a Poisson process. By evaluating the frequency distribution of the duration of events (also called residence times) it can be determined whether or not they arise from such random processes and also if they present a fractal structure. This structure is observed when the residence time is described by a power–law distribution. The tail of a power–law distribution indicates that there are a higher proportion of large residence times, than with Gaussian or exponential distributions (Schmitt et al., Citation2006).
Ambulatory behaviour has been used in poultry to characterise many situations, such as home cage activities, social interactions, fear responses, stress responses (Gallup and Suarez, Citation1980; Jones and Faure, Citation1982; Grigor et al., Citation1995; Riedstra and Groothuis, Citation2002). However, most ambulation studies performed to date have provided only mean durations or the percentage of time spent in a particular area of a test apparatus. The reported percentages of time spent walking and the distances travelled in these studies give no information about how these activities were temporally organised.
The present study was designed to examine the underlying principles, methodologies and practicalities of using FA to assess avian ambulatory behaviour – specifically, female Japanese quail in their home boxes. In order to induce two different activity levels, we tested half of the animals without disturbance (Unstimulated group) and the other half when food was scattered on the floor of the home box after 3 h of feeder withdrawal (quail Stimulated to explore). However, it is important to note that because of spill-over from the feeders, birds were not completely food deprived during the 3 h of feeder withdrawal. Ambulatory activity was evaluated by: (1) detrended fluctuation analysis (DFA), (2) the frequency distribution of the duration of the walking or non-walking events (FDD-W or FDD-NW, respectively), and (3) the transition probabilities between the walking/non walking states. The standard (conventional) measures of percentage of total time spent walking and average duration of the walking/non-walking events were also recorded for comparative purposes. We addressed the following main questions. Firstly, is the walking behaviour of Japanese quail in their home box fractally organised? Secondly, is that organisation altered when food is scattered on the floor (providing for a more complex environment and stimulating the birds to explore); and, if so, does the behaviour have a more complex organisation? Finally, can FA provide additional information that would not have been detected using only the standard measurements of percentage of total time spent walking and the average duration of the walking events?
Materials and Methods
Animals and husbandry
We used Japanese quail (Coturnix coturnix japonica), recognised as a useful model for extrapolating results to domestic chickens (Baumgartner, Citation1994; Faure et al., Citation2003) as well as an important agricultural species for meat and egg production in many countries (Baumgartner, Citation1994; Jones, Citation1996).
Forty newly-hatched Japanese quail were obtained from a local breeder. Upon receipt, birds were housed in groups of 10 in white wooden boxes measuring 43 × 84·5 × 45 cm (length × width × height). At 26 d of age, birds were sexed by plumage colouration and housed as male/female pairs in smaller white wooden boxes (43 × 41·7 × 46 cm). Females were designated as the test bird and faintly marked on their heads with non-toxic paint to facilitate their discrimination from males on video tapes (see below).
Birds were kept on a 14 h L : 10 h D (Light : Dark) illumination cycle with lights-on at 06:00 h. The brooding temperature was 37·5°C during the first week of life, with a weekly decline of approximately 3°C until room temperature of 28 ± 2°C was reached. Relative humidity was 50 ± 5% during the study. Food (minimum of 200 g crude protein and 12·13 MJ ME/kg of feed) and water were supplied ad libitum. There was one feeder and one drinker per box. Box floors were covered in sand and a wire-mesh lid prevented the birds from escaping.
General procedures
At 32 or 33 d of age, 16 female birds were tested in their home boxes and were assigned at random to one of the two treatment groups. A video camera was placed above each box 5 min before testing (to allow acclimatisation to its presence) and the lid was removed. During tests, half of the birds remained unstimulated at all times in order to register their basal activity (Unstimulated group). The other half was subjected to feeder withdrawal 3 h before testing and then, immediately before testing, 5 g of the same food described above was scattered on the floor of the home box (Stimulated group). This procedure was intended to increase motivation to search for food and ensure a period of active behaviour during the subsequent observations. Because of spill-over from feeders and because only two birds were in each box some food was always present on the floor of the box. Water was also always available. Birds from different boxes were visually isolated from each other and only one bird was tested per observation period. Testing order of the individuals was randomised over the two treatments and two test days avoiding the testing of birds of neighbouring boxes during two consecutive observation periods (in order to minimise disturbance of the next test bird). During the observation period, the experimenter did not enter the room. All tests were conducted between 09:30 h and 16:30 h over two con-secutive days. Testing of Stimulated and Unstimulated groups were balanced across time within each day.
The walking behaviour was recorded on to videotape for 40 min. However, because of technical problems at the end of a video, the test duration for behaviour analyses was reduced to 39 min (2340 s). Whether the bird was walking or not walking was hand-recorded at a resolution of 1-s intervals based on re-play of the video recordings. A bird was considered to be walking whenever it took a step in any direction. All data were collected by the same trained observer. A digital clock with an audible tick every second was super-imposed to the video images to facilitate data collection. During training, multiple fragments of the same videos were processed three times and differences found among time series entries were always less than 0·5%.
The following variables were studied:
-
Percentage of time spent walking:
where ti is the ith 1-s interval of time in which the animal was walking (ti = 1 when walking, and ti = 0 when not walking) and N is the total duration of the test (s).
-
Walking event (s): interval of time (>1 s) in which the animal walked continuously.
-
Non-walking event (s): interval of time (>1 s) in which the animal did not walk.
-
The average duration of the walking/non-walking events was calculated for each bird from its walking and non-walking event data.
Data analysis
Power spectrum analysis
In order to accurately use DFA (see below), a given time series must not present periodic oscillations. Thus, the presences of periodic oscillations were evaluated using the power spectrum analysis tool from SigmaPlot (SPSS, Citation2001).
Detrended fluctuation analysis (DFA)
The method used to analyse the walking pattern of the birds was introduced by Peng et al. (Citation1994) and described in detail elsewhere (Kantelhardt et al. Citation2001; Kembro et al., Citation2008). A time series of mutually exclusive behavioural states (walking or not walking; binary scale) was registered at 1-s resolution. Thus, at any given interval, if the bird was walking, a number one was recorded and if the bird was not walking, a zero was recorded.
The general mean value of xi was calculated for each time series (Equation Equation1)
In the next step, the variance inside each of the k windows was calculated by:
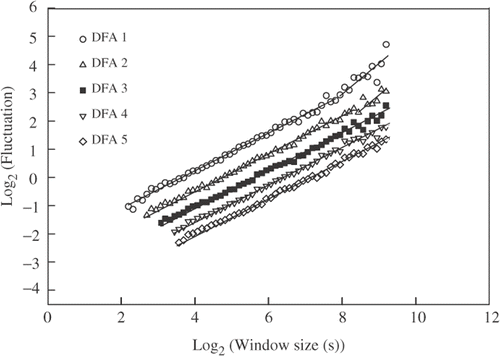
Kantelhardt et al. (Citation2001) reported that trends in the original time series data can lead to an artificial crossover in the slope of the log–log plot of F(n) vs. n, that is, the slope α is increased for large time scales. To determine the order of DFA that would eliminate these trends, and to estimate the value of α reliably, DFA was calculated with different detrending orders. For this purpose, linear (DFA1), square (DFA2), cubic (DFA3) and higher order polynomials were used in the fitting procedure. Since the detrending of Yj time series is performed by subtraction of the fits from data, these methods differ in their capability of eliminating trends in the data. In the mth order DFA (DFAm), trends in the original time series yi of order m − 1 are eliminated (Kantelhardt et al., Citation2001). In other words, the artificial crossover (more than one linear fit) disappears when the detrending order used in the DFA is larger than the order of the trend in the original series. For example, if linear trends are present in the original walking/not walking time series, DFA2 and higher would eliminate the artificial crossover produced by the linear trends. Therefore, after evaluating the fits of all DFA performed with different detrending orders, we selected the lowest detrending order that eliminated trends in all data series and used this order for comparison of the two feed treatment groups.
Frequency distribution of the duration of walking and non-walking events (FDD-W and FDD-NW, respectively)
The FDD-W and FDD-NW events were analysed by plotting in a double logarithm scale the frequency vs. the duration of walking or non-walking events, respectively. We evaluated whether the frequency distributions adjusted to linear fits in log–log plots. When a linear fit coefficient of determination (R 2) was found to be higher than 0·7, it was interpreted that the distribution was probably representative of a power–law (fractal) distribution. The slope of the linear fit is known as the scaling factor (S) and was determined for both the walking (SW) and the non-walking (SNW) events. We also examined the R 2 value of the linear fit when plotted on a semi-log scale that would correspond to an exponential distribution. In order to consider the frequency distribution as a power law, the R 2 value had to be higher in the fit to the log–log than to the semi-log plot. As a control of the method, the same time series data were also randomly shuffled. In that case, after randomisation of data, the distributions have to fit as exponentials.
Transition between states
In a given time t, a bird could be in one of two mutually exclusive behavioural states: W or NW. Thus, there were 4 “transition” possibilities: at t the bird is W and at t + 1 it continues W (transition W–W); at t the bird is NW and at t + 1 it is W (transition NW–W), and vice-versa (transition W–NW); or, the bird is NW at t and continues NW at t + 1 (transition NW–NW). Considering that the walking series have only two possible behavioural states (W or NW), transition NW–W and W–NW have almost identical values and therefore, only the NW–W transitions were considered in this study. The transitions were calculated by counting the number of times a given transition appeared in the time series, divided by the total number of transitions. Values were expressed as percentages.
Statistical analyses
A one-way ANOVA was used to determine differences in a given parameter between Unstimulated and Stimulated birds. In all cases, the ANOVA assumptions were verified. To examine the associations between variables, a Spearman rank correlation test was performed. A P-value of less than 0·05 was considered to represent significant differences.
Results
In order to accurately estimate the self-similarity parameter (α) with DFA, prior to the estimation we made certain that no possible periodic oscillations were affecting the time series, and we systematically studied the possibility of trends (external effects with smooth and monotonic or slowly oscillating characteristics) in the time series. Power spectrum analyses were performed on all walking/non walking time series (see Materials and Methods section) and a high spike at the fundamental frequency was found in all the series that is a characteristic of non-oscillatory series (). The possible presence of trends in the data time series was systematically studied by applying consequently higher polynomial orders to the fitting procedure of DFA (see the Material and Methods section). Several time series showed more than one slope (artificial crossovers) when using DFA1 and DFA2 (). However, these crossovers disappeared when DFA of order 3 or higher were used. Additional evidence of the existence of crossovers is that the α-values observed when using DFA1 or DFA2 were larger than the α-values estimated for the same original time series with DFA3 (up to a 0·12 difference in the α-value was observed comparing DFA1 and DFA3). On the other hand, when α-values were calculated with detrending orders of third degree and above, they remained practically constant (differences were always lower than 0·03). Therefore, DFA3 (third order) was selected for latter group comparisons.
Figure 1. Example of a power spectrum analyses of the original time series data. All data time series showed similar patterns.
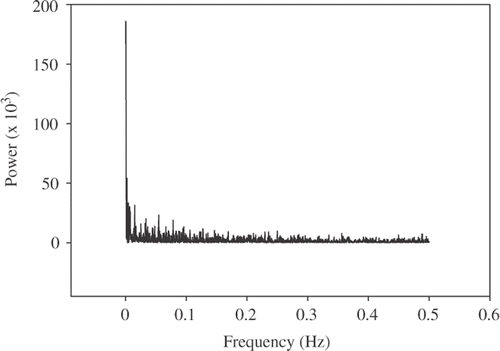
Figure 2. Example of trend elimination capability of DFA in time series using linear (DFA1), quadratic (DFA2), cubic (DFA3), fourth order (DFA4) and fifth order (DFA5) DFA. For DFA1 and DFA2 a crossover is observed (change in slope) that is not present with DFA3, DFA4 and DFA5. DFA3 (▪) was selected for group comparisons, given that third order polynomials eliminated trends in data. In order to improve visualisation, the functions were shifted vertically by multiples of 0·3.
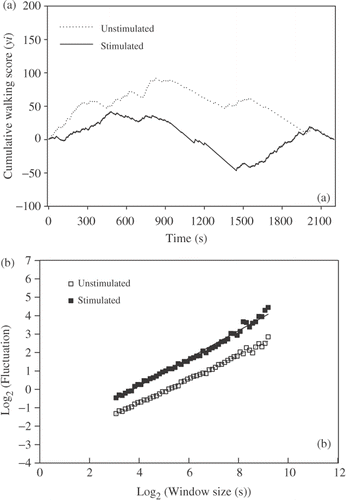
After DFA3 analysis of the walking pattern, the self-similarity parameter (α) was calculated. ANOVA showed a higher α (F 1,14 = 5·60, P < 0·03) in the Unstimulated (0·76 ± 0·02) (mean ± SE) bird group compared to their Stimulated (0·69 ± 0·02) counterparts Figure (), (). These α-values indicate long-range autocorrelations in the walking patterns of all tested birds. As a control of the DFA technique, the α-value was also calculated after the time series data were randomized (random shuffling of the 2340 data points). In that case, all data series showed α-values close to the expected 0·5 value (0·50 ± 0·01) indicating that DFA was not affected by artefacts of the methods.
Figure 3. (a) Example of two cumulative walking time series. (b) Detrended Fluctuation Analyses for the same series presented in (a). The series corresponded to the examples of the Unstimulated and Stimulated groups and are characterized by the equations, y = 0·77x – 2·95 (R 2 = 0·99) and y = 0·67x −3·49 (R 2 = 0·99), respectively.
The possibility of a correlation between the α-value and the percentage of total time spent walking was evaluated. Therefore, Unstimulated and Stimulated groups were studied both separately and together. No significant correlations were found (r s = 0·57, N = 8, P = 0·14; r s = 0·36, N = 8, P = 0·39; r s = 0·038, N = 16, P = 0·89, respectively).
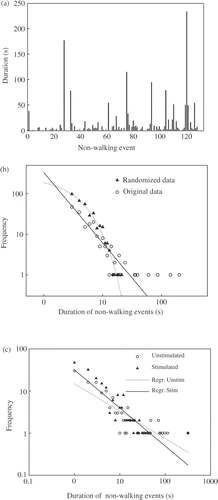
A series of successive durations of non-walking events is shown in . Many long durations of non-walking events were present, indicating an asymmetric frequency distribution of the duration of the non-walking events. This frequency distribution is compatible with a linear fit in a log–log plot of all treatments (R 2 = 0·80; P < 0·0001) and when each feeding treatment was plotted separately (R 2 = 0·72; P < 0·0001) suggesting power–law distributions. Thus, the FDD-NW events also seem to show a fractal structure. Again, as a control of the method, the same time series data were randomly shuffled. As expected after randomisation of data, the distributions fitted better as an exponential (R 2 > 0·88; P < 0·0001) (). The amount of data obtained per animal is not enough to accurately represent the tails of the numerical distributions; nevertheless, the Stimulated group had more negative SNW (F 1,14 = 8·69, P < 0·05) than their Unstimulated counterparts (; ). A power–law distribution was also found in the FDD-W (R 2 = 0·88; P = 0·018). The group of Stimulated birds did not show differences in their SW (F 1,14 = 3·72, P = 0·07) compared to the Unstimulated birds ().
Figure 4. (a) Example of successive non-walking periods (events) and their time duration (s). Many large events are visible. (b) Example of log–log plot of the frequency distribution of non-walking events of a given duration, original and randomized time series are presented. Notice that the original time series shows a power law distribution (straight line) while the randomized time series has an exponential distribution (dotted line). (c) Examples of logã–log plots of the frequency of the duration of non-walking events in the Unstimulated and Stimulated groups. Reg. Stim. and Reg. Unstim. represent the regression line for Stimulated and Unstimulated birds, respectively.
ANOVA showed no significant differences between feed treatment groups in the percentage of time spent walking (F 1,14 = 1·99, P = 0·18) or in the average duration of the walking events (F 1,14 = 1·92, P = 0·19). However, the duration of the non-walking events was higher (F 1,14 = 7·35, P < 0·02) in the Unstimulated group compared to the Stimulated group ().
Table 1. Behavioural analysis of the female Japanese quail walking activity
The transitions between the behavioural states, walking/non-walking, are shown in . No difference (F 1,14 = 0·08, P = 0·78) was found between the two treatment groups in the number of W–W transitions. Stimulated birds showed a higher (F 1,14 = 7·79, P < 0·01) percentage of NW–W transitions and a tendency (F 1,14 = 3·57, P = 0·08) for a lower percentage of transitions NW–NW when compared to their Unstimulated counterparts.
Table 2. Analysis of the transition between behavioural states, walking/not walking, in behavioural time series of Japanese quails in two experimental situations
Discussion
Detrended fluctuation analyses of the data series using a detrending of first and second order showed artificial crossovers in several of the log–log plots of fluctuation vs. window size, indicating the presence of trends in data. These trends were eliminated using DFA of third order or higher. Therefore, all DFA analyses used for later group comparisons were of third order. Our results support the contention that, a priori, a DFA of first order should be used with caution because biological data are frequently affected by trends (Hu et al., Citation2001) that may lead to miscalculation of the α-value. No periodic oscillations in data series were found suggesting that DFA was accurately applied to our data series.
The pattern of fluctuation between walking and non-walking showed long-range autocorrelations in both Unstimulated and Stimulated groups as indicated by the α-values obtained (0·76 ± 0·02 and 0·69 ± 0·02, respectively). This means that walking behaviour at one moment is statistically correlated with walking behaviour at a relatively remote time, and its influence decays in a scale-invariant, fractal manner. Long-range autocorrelations were also found in minnow reproductive behaviour (Alados and Weber, Citation1999), chimpanzee social behaviour (Alados and Huffman, Citation2000), and domestic fowl walking and vigilant behaviour (Rutherford et al., Citation2003; María et al., Citation2004).
The analysis of variance found significant differences in the α-value between Unstimulated and Stimulated birds in spite of the low number of birds tested. This result suggests that DFA is sensitive in identifying behavioural patterns obtained under different test situations. The reduced α-value found in the Stimulated group when compared to the Unstimulated group indicates a more complex locomotor behaviour (less regular activity pattern) developed in that group. Providing food to explore in the birds’ rearing environment has been proposed as a way to increase environmental complexity (Bizeray et al., Citation2002); thus, the increase in complexity of the temporal walking pattern could be a response to a more complex environment. However, because the motivation to explore (searching for food or responding to new fresh food odours) may also have been altered, a hypothesis that a positive relationship between environmental and behavioural complexity could exist remains guarded until further FA studies that evaluate that relationship are developed.
It has been proposed that domestic chickens have not lost their ability to respond in an adaptive manner to the environment, in comparison to their wild ancestors (Andersson et al., Citation2001). This is demonstrated by the fact that the behavioural repertoire of domesticated birds is comparable with that of their wild ancestors (Appleby et al., Citation1992; Väisänen and Jensen, Citation2003). However, some aspects of the domestic chickens’ behavioural strategies may have been altered, such that these strategies have become less energy-demanding. This may be regarded as a passive adaptation to a domesticated life (Andersson et al., Citation2001) and could be due to the fact that during domestication the need to spend energy in searching for food decreases (Price and King, Citation1968). Our results show that Japanese quail can also respond in an adaptive manner if their environment is modified by adopting a more complex temporally-organised behaviour (and probably a more energy-demanding behaviour) if food availability in their environment is altered. A comparative study using FA tools between the behavioural responses of the Red jungle fowl and domesticated chickens under different test situations could help to understand how the organisation of behavioural patterns (for example, walking, pecking or vigilance) has been modified by domestication.
Rutherford et al. (Citation2003) found that walking behaviour in domestic chickens was much more randomly organised (more complex) than vigilant behaviour, suggesting a genuine difference in organisation between walking and vigilance. However, they suggested that the difference could also have been due to an artefact of the method because of the low incidence of walking activity in their experiment (their chickens walked only 4% of the time). Considering that we found very similar values of the self-similarity parameter, α, in the walking pattern of a closely related species (Japanese quail) that walked a considerably higher proportion of time (13·70 ± 2·55%) than domestic chickens, it can be suggested that the α-values within the range of 0·69 and 0·76 may be a characteristic of the walking pattern of poultry in general, although it should be taken into account that age may affect the value of α. For example, the locomotor activity of older chickens was more complex (had a lower α-value) than younger birds when the age of the birds ranged from 81 to 137 d (Maria et al., Citation2004). In contrast to Rutherford et al. (Citation2003), we did not find a significant positive correlation between our α-value and the percentage of time spent walking, suggesting that a change in the complexity of a temporal pattern of behaviour can occur independently of an increase in the total time spent performing that behaviour.
The change in a behavioural pattern may be related to the underlying dynamics of the test situation. For example, in domestic chickens, the complexity of the walking pattern compared to controls was significantly increased when strangers where introduced into the home pen, and reduced upon 12 h of feeder withdrawal (Maria et al., Citation2004). In our study, a procedure that involved the withdrawal of the main source of food was also applied (during the 3 h prior to testing). However, we found an increased complexity (α-value showed a significant reduction) in the Stimulated group compared to the Unstimulated group. The contrasting results between our study and Maria et al. (Citation2004) could reside in fundamental differences in the procedures used. Not only were there differences in the time intervals the animals were exposed to feeder withdrawal, but, also in contrast to María et al. (Citation2004), we scattered a small amount of food (5 g) on the ground immediately before testing in order to enrich the environment. Moreover, our birds were never without any available food (because of spill over from feeders).
Mishra et al. (Citation2005) showed that both the durations of behavioural events (such as walking, drinking, and dustbathing) and the inter-event intervals in domestic hens are distributed non-randomly i.e., not consistent with the start or end of an interval following a Poisson process. In our study we also found this with FDD-W and the FDD-NW data. More precisely, we found that both frequency distributions seem to show linearity in a log–log plot of all treatments indicating power–law frequency distributions. Thus, the power law distribution evident implies that the walking pattern of quail may have a fractal structure, and is not Gaussian. Thus, it is important to consider that comparisons of experiments with different test durations using the mean values of behaviours that have a fractal structure may not be meaningful, because the mean value depends on the duration of the test (for a more detailed discussion on this subject see Liebovitch et al., Citation1999).
Birds in the Stimulated group had a significantly more negative scaling factor, SNW, than their Unstimulated counterparts. This could be related to the presence of a significantly higher percentage of NW–W transitions and a tendency towards less NW–NW transitions in the Stimulated group. These results are consistent with the significantly lower average duration of the non-walking events in the Stimulated group compared to the Unstimulated group. Interestingly, although the duration of both non-walking and walking events showed a power–law distribution, the changes in behavioural patterns were detected only by the changes in the scaling factor, SNW. Quail of the Stimulated group also had a tendency toward a more negative SW scaling factor, but this was not accompanied either by a detectable change in the average duration of walking event nor by a change in the percentage of W–W transitions. The higher percentage of transitions between different behavioural states and the smaller duration of the non-walking events are consistent with stimulated ambulatory activity. Our findings, showing an altered ambulatory activity in the group evaluated with food scattered on the floor, suggest that this procedure may be a useful way to help exercise the birds and perhaps improve leg condition, particularly if this technique is proven to improve activity in broilers and could be made practical under commercial conditions.
Although it is usually useful to characterise the behaviour of an organism by some long-term average measure, this procedure ignores its temporal structure (Cole, Citation1995). In our study the average percent of time spent walking did not provide information about how walking was distributed in time, nor did the measure distinguish between the two feed treatment groups, at least at the sample size employed. Interestingly, differences between the Unstimulated and Stimulated groups were found in the α-values and the scaling exponents of SNW. In other words, the scattering of food (whether by changing the environmental complexity or by alterations in the motivational state of the birds), affected the temporal organisation of walking and not the total percentage of time spent walking. Thus, by ignoring the temporal pattern of behaviour, not only would understanding of the behavioural complexity have been incomplete, but also some interpretations may not have been valid (Cole, Citation1995). Because the scaling factor of the frequency distribution of the durations of the walking or non-walking events and the self-similarity parameter (α) are independent of the time scale used (within certain limits), they could be considered a way to characterise the temporal organisation of the walking pattern, complementing the other standard measurements typically used in behavioural studies. Also, fractal analyses could be useful to compare studies with different test durations.
In conclusion, the temporal walking pattern of female Japanese quail has a fractal structure and its organisation and complexity is altered when birds are stimulated to explore. The fractal analyses detected differences between groups that went undetected by the traditional measurements of percentage of total time spent walking or the duration of the walking events. These results indicate the usefulness of fractal analyses in detecting changes in the temporal organisation of ambulation and extracting information that complements that obtained with standard measures. Considering the temporal fractal structure of the walking behaviour, we strongly recommend that comparisons between experiments with different test durations using mean measurements of behaviour duration or frequency be done with caution. Moreover, because fractal patterns are independent of the time scale used (within certain limits), they could be considered as a tool to characterise a given behaviour and be used to compare studies with different test durations.
Acknowledgments
We thank Dr Dante Chialvo for his advice on data analysis, Dr R. Bryan Jones for his helpful comments on a previous version of this manuscript and Diego A. Guzmán for his help during the developing of the experiment. This work was supported by grants from SeCyT-UNC, FONCYT (PICT 34157) and CONICET, Argentina. JMK is a graduate student of the Doctorado en Ciencias Biológicas, FCEFyN, UNC, Argentina and holds a fellowship from CONICET. MAP and RHM are career members of the later institution. Approved for publication by the Director of the Louisiana Agricultural Experiment Station as manuscript number 07-18-0359.
Related Research Data
References
- Alados , CL and Huffman , MA . 2000 . Fractal long-range correlations in behavioural sequences of wild chimpanzees: a non-invasive analytical tool for the evaluation of health . Ethology , 106 : 105 – 116 .
- Alados , CL and Weber , DN . 1999 . Lead effects on the predictability of reproductive behaviour in fathead minnows: a mathematical model . Environmental Toxicology and Chemistry , 18 : 2392 – 2399 .
- Alados , CL , Escos , JM and Emlen , JM . 1996 . Fractal structure of sequential behaviour patterns: an indicator of stress . Animal Behaviour , 51 : 437 – 443 .
- Andersson , M , Nordin , E and Jensen , P . 2001 . Domestication effects on foraging strategies in fowl . Applied Animal Behaviour Science , 72 : 51 – 62 .
- Appleby , MC , Hughes , BO and Elson , HA . 1992 . Poultry Production Systems: Behavior, Management and Welfare , Wallingford, UK : CAB International .
- Baumgartner , J . 1994 . Japanese quail production, breeding and genetics . World Poultry Science , 50 : 227 – 235 .
- Blesić , S , Milošević , S , Stratimirović , DJ and Ljubisavljević , M . 2003 . Detecting long-range correlations in time series of neuronal discharges . Physica A , 330 : 391 – 399 .
- Bizeray , D , Estevez , I , Leterrier , C and Faure , JM . 2002 . Effects of increasing environmental complexity on the physical activity of broiler chicken . Applied Animal Behaviour Science , 79 : 27 – 41 .
- Cole , BJ . 1995 . Fractal time in animal behaviour: the movement activity of Drosophila . Animal Behaviour , 50 : 1317 – 1324 .
- Faure , JM , Bessei , W and Jones , RB . 2003 . “ Direct selection for improvement of animal well-being ” . In Poultry Genetics, Breeding and Biotechnology , Edited by: Muir , WM and Aggrey , S . 221 – 245 . Wallingford, UK : CABI Publishing .
- Ferri , R , Rundo , F , Bruni , O , Terzano , MG and Stam , CJ . 2005 . Dynamics of the EEG slow-wave synchronization during sleep . Clinical Neurophysiology , 116 : 2783 – 2795 .
- Gallup Jnr , GG and Suarez , SD . 1980 . An ethological analysis of open-field behaviour in chickens . Animal Behaviour , 28 : 368 – 378 .
- Goldberger , AL , Amaral , LAN , Hausdorff , JM , Ivanov , PCH , Peng , C-K and Stanley , HE . 2002 . Fractal dynamics in physiology: alterations with disease and aging . Proceedings of the National Academy of Science, USA , 99 : 2466 – 2472 .
- Grigor , PN , Hughes , BO and Appleby , MC . 1995 . Social inhibition of movement in domestic hens . Animal Behaviour , 49 : 1381 – 1388 .
- Hausdorff , JM , Ashkenazy , Y , Peng , C-K , Ivanov , PCH , Stanley , HE and Goldberger , AL . 2001 . When human walking becomes random walking: fractal analysis and modelling of gait rhythm fluctuations . Physical A , 302 : 138 – 147 .
- Hu , K , Ivanov , PCH , Chen , Z , Carpena , P and Stanley , HE . 2001 . Effect of trends on detrended fluctuation analysis . Physical Review E , 64 : 011114 (19 pages)
- Jones , RB . 1996 . Fear and adaptability in poultry: insights, implications and imperatives . World's Poultry Science , 52 : 131 – 174 .
- Jones , RB and Faure , JM . 1982 . Open-field behaviour of male and female domestic chicks as a function of housing conditions, test situation and novelty . Biology of Behaviour , 7 : 17 – 25 .
- Kantelhardt , JW , Koscielny-Bunde , E , Rego , HHA , Havlin , S and Bunde , A . 2001 . Detecting long-range correlations with detrended fluctuation analysis . Physica A , 295 : 441 – 454 .
- Kembro , JM , Satterlee , DG , Schmidt , JB , Perillo , MA and Marin , RH . 2008 . Open-field temporal pattern of ambulation in Japanese quail genetically selected for contrasting adrenocortical responsiveness to brief manual restraint . Poultry Science , 87 : 2186 – 2195 .
- Liebovitch , LS , Todorov , AT , Zochowski , M , Scheurle , D and Colgin , L . 1999 . Nonlinear properties of cardiac rhythm abnormalities . Physical Review E , 59 : 3312 – 3319 .
- María , GA , Escós , J and Alados , CL . 2004 . Complexity of behavioural sequences and their relation to stress conditions in chickens: a non-invasive technique to evaluate animal welfare . Applied Animal Behaviour Science , 86 : 93 – 104 .
- Mishra , A , Koene , P , Schouten , W , Spruijt , B , Van Beek , P and Metz , JHM . 2005 . Temporal and sequential structure of behavior and facility usage of laying hens in an enriched environment . Poultry Science , 84 : 979 – 991 .
- Peng , C-K , Buldyrev , SV , Havlin , S , Simons , M , Stanley , HE and Goldberger , AL . 1994 . Mosaic organization of DNA nucleotides . Physical Review E , 49 : 1685 – 1689 .
- Press , WH , Flannery , BP , Teukolsky , SA and Vetterling , WT . 1992 . Numerical Recipes in C , Cambridge, UK : Cambridge University Press .
- Price , EO and King , JA . 1968 . “ Domestication and adaptation ” . In Adaptation of Domestic Animals , Edited by: Hafez , ESE . 34 – 45 . Philadelphia, PA : Lea & Feibiger .
- Riedstra , B and Groothius , TGG . 2002 . Early feather pecking as a form of social exploration: the effects of group stability on feather pecking and tonic immobility in domestic chicks . Applied Animal Behaviour Science , 77 : 127 – 138 .
- Rutherford , KM , Haskell , M , Glasbey , C , Jones , RB and Lawrence , A . 2003 . Detrended fluctuation analysis of behavioural responses to mild acute stressors in domestic hens . Applied Animal Behaviour Science , 83 : 125 – 139 .
- Schmitt , FG , Seuront , L , Hwang , JS , Souissi , S and Tseng , LC . 2006 . Scaling of swimming behaviour: Data analysis and simulation . Physica A , 364 : 287 – 296 .
- SPSS . 2001 . SigmaPlot 2001 Users guide , Chicago, IL : Jaendel Scientific. SPSS Science Inc . Version 7·0
- Väisänen , J and Jensen , P . 2003 . Social versus exploration and foraging motivation in young red jungle fowl (Gallus gallus) and White Leghorn layers . Applied Animal Behaviour Science , 84 : 139 – 158 .