
ABSTRACT
1. The objective of this study was to compare the effects of pre- and post-pellet whole grain wheat additions to diets on growth performance, gizzard and pancreas development, nutrient utilisation and starch and protein (N) digestibility coefficients in broiler chickens via an equilateral triangle response surface design.
2. The three apical treatments of the equilateral triangle comprised (1A) a standard diet containing 600 g/kg ground wheat, (2B) the same diet containing 600 g/kg pre-pellet whole wheat and (3C) the same diet containing 300 g/kg ground wheat and 300 g/kg post-pellet whole wheat. Seven blends of the three apical diets were located within the triangle to complete the design and a total of 360 male Ross 308 chicks were offered the ten experimental diets from 7 to 28 d post-hatch. Model prediction and response surface plots were generated with R 3.0.3 software.
3. The most efficient FCR of 1.466 was observed in birds offered an almost equal mixture of the pre- and post-pellet whole grain apical dietary treatments, which corresponded to 172 g/kg ground grain, 256 g/kg pre-pellet whole grain, 172 g/kg post-pellet whole grain in a diet containing 600 g/kg wheat.
4. The most efficient energy utilisation (ME:GE ratio of 0.766) was observed in birds offered a blend of the ground grain and pre-pellet whole grain apical dietary treatments which corresponded to a mixture of 384 g/kg pre-pellet whole grain and 216 g/kg ground grain.
5. Pre-pellet whole grain feeding generated the most pronounced responses in increased relative gizzard contents, reduced gizzard pH and increased relative pancreas weights. Consideration is given to the likely differences between pre- and post-pellet whole grain feeding.
1. Introduction
Whole grain feeding (WGF) consists of the addition of some whole grain (replacing ground grain) in poultry diets either prior to (pre-pellet WGF), or following (post-pellet WGF), the steam-pelleting process. Hence, the rations are offered as either an intact pellet containing some whole grain or as a blend of whole grain and a balancing pelleted concentrate. The first approach is followed in New Zealand for reasons of legal compliance. However, the second approach has been commonly adopted in Australia with whole grain inclusions of 15–20% to offset feed-milling costs and enhance broiler performance. Despite this situation, there is little comparative data to indicate the relative merits of pre- versus post-pellet WGF.
WGF has the capacity to enhance feed conversion and energy utilisation and is routinely associated with heavier and presumably more functional gizzards (Singh et al. Citation2014; Liu et al. Citation2015). Gizzards respond rapidly to changes in dietary composition (Svihus Citation2011); however, relative gizzard weight responses to WGF are extremely variable with increases reported in the Singh et al. (Citation2014) review ranging from 7% to 101%. The capacity of gizzards for dietary adaptation has been reported in Japanese quail by Starck (Citation1999), where it was shown that dietary concentration of non-digestible fibre has a profound, rapid and reversible impact on gizzard size.
There are inherent experimental and practical complications with WGF. Digestibility coefficient calculations for starch and protein in post-pellet whole grain diets are problematic as the quantity of inert dietary marker consumed is confined to the pelleted concentrate and therefore the relative proportions of dietary marker to nutrient in the complete diet may not be accurate. In addition, post-pellet WGF permits ‘choice feeding’; offering the whole grain component of the ration in separate feeders to the pelleted concentrate facilitates selection by the birds according to their individual needs and this is presumed to improve feed efficiency (Robinson Citation1985). However, post-pellet WGF may encourage the undesirable practice of ‘feed-flicking’, where selected particles are thrown from the feeder resulting in feed wastage, as has been observed by Hetland et al. (Citation2002) and Fanatico et al. (Citation2013).
Nutritional geometry was used in the present study to compare ground grain with both pre-pellet and post-pellet WG additions in an ‘equilateral triangle’ response surface design comprising 10 blends as dietary treatments. The objective was to compare the performance of birds offered the 10 dietary treatments in terms of growth performance, gizzard and pancreas characteristics, nutrient utilisation and digestibility coefficients of starch and protein (N). In addition, free amino acid concentrations in plasma taken from the anterior mesenteric vein were determined in birds offered three selected dietary treatments.
2. Materials and methods
2.1. Experimental design
The equilateral triangle design is shown in . The three apical treatments of the mixture design comprised (1A) a standard diet containing 600 g/kg ground wheat or 100% Diet 1, (2B) the same diet containing 600 g/kg pre-pellet whole wheat or 100% Diet 2 and (3C) the same diet containing 300 g/kg ground wheat and 300 g/kg post-pellet whole wheat or 100% Diet 3. Diets 4D to 10J were based on blends of Diets 1, 2 and 3 and details of the blends are provided in .
Table 1. Schedule of 10 dietary treatments.
Figure 1. Diagrammatic representation of dietary treatments.
2.2. Diet preparation
The wheat used across all diets was extensively characterised (8.83% moisture, 1.91% fat, 15.05% protein, 1.86% fibre, 71.34% starch, 8.89% insoluble NSP and 0.36% soluble NSP, on a dry matter basis).Where appropriate, wheat was ground through a 3.2-mm hammer-mill screen prior to steam-pelleting in a Palmer PP330 pellet press (Palmer Milling Engineering, Griffith, NSW, Australia) with a 4.00-mm die at 80°C with a resident time in the conditioner of 14 s. Celite (CeliteTM World Minerals, Lompoc, CA, USA) was included in all diets as an inert acid insoluble ash marker in order to determine nutrient digestibility coefficients in 4 small intestinal sites. Phytase (Axtra® PHY, Danisco Animal Nutrition, Denmark) and Xylanase (Danisco Xylanase, Danisco Animal Nutrition, Denmark) were included across all diets at standard inclusion rates within the concentrate prior to pelleting. Diet composition and nutrient specifications are given in .
Table 2. Diet composition and nutrient specifications.
2.3. Bird management
This study fully complied with the guidelines approved by the Animal Ethics Committee of The University of Sydney. A total of 360 male Ross 308 chicks were offered a proprietary starter diet from hatch to 7 d of age. At 7 d post-hatch, birds were individually identified (wing-tag), weighed and allocated into bioassay cages (6 birds per cage) on the basis of body-weights. Bird allocation was such that cage means and variations were minimised. Each dietary treatment was offered to 6 replicate cages during the 7–28 d post-hatch experimental period. Birds had ad-lib access to feed and water under a ‘23-h-on-1-h-off’ lighting regime in an environmentally controlled facility. An initial room temperature of 32 ± 1°C was maintained for the first week, which was gradually decreased to 22 ± 1°C by the end of the third week and maintained at this temperature for the final week. Initial and final body weights were determined and feed intakes recorded, from which feed conversion ratios (FCR) were calculated. Any dead or culled birds were removed on a daily basis and their body-weights recorded and used to adjust FCR calculations.
2.4. Sample collection and chemical analysis
Feed intake and excreta outputs were monitored from 25 d to 27 d post-hatch in order to calculate apparent metabolisable energy (AME), metabolisable to gross energy ratio (ME:GE ratio), nitrogen (N) retention and N-corrected AME (AMEn) on a dry matter basis. Excreta were air-forced oven dried for 24 h at 80°C. The GE of diets and excreta were determined via bomb calorimetry using an adiabatic calorimeter (Parr 1281 bomb calorimeter, Parr Instruments Co., Moline, IL). AME was calculated by the following equation:
N-corrected AME values were calculated by correcting to zero N retention, using the factor of 36.54 kJ/g (Hill and Anderson Citation1958).
N retention was calculated by the following equation:
At d 28, birds were euthanised by an intravenous injection of sodium pentobarbitone and the abdominal cavity opened, where blood samples were immediately collected from the anterior mesenteric vein of three randomly selected birds per cage in treatments 1A, 2B and 10J. Concentrations of free amino acids in plasma taken from the portal circulation were determined by methodology outlined in detail by Selle et al. (Citation2016).
Following the collection of blood samples, the pH of digesta within the gizzard in situ was determined. Gizzards and pancreata were then removed and weighed to determine relative pancreas weights and relative weights of emptied gizzards and their contents. The small intestine was removed and divided into the 4 segments – proximal jejunum (PJ), distal jejunum (DJ), proximal ileum (PI) and distal ileum (DI) – which were demarcated by the end of the duodenal loop, Meckel’s diverticulum and the ileo–caecal junction and their mid-points. Digesta was collected in its entirety from each segment. Digesta samples were gently expressed from each segment, pooled by cage, homogenised, freeze dried and weighed to determine the apparent digestibility of starch and N. Concentrations of starch in diets and digesta was determined by methods as described by Mahasukhonthachat et al. (Citation2010). Nitrogen and acid insoluble ash (AIA) concentrations were determined as outlined by Siriwan et al. (Citation1993). Apparent digestibility coefficients of starch and nitrogen were calculated by the following equation:
2.5. Statistical analysis
Model prediction and response surface plots were generated with R Studio version 0.99.903 with the packages Akima (Akima et al. Citation2016) and Fields (Nychka et al. Citation2017) to analyse the experimental data. In order to generate these models, non-significant coefficients were excluded and the reduced equation recalculated for each response variable. The Akaike Information Criterion was used where more than one model was found to be significant. Response surface plots were subsequently generated. A one-way ANOVA was used to analyse data from anterior mesenteric blood samples as there were insufficient data to employ response surface methodology. Experimental units were cage means and a probability level of less than 5% was considered statistically significant.
3. Results and discussion
The overall performance of male broilers from 7 d to 28 d post-hatch in this study was highly satisfactory in comparison to 2014 Ross 308 performance objectives (values shown in parentheses) with a mean weight gain of 1456 g/bird (1387 g/bird), feed intake of 2188 g/bird (2052 g/bird) and an FCR of 1.499 (1.479), as shown in . The mortality/cull rate was only 1.1%.
Table 3. Effects of ten dietary treatments on growth performance from 7 to 28 days post-hatch and nutrient utilisation from 25 to 27 days post-hatch.
As evident in ), birds offered the ground grain apical treatment attained the greatest weight gain, as predicted from the following equation (r2 = 0.998; p < 0.001; lack of fit p = 0.850) where p is percent, and ground, pre-pellet and post-pellet represent the proportions of diet 1A, 2B and 3C, respectively:
Figure 2. Response surface plot of three basal diets (Diet 1, Ground; Diet 2, Pre-pellet; Diet 3, Post-pellet) and weight gain (a), feed intake (b) and feed conversion ratio (c) from 7 to 28 d post-hatch.
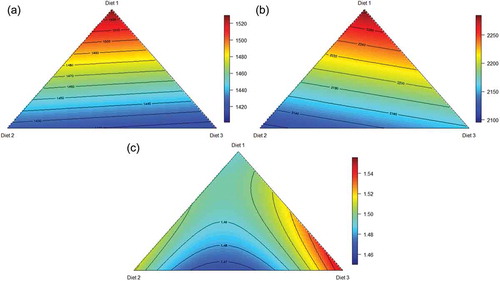
Coefficient standard errors for each model are given in . From the above model, both pre- and post-pellet WGF depressed weight gain from 1530 g/bird to 1425 g/bird and 1414 g/bird, respectively. This depression in weight gain relative to the control diet was to be expected as a review of 22 studies by Singh et al. (Citation2014) found that post-pellet WGF depressed weight gain by up to 6.78%. The depression in weight gain was allied to reductions in feed intake as illustrated in ). Birds offered the ground grain dietary treatment had the highest feed intake, predicted from the following equation (r2 = 0.997; p < 0.001; lack of fit p = 0.500), describing the relationship between feed intake and proportions of the three basal diets:
Table 4. Standard errors for each coefficient in regression models.
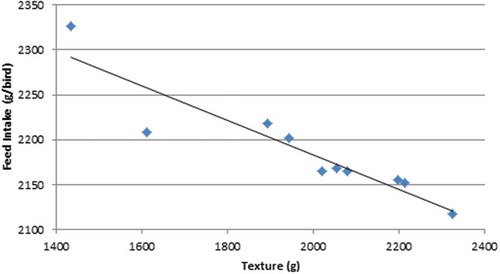
The apical ground grain diet was modelled to support a feed intake of 2284 g/bird as opposed to 2158 g/bird for post-pellet WGF and 2115 g/bird for pre-pellet WGF. Again, this is not without precedent as Singh et al. (Citation2014) found that post-pellet WGF depressed feed intake by an average of 4.05% with reductions in excess of 10% being recorded in two studies (Hetland et al. Citation2002; Ravindran et al. Citation2006). Instructively, the reduction in feed intake in the present study between ground grain and pre- and post-pellet whole grain was found to be related to measures of pellet quality. The texture of the pelleted concentrate was determined with a TVT Texture Analyzer (Perten Instruments. Macquarie Park 2113 NSW, Australia). The ground grain control diet (1A) had a texture of 1435 gf (grams-force) as opposed to an average of 2038 gf for the pelleted concentrate component of the 9 whole grain diets. Thus, the transition from a conventional diet to WGF rations generated an increase in texture or ‘hardness’ and this was associated with reductions (r = −0.913; p < 0.001) in feed intake (). In the present study, birds offered post-pellet WGF consumed more feed than their pre-pellet counterparts, which was not anticipated; however, ‘feed-flicking’ by birds offered post-pellet WGF was observed. Feed flicking is a behaviour which may be exacerbated by diets which provide an element of free choice. For example, birds were observed to perform this behaviour when offered crumbled diets which contained a range of large and small particles in Fanatico et al. (Citation2013). Feed wastage arising from this behaviour could not be quantified but it almost certainly exaggerated feed intakes of birds offered rations containing separate whole grain, which would compromise FCRs as a consequence.
Figure 3. The relationship between pellet texture (g) and 7–28 d feed intake (g/bird) (r = −0.913; p < 0.001).
As shown in ), a near equal blend of pre- and post-pellet WGF generated the most efficient feed conversion. FCR may be predicted from the following equation (r2 = 0.999; p < 0.001; lack of fit p = 0.120) presenting the relationship between FCR and proportions of the three basal diets:
Therefore, a blend of 42.7% Diet 2 and 57.3% Diet 3 generated the minimal FCR of 1.466. This blend corresponds to 172 g/kg ground grain, 256 g/kg pre-pellet whole grain and 172 g/kg post-pellet whole grain in a diet containing 600 g/kg wheat. This blend improved FCR by 1.61% (1.466 versus 1.490) relative to the apical ground grain diet. The scale of feed-flicking in post-pellet whole grain diets is evidenced by compromised feed efficiency in post-pellet treatments, where an FCR of 1.559 was observed. WGF has the capacity to enhance FCR; as reviewed by Liu et al. (Citation2015), there was an average improvement in FCR of 5.24% (range 1.81–12.90%) deduced from 11 selected studies. In these 11 studies, the average whole grain inclusion was 20.2% with a corresponding average increase in relative gizzard weights of 31.7%. Nevertheless, there were not any significant relationships between FCR improvements and either whole grain inclusion levels or increases in relative gizzard weights across these 11 studies.
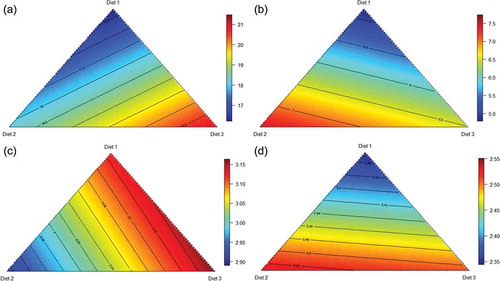
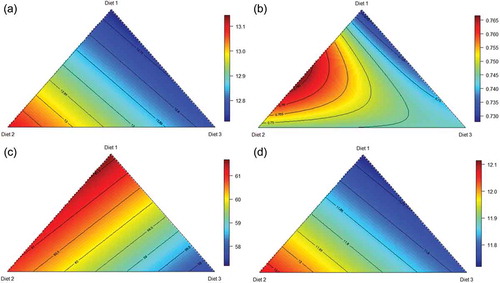
In the present study, relative gizzard weights, relative gizzard contents, gizzard pH and pancreas weights were determined (). Birds offered the apical, post-pellet dietary treatment had the highest gizzard weight, as illustrated by the following equation (r2 = 0.992; p < 0.001; lack of fit p = 0.180), which describes the relationship between gizzard weight and proportions of the three basal diets ()):
Table 5. Effects of 10 dietary treatments on relative gizzard weight, relative gizzard contents, gizzard pH and relative pancreas weights at 28 d post-hatch.
Figure 4. Response surface plots of three basal diets (Diet 1, Ground; Diet 2, Pre-pellet; Diet 3, Post-pellet) and relative gizzard weights (a), relative gizzard contents (b), gizzard pH (c) and relative pancreas weights (d) at 28 d post-hatch.
The hallmark response to WGF is heavier gizzards which are thought to be associated with increased gastro-intestinal tract motility (Svihus Citation2014; Liu et al. Citation2015). While gizzard responses to whole wheat inclusion are extremely variable; birds offered post-pellet whole grain achieved the heaviest relative gizzard weights. Conversely, other indicators of gizzard functionality were associated with pre-pellet whole grain inclusions.
The heaviest relative gizzard contents were obtained in birds offered the apical pre-pellet whole grain dietary treatment. Relative gizzard contents were predicted from the following equation (r2 = 0.953; p < 0.001; lack of fit p = 0.193), describing the relationship between gizzard contents and proportions of the three basal diets ()):
Likewise, the most acidic gizzard pH was experienced in birds offered pre-pellet whole grain dietary treatments. Relative gizzard pH may be predicted from the following equation (r2 = 0.985; p < 0.001; lack of fit p = 0.757), describing the relationship between gizzard pH and proportions of the three basal diets ()):
Thus, it appears pre-pellet whole grain treatments had the greatest influence on gastric secretions.
Additionally, the heaviest pancreas weights were observed in birds offered the apical pre-pellet whole grain treatment. Relative pancreas weight may be predicted from the following equation (r2 = 0.993; p < 0.001; lack of fit p = 0.666), describing the relationship between pancreas weight and proportions of the three basal diets ()):
Digestive enzyme secretion is enhanced by the mechanical stimulation of the chyme passing through the digestive tract (Duke Citation1986), and it is likely that the larger gizzard contents of birds offered pre-pellet whole grain stimulated pancreatic secretion.
WGF positively influenced energy utilisation as best illustrated by ME:GE ratios (). The most efficient ME:GE ratio was generated by a blend of pre-pellet whole grain and ground grain, as predicted from the following equation (r2 = 0.999; p < 0.001; lack of fit p = 0.320), describing the relationship between ME:GE ratios and proportions of the three basal diets ()):
Figure 5. Response surface plots of three basal diets (Diet 1, Ground; Diet 2, Pre-pellet; Diet 3, Post-pellet) and apparent metabolisable energy (a), metabolisable energy to gross energy ratio (b), nitrogen retention (c), and nitrogen corrected apparent metabolisable energy (d) over d 25 to 27 post-hatch.
Thus, a blend containing 36% Diet 1 and 64% Diet 2 will generate the greatest ME:GE of 0.766, which corresponds to 216 g/kg ground grain and 384 g/kg pre-pellet whole grain in a diet containing 600 g/kg wheat.
The highest AME was attained by birds offered the apical pre-pellet dietary treatment. AME may be predicted from the following equation (r2 = 0.998; p < 0.001; lack of fit p = 0.147), describing the relationship between AME and proportions of the three basal diets ()):
Likewise, the highest AMEn was attained by birds offered pre-pellet whole grain, and may be predicted from the following equation (r2 = 0.998; p < 0.001; lack of fit p = 0.177), describing the relationship between AMEn and proportions of the three basal diets ()):
In contrast, nitrogen (N) retention was greatest in birds offered solely the ground grain dietary treatment. N retention may be predicted from the following equation (r2 = 0.997; p < 0.001; lack of fit p = 0.361), describing the relationship between N retention and proportions of the three basal diets ()):
Birds offered the apical pre-pellet whole grain treatment had the highest AME and AMEn, whilst possessing relatively light gizzard weights. These improvements may be associated with the larger pancreas weights and acidic gizzard pH of birds offered the apical pre-pellet dietary treatment. The enhancement of energy utilisation parameters in birds offered pre-pellet diets devoid of substantial increases in gizzard weight is not a unique outcome. In fact, Liu et al. (Citation2015) and Truong et al. (Citation2015) proposed improvements generated by WGF may not arise solely from heavier gizzards but also may be associated with longer digesta retention times and the provision of more slowly digestible starch. It appears that heavier gizzards may not necessarily equate to more functional gizzards as has been assumed.
Protein (N) digestibility of digesta was greatest in ground grain apical treatments over the majority of the small intestine when compared to diets containing pre-pellet whole grain (). For the purpose of a more accurate prediction, only diets containing majority ground wheat or pre-pellet whole wheat are modelled, due to inherent complications with dietary markers as previously discussed. Therefore, 7 dietary treatments were analysed following the exclusion of diets 3C, 5E and 9I.
Table 6. Effects of 10 dietary treatments on protein and starch digestibility coefficients in 4 small intestinal segments at 28 d post-hatch.
Proximal jejunal protein (N) digestibility may be predicted from the following equation (r2 = 0.949; p < 0.001; lack of fit p = 0.380), describing the relationship between protein digestibility in the proximal jejunum and proportions of the three basal diets ()):
Figure 6. Response surface plot of three basal diets (Diet 1, Ground; Diet 2, Pre-pellet; Diet 3, Post-pellet) and protein digestibility across 4 small intestinal segments; proximal jejunum (a), distal jejunum (b), proximal ileum (c), distal ileum (d) at 28 d post-hatch.
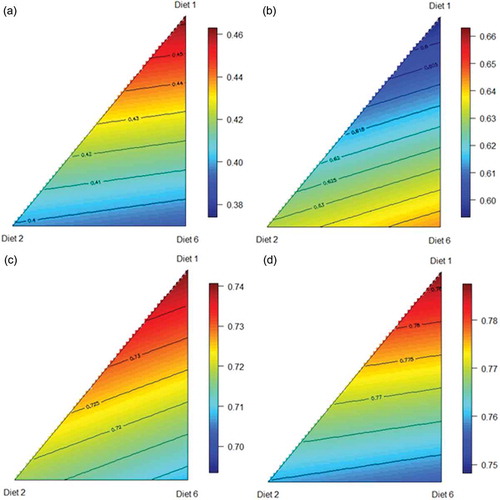
Distal jejunal protein (N) digestibility may be predicted from the following equation (r2 = 0.981; p < 0.001; lack of fit p = 0.638), describing the relationship between protein digestibility in the distal jejunum and proportions of the three basal diets ()):
Proximal ileal protein (N) digestibility may be predicted from the following equation (r2 = 0.996; p < 0.001; lack of fit p = 0.157), describing the relationship between protein digestibility in the proximal ileum and proportions of the three basal diets ()):
Distal ileal protein (N) digestibility may be predicted from the following equation (r2 = 0.997; p < 0.001; lack of fit p = 0.337), describing the relationship between protein digestibility in the distal ileum and proportions of the three basal diets ()):
Other than the distal jejunum, the predicted highest protein digestibility coefficients were associated with the conventional ground grain diet in three small intestinal segments.
The modelling of starch digestibility was similarly confined to 7 dietary treatments. Proximal jejunal starch digestibility may be predicted from the following equation (r2 = 0.971; p < 0.001; lack of fit p = 0.8249), describing the relationship between starch digestibility in the proximal jejunum and proportions of the three basal diets ()):
Figure 7. Response surface plot of three basal diets (Diet 1, Ground; Diet 2, Pre-pellet; Diet 3, Post-pellet) and starch digestibility across 4 small intestinal segments; proximal jejunum (a), distal jejunum (b), proximal ileum (c), distal ileum (d) at 28 d post-hatch.
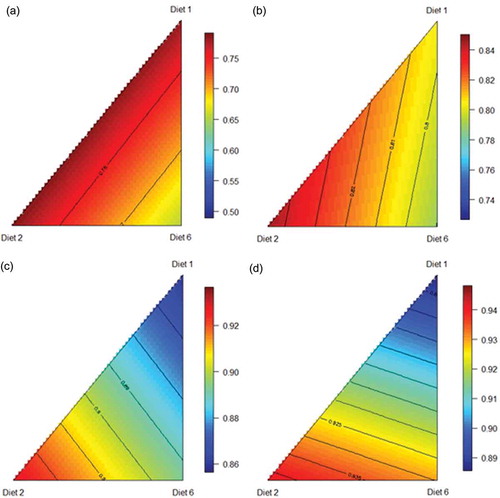
Distal jejunal starch digestibility may be predicted from the following equation (r2 = 0.989; p < 0.001; lack of fit p = 0.515), describing the relationship between starch digestibility in the distal jejunum and proportions of the three basal diets ()):
Proximal ileal starch digestibility may be predicted from the following equation (r2 = 0.994; p < 0.001; lack of fit p = 0.1257), describing the relationship between starch digestibility in the proximal ileum and proportions of the three basal diets ()):
Distal ileal starch digestibility may be predicted from the following equation (r2 = 0.997; p < 0.001; lack of fit p = 0.7812), describing the relationship between starch digestibility in the distal ileum and proportions of the three basal diets ()):
The highest predicted starch digestibility coefficients in all 4 small intestinal segments were in association with pre-pellet WGF. The gizzard has been described as the ‘pace-maker’ of gut motility in broiler chickens. It is possible that increased small intestinal refluxes in which gastro-duodenal contractions recycle digesta from the duodenum and jejunum back into the gastric area increases the exposure of digesta in the gizzard to pancreatic amylase, thereby enhancing starch digestion (Ferket Citation2000).
The effects of three dietary treatments (1A, 2B, 10J) on concentrations of 20 free amino acid levels in plasma taken from the anterior mesenteric vein or the portal circulation are shown in . Significant differences between treatments were confined to methionine and alanine where the ground grain treatment generated the highest plasma levels. Alternatively, diets containing some whole grain generated the highest proline plasma levels. Thus, there were no significant differences for the majority of amino acids. One of the benefits of slowly digestible starch is that it may promote catabolism of glucose rather than amino acids in the gut mucosa (Watford et al. Citation1979), thereby sparing amino acids and increasing their entry into the portal circulation (Weurding et al. Citation2003; Enting et al. Citation2005). While it is possible that WGF generates slowly digestible starch, there are not any indications (other than proline) that the post-enteral availability of amino acids was increased by WGF in the present study.
Table 7. Effects of three dietary treatments on concentrations (mg/mL) of free amino acid levels in plasma taken from the anterior mesenteric vein at 28 d post-hatch.
4. Implications
In the Liu et al. (Citation2015) review, the impact of post-pellet whole grain on relative gizzard weights and absolute AME responses is tabulated where, in essence, 19.0% (range: 5–50%) whole grain inclusions generated a 20.9% (range: −3% to 81%) increase in relative gizzard weights and an energy uplift of 0.51 MJ (range: −0.04 to 1.73 MJ) across 19 sets of observations. Clearly, the ranges of values in parentheses are extreme and, importantly, there are not any clear-cut relationships between whole grain inclusions with either relative gizzard weights (r = 0.114; p > 0.60) or absolute AME increases (r = 0.184; p > 0.45). However, the linear relationship between percentage increases in relative gizzard weights and absolute AME increases (r = 0.417; p < 0.08) approached significance. The inherent problem is that the increase in relative gizzard weight generated by any given whole grain inclusion level is essentially unpredictable.
Pre-pellet whole grain inclusions do not generate increases in relative gizzard weights of the magnitude observed with post-pellet whole grain inclusions. Nevertheless, Wu et al. (Citation2004) found that pre-pellet 20% whole grain generated an energy increase of 0.49 MJ without increasing gizzard weights (10.4 versus 10.0 g/kg). In comparison, post-pellet 20% whole grain increased gizzard weights (18.8 versus 10.0 g/kg) and increased AME by 0.77 MJ. That pre-pellet whole grain increased AME by 0.49 MJ in relation to an increase of 0.77 MJ from post-pellet whole grain means that the energy uplift cannot simply be attributed entirely to heavier gizzards and this prompted Wu et al. (Citation2004) to comment that ‘other factors are clearly involved (in WGF generating energy responses) and these need to be elucidated’. A remarkable outcome in the Wu et al. (Citation2004) study is that pre-pellet WGF (133 min) significantly retarded feed passage rates in comparison to both the ground grain control diet (112 min) and the post-pellet whole grain diet (119 min), which should facilitate digestion and absorption of nutrients.
One of these ‘other factors’ may be that whole grain generates more slowly digestible starch than a feed grain that has been hammer-milled and steam-pelleted, as proposed by Truong et al. (Citation2015). There are both in vitro (Giuberti et al. Citation2012) and in vivo (Liu et al. Citation2013) data in support of this suggestion. For example, Liu et al. (Citation2013) reported that a reground, steam-pelleted mash diet supported a considerably more rapid starch digestion rate constant (6.32 versus 4.11 × 10⁻²min−1) than the same diet fed as unprocessed mash in birds offered sorghum-based diets. Nevertheless, it follows that post-pellet whole grain would generate more slowly digestible starch than pre-pellet whole grain because the latter has been subject to some hydro-thermal processing. Slowly digestible starch is thought to spare amino acids from catabolism in the gut mucosa (Weurding et al. Citation2003; Enting et al. Citation2005); however, there was no real evidence of this in concentrations of free amino acids in the portal blood-stream observed in our experiment ().
The present study predicted that the most efficient energy utilisation, expressed as an ME:GE ratio of 0.766, was generated by a blend of 384 g/kg pre-pellet whole grain and 216 g/kg ground grain. Moreover, the predicted 0.766 ME:GE ratio represents a 7.2% improvement relative to the 0.715 ME:GE ratio of the ground grain apical diet. Therefore, it is noteworthy that pre-pellet whole grain additions generated the most pronounced responses in increased relative quantities of digesta in the gizzard, decreased gizzard pH and increased relative pancreas weights in the present study.
It was predicted that pre-pellet whole grain (7.46 g/kg) would generate greater relative quantities of digesta in gizzards than either post-pellet whole grain (6.51 g/kg) or ground grain (4.80 g/kg) in the present study. This outcome somewhat parallels the findings of Wu et al. (Citation2004) where pre-pellet whole grain supported slower gut passage rates than post-pellet whole grain which would appear to be consistent with greater retention of digesta in the gizzard. The reasons for this are obscure but the fundamental difference is that birds can select between the whole grain and pelleted concentrate components under a post-pellet WGF regime but with pre-pellet WGF birds are denied this choice and must consume the entire ration at any feeding episode. While it could not be quantified, birds offered post-pellet whole grain dietary treatments appeared to show a preference for the pelleted concentrate over the whole grain component in our feeding study. So, perhaps the simultaneous prehension of whole grain and the balance of the diet are leading to increased retention of digesta in the gizzard and slower gut passage rates.
The model also predicted that pre-pellet whole grain (2.91) was responsible for a more acidic pH in the gizzard than either post-pellet whole grain (3.16) or ground grain (3.13). Pepsinogen and hydrochloric acid (HCl) are secreted by parietal cells in the proventriculus where HCl activates the conversion of pepsinogen to pepsin to initiate the process of protein digestion. The more acidic gizzard pH associated with pre-pellet whole grain suggests that more HCl was secreted and, in turn, more pepsin was activated. Pepsin initiates protein digestion but, in addition, peptide end-products of pepsin digestion trigger duodenal secretions of enteric peptide hormones, including cholecystokinin, that stimulate the pancreatic secretion of digestive enzymes (Krehbiel and Matthews Citation2003). It is then relevant, therefore, that the model predicted pre-pellet whole grain (2.53 g/kg) generated heavier relative pancreas weights than either post-pellet whole grain (2.51 g/kg) or ground grain (2.34 g/kg).
Heavier relative gizzard weights induced by post-pellet WGF have been associated with more functional gizzards. However, there is the indication in this study that the contents of the gizzard, rather than gizzard weights, were more aligned with efficiency of energy utilisation. It is possible that gizzard contents provide a better indication of gizzard functionality than gizzard weights. Thus, this study suggests that pre-pellet whole grain addition may be a valuable component of WGF regimes, alongside or instead of post-pellet whole grain, with the advantage that wastage from ‘feed-flicking’ would be reduced.
Acknowledgements
The authors would like to acknowledge the support of the RIRDC Chicken-meat Committee and their encouraging guidance.
Disclosure statement
No potential conflict of interest was reported by the authors.
Additional information
Funding
References
- Akima, H., A. Gebhardt, T. Petzold, and M. Maechler. 2016. “Akima: Interpolation of Irregularly and Regularly Spaced Data.” Cran. version 0.6-2. https://CRAN.R-project.org/package=akima
- Duke, G. E. 1986. “Alimentary Canal: Secretion and Digestion, Special Digestive Functions, and Absorption.” In Avian Physiology, Eds P. D. Sturkie, 289–302. New York: Springer-Verlag.
- Enting, H., J. Pos, R. E. Weurding, and A. Veldman (2005) Starch Digestion Rate Affects Broiler Performance. Proceedings of the 16th Australian Poultry Science Symposium, Australia, pp. 17–20.
- Fanatico, A. C., V. B. Brewer, C. M. Owens-Hanning, D. J. Donoghue, and A. M. Donoghue. 2013. “Free-Choice Feeding of Free-Range Meat Chickens.” The Journal of Applied Poultry Research 22: 750–758. doi:10.3382/japr.2012-00687.
- Ferket, P. 2000. “Feeding Whole Grains to Poultry Improves Gut Health.” Feedstuffs 72: 12–16.
- Giuberti, G., A. Gallo, C. Cerioli, and F. Masoero. 2012. “In Vitro Starch Digestion and Predicted Glycemic Index of Cereal Grains Commonly Utilized in Pig Nutrition.” Animal Feed Science and Technology 174: 163–173. doi:10.1016/j.anifeedsci.2012.03.006.
- Hetland, H., B. Svihus, and V. Olaisen. 2002. “Effect of Feeding Whole Cereals on Performance, Starch Digestibility and Duodenal Particle Size Distribution in Broiler Chickens.” British Poultry Science 43: 416–423. doi:10.1080/00071660120103693.
- Hill, F. W., and D. L. Anderson. 1958. “Comparison of Metabolizable Energy and Productive Energy Determinations with Growing Chicks.” Journal of Nutrition 64: 587–603.
- Krehbiel, C. R., and J. C. Matthews. 2003. “Absorption of Amino Acids and Peptides.” In Amino Acids in Animal Nutrition. 2nd ed. edited by J. P. F. D’Mello, 41–70. Wallingford, OX: CAB International.
- Liu, S. Y., P. H. Selle, and A. J. Cowieson. 2013. “Influence of White- and Red-Sorghum Varieties and Hydrothermal Component of Steam-Pelleting on Digestibility Coefficients of Amino Acids and Kinetics of Amino Acids, Nitrogen and Starch Digestion in Diets for Broiler Chickens.” Animal Feed Science and Technology 186: 53–63. doi:10.1016/j.anifeedsci.2013.08.006.
- Liu, S. Y., H. H. Truong, and P. H. Selle. 2015. “Whole-Grain Feeding for Chicken-Meat Production: Possible Mechanisms Driving Enhanced Energy Utilisation and Feed Conversion.” Animal Production Science 55: 559–572. doi:10.1071/AN13417.
- Mahasukhonthachat, K., P. A. Sopade, and M. J. Gidley. 2010. “Kinetics of Starch Digestion and Functional Properties of Twin-Screw Extruded Sorghum.” Journal of Cereal Science 51: 392–401. doi:10.1016/j.jcs.2010.02.008.
- Nychka, D., R. Furrer, J. Paige, and S. Sain. 2017. “FIELDS: Tools for Spatial Data.” CRAN, Version 9.0. doi:10.5065/D6W957CT.
- Ravindran, V., Y. B. Wu, D. G. Thomas, and P. C. H. Morel. 2006. “Influence of Whole Wheat Feeding on the Development of Digestive Organs and Performance of Broiler Chickens.” Australian Journal of Agricultural Research 57: 16–21. doi:10.1071/AR05098.
- Robinson, D. 1985. “Performance of Laying Hens as Affected by Split Time and Split Composition Dietary Regimens Using Ground and Ungrounded Cereals.” British Poultry Science 26: 299–309. doi:10.1080/00071668508416818.
- Selle, P. H., H. H. Truong, L. R. Mcquade, A. F. Moss, and S. Y. Liu. 2016. “Reducing Agent and Exogenous Protease Additions, Individually and in Combination, to Wheat- and Sorghum-Based Diets Interactively Influence Parameters of Nutrient Utilisation and Digestive Dynamics in Broiler Chickens.” Animal Nutrition 2: 303–311. doi:10.1016/j.aninu.2016.08.001.
- Singh, Y., A. M. Amerah, and V. Ravindran. 2014. “Whole Grain Feeding: Methodologies and Effects on Performance, Digestive Tract Development and Nutrient Utilisation of Poultry.” Animal Feed Science and Technology 190: 1–18. doi:10.1016/j.anifeedsci.2014.01.010.
- Siriwan, P., W. L. Bryden, H. Mollah, and E. F. Annison. 1993. “Measurement of Endogenous Amino Acid Losses in Poultry.” British Poultry Science 34: 939–949. doi:10.1080/00071669308417654.
- Starck, J. M. 1999. “Phenotypic Flexibility in the Avian Gizzard: Rapid, Reversible and Repeated Changes in Organ Size in Response to Changes in Dietary Fibre Content.” The Journal of Experimental Biology 202: 3171–3179.
- Svihus, B. 2011. “The Gizzard: Function, Influence of Diet Structure and Effects on Nutrient Availability.” World’s Poultry Science Journal 67: 207–224. doi:10.1017/S0043933911000249.
- Svihus, B. 2014. “Starch Digestion Capacity of Poultry.” Poultry Science Journal 93: 2394–2399. doi:10.3382/ps.2014-03905.
- Truong, H. H., S. Y. Liu, and P. H. Selle. 2015. “Starch Utilisation in Chicken-Meat Production: The Foremost Influential Factors.” Animal Production Science 56: 797–814. doi:10.1071/AN15056.
- Watford, M., P. Lund, and H. A. Krebs. 1979. “Isolation and Metabolic Characteristics of Rat and Chicken Enterocytes.” Biochemical Journal 178: 589–596. doi:10.1042/bj1780589.
- Weurding, R. E., H. Enting, and M. W. A. Verstegen. 2003. “The Relation between Starch Digestion Rate and Amino Acid Level for Broiler Chickens.” Poultry Science 82: 279–284. doi:10.1093/ps/82.2.279.
- Wu, Y. B., V. Ravindran, D. G. Thomas, M. J. Birtles, and W. H. Hendriks. 2004. “Influence of Phytase and Xylanase, Individually or in Combination, on Performance, Apparent Metabolisable Energy, Digestive Tract Measurements and Gut Morphology in Broilers Fed Wheat-Based Diets Containing Adequate Level of Phosphorus.” British Poultry Science 45: 76–84. doi:10.1080/00071660410001668897.