
 ?Mathematical formulae have been encoded as MathML and are displayed in this HTML version using MathJax in order to improve their display. Uncheck the box to turn MathJax off. This feature requires Javascript. Click on a formula to zoom.
ABSTRACT
1. Sex-specific variations in early embryonic development rates may pre-empt later variations in embryonic development through to pipping and hatching. Given that erythropoiesis (blood production) can be equated with early embryonic growth rate, it was hypothesised that blood pigment haemoglobin can act as a specific spectral fingerprint for changes in growth rate. Moreover, by measuring longitudinal, rather than lateral, spectral transmission through the egg, a more consistent spectrum with a higher signal-to-noise ratio could be captured.
2. Longitudinal visible transmission (T575/T598 ratio), which is sensitive to haemoglobin, was used to monitor sex-specific early embryonic development rate in white layer chicken eggs from d 0 to 8 of incubation. The sex of these eggs was subsequently confirmed two days after hatching.
3. Embryonic development was detectable from d 3 (72 h) of incubation, 36 h earlier than previously reported lateral spectral measurements, supporting the greater sensitivity of longitudinal measurements.
4. At d 3, the mean T575/T598 ratio for male embryos was significantly lower (P < 0.001) (i.e. higher absorbance of haemoglobin) than for female embryos, which was thought to be due to sex-differences in early embryogenesis. On the other hand, female embryos had a significantly lower (P < 0.05) mean T575/T598 ratio than male embryos at d 7 of incubation, presumably due to the combined effects of oestrogen synthesis receptors and enzymes on erythropoiesis in female embryos at this time.
5. In conclusion, the proposed methodology has the sensitivity to differentiate sex-specific embryonic development rates during early incubation and the potentiality to advance precision incubation management and poultry research.
Introduction
Monitoring early embryonic development has many potential applications, both for research and incubation management. From a research point of view, it is of interest to evaluate variations in early embryonic development rates, which may be correlated with variations in late embryonic development right through to pipping and hatching (Muambi et al. Citation1980).
Nowadays, several non-destructive techniques are available to monitor early embryonic growth during incubation, including acoustic resonance analysis and lateral visible light transmission (T575/T610). However, acoustic resonance analysis requires numerous consecutive measurements, making the technique laborious and time-consuming (Kemps et al. Citation2009), while lateral visible light transmission technology cannot detect embryonic development earlier than 108 h into incubation (Bamelis et al. Citation2002). Moreover, lateral light transmission can be influenced by changes in yolk shape and position during incubation. This is because, soon after incubation begins, the yolk moves from the centre to the upper right pole beneath the eggshell to facilitate embryonic respiration through blood vessels of the yolk sac membrane (Meuer and Egbers Citation1990). On the other hand, measuring light transmission along the main longitudinal axis of table eggs has been reported to provide more uniform spectra, with a higher signal to noise ratio than lateral spectral transmission measurements (Mehdizadeh et al. Citation2014). These observations led to the hypothesis that longitudinal visible light transmission measurements could provide earlier, more sensitive, and non-destructive measurements of embryonic growth rate, which may be correlated with variations in late embryonic development right through to pipping and hatching.
More importantly, when researchers have non-destructively examined early embryonic growth rate, they have not taken into consideration the potential of sex-related growth rate differences. Being able to monitor sex-specific early embryonic growth rate in a non-destructive way could potentially reveal useful information that provides linkages between pre- and early incubation egg characteristics and post-hatch chick performance (Kemps et al. Citation2009). Moreover, embryonic growth is influenced by both endogenous and exogenous factors (Bahr et al. Citation2013). Hence, non-destructively monitoring sex-specific early embryonic growth rates during incubation may reveal useful information related to the influence of exogenous (e.g. temperature) and endogenous factors (e.g. hormones) on sex-specific embryonic development rates (Nakabayashi et al. Citation1998; Aslam et al. Citation2013).
While direct measurement of embryonic growth rate is problematic, the production of blood is known to take place from d 2 of incubation in a fertile egg (Evans and Romanoff Citation2006). Moreover, red blood cell mass is tightly correlated with embryonic growth for the entire incubation period (Barnes and Jensen Citation1959). This could provide an indirect indicator of embryonic growth rate, given that haemoglobin, the detectable pigment in blood, has three absorption bands at 415, 539, and 575 nm when visible light is transmitted through an egg containing blood. However, for brown coloured eggshells containing protoporphyrin, there is a confounding factor of three absorption bands at 539, 589 and 643 nm (Brant et al. Citation1953), while the eggshell itself absorbs most of the light below 500 nm. This, together with variability in egg characteristics such as shell thickness and yolk colour, has led researchers to combine reference wavelengths to minimise interference (e.g. at 598 and 610 nm) with transmittance measurements at 575 nm to detect blood in both white and brown eggs (Gielen et al. Citation1979).
It was hypothesised that using the ratio of two wavelengths (T575/T598) from the longitudinal visible light transmission spectrum would enable specific detection of blood production in fertile eggs, providing a non-destructive, sensitive, consistent, and indirect metric that could discriminate sex-specific embryonic growth rates during early embryonic development. Therefore, this study was undertaken to monitor sex-specific, early embryonic growth rates in white layer chicken eggs from d 0 to 8 of incubation.
Materials and methods
This study was carried out in strict compliance with the regulations pertaining to animal experiments at Kyoto University (Guide for the Care and Use of Laboratory Animals). The regulations were approved by the Kyoto University Animal Experimentation Committee (Permit Number: 29–59). The study did not involve endangered or protected species. All efforts were made to minimise animal suffering. Eggs were incubated at a comfortable temperature and humidity, and chicks were humanely killed (i.e. carbon dioxide gassing).
Spectral acquisition system
The transmission spectra of eggs were measured, one at a time, in a lightproof box using a Mercury-Xenon lamp (Lightningcure LC8 (L8253), Hamamatsu Photonics, K. K., Japan) as a light source and a photonic multichannel analyser (PMA-12, model C10027-01, Hamamatsu Photonics K. K., Japan) as the detector as shown in .
Figure 1. Schematic (a) and pictorial (b) diagrams of the spectral acquisition system.
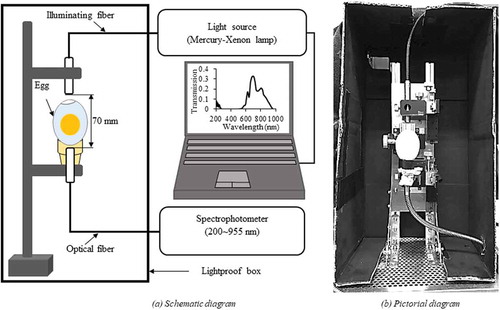
The light was focused on the blunt end of the egg surface by using an illuminating fibre 5 mm in diameter and the light transmitted through the egg (Xraw) was transported to the detector by an optical fibre with a 1 mm effective receiving diameter. An integration time of 50 ms was used to obtain an adequate signal at the detector. The spectrophotometer was calibrated (Xref) using a 40 mm thick pure Teflon block (PTFE push rod Ø45 mm, Chukoh Chemical Industries, Ltd., Japan) (Aboonajmi and Najafabadi Citation2014). Moreover, a correction was made for electrical noise (Xnoise) by measuring the spectrum without light exposure to the spectrophotometer. All spectral measurements were done inside a lightproof box to shield any stray light from reaching the spectrophotometer. An average of 10 spectra was taken at each measurement time point to reduce the noise of the received signal. Therefore, the total transmission spectrum measurement time required for a single egg was 0.5 s. The transmission spectrum of each egg (Xi) was measured over the spectral range of 200–955 nm with a wavelength resolution of less than 2 nm. The software package PMA-12 Spectral Analyzer for Windows (PMA Software U10472-01, Hamamatsu Photonics K.K., Japan) was used to control the spectral acquisition process. The distance between the illuminating and the optical fibre was kept at 70 mm to obtain a consistent transmission spectrum throughout the spectral transmission measurement during incubation. The raw transmission spectra of the eggs (Xraw) were transformed into relative transmission (X) values at all wavelengths i using the following equation:
To minimise the exposure time of each incubation tray (containing 30 eggs) outside the incubator (15 (±2) min), eggs were immediately placed back into the incubator after the spectral transmission measurements. Moreover, during spectral transmission measurement, the temperature of the eggs was carefully maintained by using a warm electric blanket set to 37 (±0.5)ºC to avoid the influence of ambient temperature on the growth of the embryo. The transmission was measured once in a day from the beginning of incubation (i.e. d 0) to d 8 of incubation. To correct the transmission spectra for egg characteristics (e.g. eggshell thickness and yolk colour) all intensities in the spectra were divided by the intensity at the reference wavelength of 598 nm (Gielen et al. Citation1979). For these ‘corrected spectra’, the ordinate became a ratio scale. Finally, the ratio of T575/T598 was used to monitor the sex-specific embryonic development rates based on the production of haemoglobin pigment in the red blood cells.
Experimental design
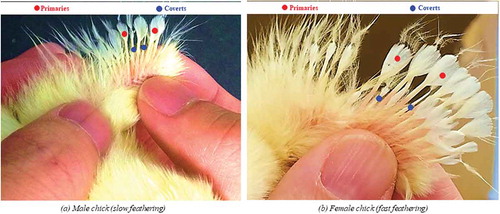
In total, 232 freshly laid, white shell, clean, unwashed and fertile eggs from 241 d old Lohman LSL-Lite (known in Japan as Julia-Lite) layer chickens were collected from a commercial poultry hatchery (Japan Layer k. k., Gifu, Japan). Firstly, eggs were uniquely numbered at the equator with an HB pencil, followed by measurement of physical parameters, such as initial egg weight, long diameter and short diameter. Upon completion of the measurements, the eggs were immediately stored at 15 (±0.5)ºC and 80 (±5)% relative humidity (RH) following standard poultry hatchery practice to prevent embryonic development prior to incubation. For incubation, the eggs were preheated for 16 h (first 6 h at 28ºC and the remaining 10 h at 30ºC) followed by incubation and hatching, as reported by Islam et al. (Citation2015). Two eggs were randomly selected, and each sacrificed for microscopic (KEYENCE VHX-500F Digital Microscope, KEYENCE CORPORATION, USA) observation of embryonic development at d 1 and 2.5, respectively. The infertile eggs were identified by visual candling at the beginning of d 4 of incubation, followed by confirmation by visual observation after breaking the eggs at d 9 of incubation. Of the remaining 230 eggs, 206 eggs were successfully hatched, while 14 eggs were infertile. Besides, there were four early deaths (during the first third of incubation) and six late deaths (before piping). At hatch, uniquely numbered plastic leg bands were fitted to each chick’s leg, and they were placed in standard brood units set to 35ºC and 60 (±5)% RH (Mickelberry et al. Citation1966). The average post-hatch eggshell thickness (APHEST) was calculated from the measured shell thickness at three positions (i.e. blunt end, pointed end, and equator) to evaluate the influence of eggshell thickness on results obtained based on the T575/T598 ratio. A digital weighing machine (Shinko Denshi Co., Ltd.) with 0.01 g accuracy, Mitutoyo digital Vernier caliper and Mitutoyo digital micrometer were used for weighing and measuring the egg dimensions (length and width) and post-hatch eggshell thickness, respectively. The female chicks have faster feathering (the primary wing feathers are longer than the covert feathers), while male chicks are slow to feather (primary and covert feathers are the same length). In a small percentage of male chicks, covert feathers may be longer than the primary feathers (deemed as super slow feathering). Thus, the sex of the hatched chicks (n = 206) was identified by feather sexing at two days of age (Schroeder Citation1933) as shown in . In total, there were 97 males and 109 female chicks, respectively.
Figure 2. Feather sexing of male (a) and female (b) chicks.
Statistical analysis
Welch’s unequal variances t-test is a reliable method to assess whether the means of two classes having unequal sample sizes are statistically different from each other (Ruxton Citation2006). Therefore, the difference in the means between different groups and between within groups of eggs was examined with Welch’s unequal variances t-test with a P-value of 0.05 indicating significance (Gaetano Citation2018).
Results
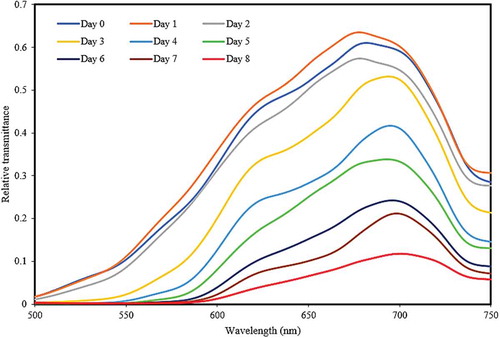
During the experimental period, the highest transmission rates (visible region) were observed at d 0 between 500 to 750 nm, being particularly strong at 670 nm. Thereafter, transmission rates decreased to their lowest at d 8, where there was only observable transmittance between 600–750 nm. The mean transmission spectra of eggs in the visible region from d 0 to 8 of incubation are shown in . There were very small decreases at 539, 589 and 643 nm due to the presence of small amounts of protoporphyrin in the white shell eggs.
Figure 3. Mean transmission spectra of eggs at different incubation time in the visible region.
Microscopic observation of embryo
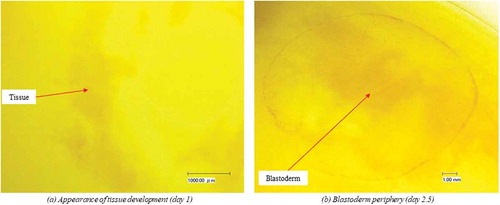
Using microscopic examination, embryonic tissue development was observed on d 1, as shown in . There were clearly visible blastoderm periphery and blood vessels at d 2.5 (i.e., after 60 h) of incubation, as shown in .
Figure 4. Microscopic view of embryo at day 1 (a) and day 2.5 (b).
T575/T598 ratio of fertile and infertile eggs
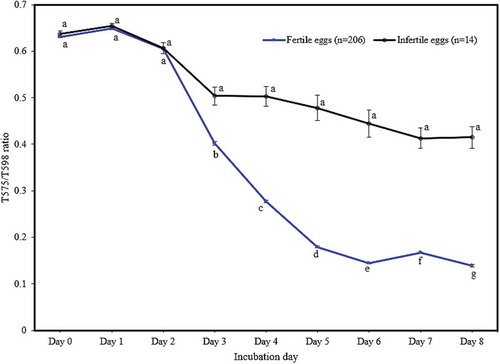
From the corrected spectra of eggs, the T575/T598 ratio (transmission intensity at 575 nm divided by that at 598 nm) was extracted and used to exclude effects of light absorption from any other egg components other than haemoglobin. The T575/T598 ratio of fertile versus infertile eggs started to diverge from d 3 and that development of the blastoderm and blood vessels in fertile eggs proceeded this divergence. There were significant differences (P < 0.001) with the infertile eggs up to d 8 of incubation, as shown in . While, in infertile eggs, the decrease of T575/T598 ratio was not significant (P > 0.01) over the same period, as shown in .
Figure 5. The change in the T575/T598 ratio during early incubation (points represent means, error bars represent standard error of means). Significantly different means within each group are indicated with a different letter (p < 0.01).
T575/T598 ratio of male and female eggs
Changes in T575/T598 ratio for male and female embryos from d 0 to 8 of incubation are shown in .
Figure 6. The change in the T575/T598 ratio for male and female eggs during early incubation (points represent means, error bars represent standard error of means). Single asterisk (*) indicates (p < 0.05) and Triple asterisks (***) indicate (p < 0.001).
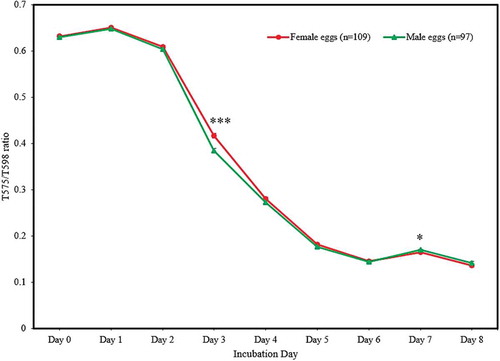
The male eggs had a significantly smaller (P < 0.001) T575/T598 ratio (i.e. higher absorbance of haemoglobin) compared to female eggs at d 3 of incubation, as shown in . However, there were no significant sex-differences (P < 0.05) in T575/T598 ratio from d 4 to 6 of incubation.
By d 7 of incubation, the mean value of T575/T598 ratio for female eggs was significantly smaller (P < 0.05) (i.e. higher absorbance of haemoglobin) than male eggs, as shown in .
Welch’s unequal variances t-test confirmed that there was no undue influence of initial egg weight, length, width or post-hatch eggshell thickness on the mean T575/T598 ratio between the male and female egg groups, as shown in .
Table 1. Characteristics of hatched egg samples.
There were no significant differences (P > 0.05) in mean weight, length, width and APHEST between male and female eggs, which implied that the significant sex-differences observed in T575/T598 ratio at d 3 (P < 0.001) and d 7 (P < 0.05) were not influenced by these egg characteristics.
Discussion
The intensity of the transmission spectra decreased as incubation progressed. The most significant decreases in spectral transmission were in the 570–590 nm, 620–630 nm, and 640–650 nm regions, which was consistent with the reported findings of Islam et al. (Citation2015). Due to increasing embryonic blood production, the decrease in spectral transmission (570–580 nm) from incubation d 2 onwards was thought to be due to the build-up and absorption of light by haemoglobin in the embryonic red blood cells (Md et al. Citation2017). It was observed under the microscope that the primary blood system of the yolk sac membrane and the area vasculosa were evident by d 2–3 of incubation. This is the period when the vitelline arteries that carry blood from the embryo heart to the periphery of the blastoderm become clearly visible (Baggott Citation2009). Another important physiological change occurring at this time was the appearance of sub-embryonic fluid (SEF) in the yolk sac beneath the embryo (New Citation1956), which increases rapidly to occupy the upper portion of the yolk sac, destroying the internal structure of the yolk (Schlesinger Citation1958). This was probably why no significant decreases in T575/T598 ratio (P > 0.01) were observed in fertile eggs until d 2 of incubation, as shown in . The very high absorption of visible light by the non-transparent yolk (Williams and Norris Citation1987) masked any changes in haemoglobin content. As soon as the formation of the new compartment of transparent SEF begins at the top of the yolk beneath the embryo from day 2 (New Citation1956), the yolk becomes translucent and more light can traverse the yolk sac. This would explain why the significant (P < 0.001) decrease in T575/T598 ratio was only observed in fertile eggs from d 3 of incubation. Thus, embryonic development was first detected at d 3 (72 h) of incubation, 36 h earlier than previously reported lateral spectral measurement (Bamelis et al. Citation2002), supporting greater sensitivity for longitudinal spectral measurements.
Two major trends were observed over time for changes in the T575/T598 ratio, which were consistent with the development of the haematocrit (the ratio of the volume of red blood cells to the total volume of blood) during erythropoiesis reported by Johnston (Citation1955), which mimics increases in haemoglobin in embryonic erythrocytes (Campbell et al. Citation1971). First, a linear decrease in T575/T598 ratio (i.e. an increase in haemoglobin content of embryonic blood) was observed until d 5, followed by a plateau between d 5 and 6, corresponding to the transition from the proliferative to the non-proliferative phase of primitive erythrocytes. This plateau can be seen in the changes over time in T575/T598 ratio observed, corresponding to the lower haemoglobin synthesis rate during the non-proliferative than the proliferative phase (Campbell et al. Citation1971).
Secondly, at d 7, there was a small but significant rise (P < 0.001) in the T575/T598 ratio, details of which will be discussed later. While the small observed decrease in the T575/T598 ratio in infertile eggs during incubation were co-incidental with known physico-chemical processes (such as Maillard reaction, decrease of Haugh unit and increase of pH), which can result in the production of brown melanoidins (Burley Citation1989) that absorb light in the visible part of the spectra (Bamelis et al. Citation2005).
At d 3 of incubation, the significantly lower (P < 0.001) T575/T598 ratio in males could be associated with the sex-dependent variations in viability and vigour of the embryo at that time (Hamburger and Hamilton Citation1992). Moreover, sex-specific development has been reported to occur from the onset of embryogenesis in domestic chickens with males developing faster than females during the first phase of incubation (∼30 h) due to over-expression of cell-proliferation genes in males (Tagirov and Golovan Citation2015). This is in agreement with Galli et al. (Citation2017), who observed significantly higher haemoglobin fluorescence in male embryos at d 3.5, who used an in ovo fluorescence spectroscopic measurement of main vitelline vessels through an eggshell window.
While the lack of significant sex-differences (P > 0.05) in the T575/T598 ratio from d 4 to 6 may have resulted from known increases in oestrogen synthesis receptors and enzyme production and its subsequent promotion of erythropoiesis in females during this period, the differences between male and female haemoglobin levels were being reduced. Oestrogen receptors transcripts have been detected in the gonads of both male and female chick embryos at d 4.5, 5.5 and 6.5, and in female, but not male, urogenital tissues at d 3.5. Moreover, it has been noted that the capacity to synthesise oestrogen is specific to females (Nakabayashi et al. Citation1998; Smith et al. Citation1997). It should be noted that the effects of oestrogen on erythropoiesis in chickens have not been reported. However, research on mice has shown that increases in oestrogen promoted blood-forming stem cell proliferation and erythropoiesis in females (Nakada et al. Citation2014). From these considerations, it can be suggested that increased oestrogen synthesis receptors and enzyme production in females during this period may have promoted blood production.
At d 7, there was a sudden rise in T575/T598 ratio for both male and female eggs. This can be explained by the rapid decrease in SEF after d 6 of incubation (Deeming Citation1989). This explanation is consistent with Bamelis et al. (Citation2002), who reported the importance of SEF development for detection of the change in the transmission ratio to detect blood in fertile eggs. Moreover, the rise in T575/T598 ratio was significantly less (P < 0.05) in female eggs. This result was consistent with the above explanation regarding increased blood production due to oestrogen synthesis receptors and enzyme production in females, which would result in higher blood levels and lower T575/T598 ratio. This findings agreed with what Galli et al. (Citation2017) reported, i.e. a steady-state increase in haemoglobin fluorescence in female embryos from d 4.5 to day 7.5. However, the reduction of T575/T598 ratio at d 8 is not understood and need further research. The current results showed that the T575/T598 ratio differed in a sex-specific way in chicken eggs during early embryonic development (i.e. at d 3 and 7), even when the male and female eggs were of a similar (P > 0.05) weight, length, width and eggshell thickness. Therefore, this non-destructive monitoring of sex-specific early embryonic growth rate using longitudinal visible light transmission has the potential to evaluate sex-specific variation in the early embryonic development rate, which may have carry-over effects on the variation in late embryonic development, as well as time and duration of pipping and hatching.
Conclusions
The non-destructive longitudinal visible transmission technique developed in this experiment can detect embryonic development by d 3 of incubation, giving a significant improvement over lateral visible transmission measurement. In addition, at d 3 of incubation, male eggs had a significantly lower (P < 0.001) T575/T598 ratio (i.e. higher absorbance of haemoglobin) than female eggs, indicative of faster erythropoiesis (i.e. faster development) in male embryos in the first phases of incubation (∼30 h). By d 7 the result was reversed, whereby female eggs had a significantly lower (P < 0.05) T575/T598 ratio (i.e., higher absorbance of haemoglobin) than male eggs, presumably due to the combined effects of oestrogen receptors and enzymes necessary for oestrogen synthesis on erythropoiesis (i.e., blood production) in females. This new methodology has the sensitivity to differentiate sex-specific embryonic development rates during early incubation, and thus the potential to contribute to the expansion of precision incubation management and avian research.
Acknowledgments
The authors express their gratitude to Ministry of Education, Culture, Sports, Science and Technology (MEXT) Scholarship Council and Kyoto University, Japan for providing financial support and to Mr. Kunihiko Nambu, Chairman, and CEO (NABEL Co., Ltd., Japan) for giving his kind consent for this collaborative research. The authors are deeply indebted to Associate Professor Garry John Piller (Graduate School of Agriculture, Kyoto University, Japan) for critically editing and proofreading this manuscript.
Disclosure statement
No potential conflict of interest was reported by the authors.
Related Research Data
References
- Aboonajmi, M., and T. A. Najafabadi. 2014. “Prediction of Poultry Egg Freshness Using Vis-Nir Spectroscopy with Maximum Likelihood Method.” International Journal of Food Properties 17 (10): 2166–2176. doi:10.1080/10942912.2013.784330.
- Aslam, M. A., M. Hulst, R. A. H. Hoving-Bolink, M. A. Smits, B. de Vries, I. Weites, T. G. G. Groothuis, and H. Woelders. 2013. “Yolk Concentrations of Hormones and Glucose and Egg Weight and Egg Dimensions in Unincubated Chicken Eggs, in Relation to Egg Sex and Hen Body Weight.” General and Comparative Endocrinology 187: 15–22. doi:10.1016/j.ygcen.2013.02.045.
- Baggott, G. K. 2009. “Development of Extra-Embryonic Membranes and Fluid Compartments.” Avian Biology Research 2 (1–2): 21–26. doi:10.3184/175815509x430381.
- Bahr, C., R. Verhelst, Q. Tong, V. Exadaktylos, I. M. McGonnell, H. Bergoug, T. Demmers, et al. 2013. “Embryonic Development and the Physiological Factors that Coordinate Hatching in Domestic Chickens.” Poultry Science 92 (3): 620–628. doi:10.3382/ps.2012-02509.
- Bamelis, F. R., B. J. Kemps, K. Mertens, E. M. Verhoelst, B. De Ketelaere, E. M. Decuypere, and J. G. De Baerdemaeker. 2005. “VIS-NIR Transmission for the Assessment of Internal Egg Quality.” In XI Th European Symposium on the Quality of Eggs and Egg Products. Doorwerth, The Netherlands. https://www.cabi.org/Uploads/animal-science/worlds-poultry-science-association/WPSA-the-netherlands-2005/171.pdf
- Bamelis, F. R., K. Tona, J. G. De Baerdemaeker, and E. M. Decuypere. 2002. “Detection of Early Embryonic Development in Chicken Eggs Using Visible Light Transmission.” British Poultry Science 43 (2): 204–212. doi:10.1080/00071660120121409.
- Barnes, A. E., and W. N. Jensen. 1959. “Blood Volume and Red Cell Concentration in the Normal Chick Embryo.” American Journal of Physiology-Legacy Content 197 (2): 403–405. doi:10.1152/ajplegacy.1959.197.2.403.
- Brant, A. W., K. H. Norris, and G. Chin. 1953. “A Spectrophotometric Method for Detecting Blood in White-Shell Eggs.” Poultry Science 32 (2): 357–363. doi:10.3382/ps.0320357.
- Burley, R. W. 1989. “The Albumen : Chemistry.” In The Avian Egg : Chemistry and Biology, 65–128. New York: Wiley. https://ci.nii.ac.jp/naid/10027530847/
- Campbell, G. L. M., H. Weintraub, B. H. Mayall, and H. Holtzer. 1971. “Primitive Erythropoiesis in Early Chick Embryogenesis. II. Correlation between Hemoglobin Synthesis and the Mitotic History.” The Journal of Cell Biology 50 (3): 669–681. doi:10.1083/jcb.50.3.669.
- Deeming, D. C. 1989. “Importance of Sub‐embryonic Fluid and Albumen in the Embryo’s Response to Turning of the Egg during Incubation.” British Poultry Science 30 (3): 591–606. doi:10.1080/00071668908417182.
- Evans, H. E., and A. L. Romanoff. 2006. “The Avian Embryo: Structural and Functional Development.” Avian Diseases 4 (4): 541. doi:10.2307/1587707.
- Gaetano, J. 2018. “Welch’s t-Test for Comparing Two Groups: An Excel Calculator (1.0).” Microsoft Excel Workbook. doi:10.13140/RG.2.2.24158.28484.
- Galli, R., G. Preusse, O. Uckermann, T. Bartels, M. E. Krautwald-Junghanns, E. Koch, and G. Steiner. 2017. “In Ovo Sexing of Chicken Eggs by Fluorescence Spectroscopy.” Analytical and Bioanalytical Chemistry 409 (5): 1185–1194. doi:10.1007/s00216-016-0116-6.
- Gielen, R. M. A. M., L. P. De Jong, and H. M. M. Kerkvliet. 1979. “Electrooptical Blood-Spot Detection in Intact Eggs.” IEEE Transactions on Instrumentation and Measurement 28 (3): 177–183. doi:10.1109/TIM.1979.4314801.
- Hamburger, V., and H. L. Hamilton. 1992. “A Series of Normal Stages in the Development of the Chick Embryo.” Developmental Dynamics 195 (4): 231–272. doi:10.1002/aja.1001950404.
- Islam, M. H., N. Kondo, Y. Ogawa, T. Fujiura, T. Suzuki, S. Nakajima, and S. Fujitani. 2015. “Prediction of Chick Hatching Time Using Visible Transmission Spectroscopy Combined with Partial Least Squares Regression.” Engineering in Agriculture, Environment and Food 8 (1): 61–66. doi:10.1016/j.eaef.2014.10.001.
- Johnston, P. M. 1955. “Hematocrit Values for the Chick Embryo at Various Ages.” American Journal of Physiology-Legacy Content 180 (2): 361–362. doi:10.1152/ajplegacy.1955.180.2.361.
- Kemps, B. J., F. R. Bamelis, K. Mertens, E. M. Decuypere, J. G. De Baerdemaeker, and B. De Ketelaere. 2009. “Assessment of Embryonic Growth in Chicken Eggs by Means of Visible Transmission Spectroscopy.” Biotechnology Progress 26 (2): 512–516. doi:10.1002/btpr.321.
- Md, I., N. K. Hamidul, Y. Ogawa, T. Fujiura, T. Suzuki, and S. Fujitani. 2017. “Detection of Infertile Eggs Using Visible Transmission Spectroscopy Combined with Multivariate Analysis.” Engineering in Agriculture, Environment and Food 10 (2): 115–120. doi:10.1016/j.eaef.2016.12.002.
- Mehdizadeh, A., S. M. Saman, N. H. Hancock, and M. A. K. Torshizi. 2014. “An Intelligent System for Egg Quality Classification Based on Visible-Infrared Transmittance Spectroscopy.” Information Processing in Agriculture 1 (2): 105–114. doi:10.1016/j.inpa.2014.10.002.
- Meuer, H. ‐. J., and C. Egbers. 1990. “Changes in Density and Viscosity of Chicken Egg Albumen and Yolk during Incubation.” Journal of Experimental Zoology 255 (1): 16–21. doi:10.1002/jez.1402550104.
- Mickelberry, W. C., J. C. Rogler, and W. J. Stadelman. 1966. “The Influence of Dietary Fat and Environmental Temperature upon Chick Growth and Carcass Composition.” Poultry Science 45 (2): 313–321. doi:10.3382/ps.0450313.
- Muambi, S., E. Decuypere, and H. Michels. 1980. “Influence De La Durée De Conservation Des Oeufs Sur La Durée D’incubation, Le Taux D’éclosion Et La Croissance Postnatale Chez La Race De Volaille ‘rhode Island Red’.” Rev. Zairoise Sci. Nucl 1 (2): 65–83.
- Nakabayashi, O., H. Kikuchi, T. Kikuchi, and S. Mizuno. 1998. “Differential Expression of Genes for Aromatase and Oestrogen Receptor during the Gonadal Development in Chicken Embryos.” Journal of Molecular Endocrinology 20 (2): 193–202. doi:10.1677/jme.0.0200193.
- Nakada, D., H. Oguro, B. P. Levi, N. Ryan, A. Kitano, Y. Saitoh, M. Takeichi, G. R. Wendt, and S. J. Morrison. 2014. “Oestrogen Increases Haematopoletic Stem-cell Self-renewal in Female and during Pregnancy.” Nature 505 (7484): 555–558. doi:10.1038/nature12932.
- New, D. A. T. 1956. “The Formation of Sub-Blastodermic Fluid in Hen’s Eggs.” Journal of Embryology and Experimental Morphology 4 (September): 221–227. http://dev.biologists.org/content/4/3/221.short
- Ruxton, G. D. 2006. “The Unequal Variance T-Test Is an Underused Alternative to Student’s t-Test and the Mann–Whitney U Test.” Behavioral Ecology 17 (4): 688–690. doi:10.1093/beheco/ark016.
- Schlesinger, A. B. 1958. “The Structural Significance of the Avian Yolk in Embryogenesis.” Journal of Experimental Zoology 138 (2): 223–258. doi:10.1002/jez.1401380204.
- Schroeder, C. H. 1933. “How to Tell the Baby Chick’s Sex.” Everybody’s Poultry Journal 289: 293–297.
- Smith, C. A., J. E. Andrews, and A. H. Sinclair. 1997. “Gonadal Sex Differentiation in Chicken Embryos: Expression of Oestrogen Receptor and Aromatase Genes.” The Journal of Steroid Biochemistry and Molecular Biology 60 (5–6): 295–302. doi:10.1016/S0960-0760(96)00196-3.
- Tagirov, M., and S. Golovan. 2015. “Sexual Dimorphism in the Early Embryogenesis of the Chicken (Gallus Gallus Domesticus).” Molecular Reproduction and Development 82 (5): 332–343. doi:10.1002/mrd.22476.
- Williams, P., and K. Norris. 1987. “Near-Infrared Technology in the Agricultural and Food Industries. Near-Infrared Technology in the Agricultural and Food Industries.” American Association of Cereal Chemists, Inc. https://www.cabdirect.org/cabdirect/abstract/19892442443