
ABSTRACT
1.The objective of the experiment was to analyse serum profiles of goslings with visceral gout and compare them with those of healthy individuals to identify differentially-abundant metabolites as potential biomarkers.
2.Untargeted gas chromatography and time-of-flight mass spectrometry (GC-TOF-MS) metabolomic profiling was used to compare the serum metabolome of 15 goslings (Anser cygnoides) with gout and 15 healthy goslings (control).
3.Goslings with gout had a metabolic profile distinct from that of the controls, with 45 metabolite levels differing significantly (VIP > 1; P < 0.05) between both groups. Nine metabolites (hydrocortisone, glucose, trans-4-hydroxy-L-proline, galactose, 2-deoxy-D-galactose, beta-mannosylglycerate, d-glucoheptose, zymosterol, and hypoxanthine) were selected through receiver operating characteristics (ROC) analysis (area under curve (AUC) score ≥0.85) as potential biomarkers. Pathway analysis revealed that metabolites with differing levels were mainly involved in galactose, arginine and proline and purine metabolisms.
4.These results provided new insights into the pathogenesis of gout. Increased xanthine and hypoxanthine with decreased hydrocortisone provide promising biomarkers for gosling gout diagnosis. The findings suggested that hepatic metabolic disorders frequently occur in the development of avian gout.
Introduction
Visceral gout is a common metabolic disorder involving purines, which causes abnormal urate accumulation in domestic birds (Guo et al. Citation2005; Zhang et al. Citation2018). Young goslings are at high risk of visceral gout, because they lack the urate oxidase enzyme, which oxidises poorly-soluble uric acid (UA) to water-soluble allantoin, resulting in an elevation of blood uric acid (UA;Guo et al. Citation2008; Bi Citation2016). Since 2016, the Chinese goose industry has experienced severe widespread outbreaks of visceral gout in young goslings, that resulted in serious gosling mortality and economic losses (Jin et al. Citation2018; Zhang et al. Citation2018). For goslings, this disease usually occurs between seven and 15 days after hatching (Lingping and Hengmin Citation1995; Guo et al. Citation2005; Gaba et al. Citation2010) and typically manifests as urate accumulation in the kidneys, on the serosal-surfaces of the heart, liver, mesenteries and air sacs. In severe cases, lesions can be observed on muscle surfaces and the synovial sheaths of joints (Rahimi et al. Citation2015; Smyth Citation2017). The induced factors of gout in goslings, however, are yet not completely understood, although it has been proposed that they may be related to pathogens (Jin et al. Citation2018; Zhang et al. Citation2018), nutrition (Li et al. Citation2019; Xi et al. Citation2019b) and/or environmental conditions. Further research into the factors responsible for visceral gout is required in order to develop prophylactic and remedial measures.
The disruption to blood chemistry induced by high blood UA is one of the most identifiable factors in the development of avian gout (Desai et al. Citation2017). Trends in blood metabolites are used for the diagnosis and in the control of gout. For example, studies have shown that serum urea and creatinine (Cr) concentrations are significantly elevated in growing layers with visceral gout; which may qualify them as diagnostic indices (Guo et al. Citation2005, Citation2008). However, it has been found that, because the elevation of serum UA and Cr usually are usually evident in the advanced stages of avian gout (Lingping and Hengmin Citation1995; Hainer et al. Citation2014; Xi et al. Citation2019b), these biomarkers have limited value for the early detection of the disease. Meanwhile, studies on key blood metabolites associated with avian gout are lacking (Xi et al. Citation2019a). Xanthine oxidase (XOD), a member of the molybdenum hydroxylase flavoprotein family, plays a vital role in the conversion of xanthine to UA. An increase in XOD activity may cause most of the damage to kidney function that is associated with hyperuricemia (Lin et al. Citation2016). Although it is known that serum XOD activity becomes elevated during avian gout (Hainer et al. Citation2014; Lin et al. Citation2016; Xi et al. Citation2019b), changes in its substrates (which include xanthine and hypoxanthine) have received far less attention. Therefore, despite much research, there are still gaps in the understanding of avian gout pathogenesis, and it remains challenging to treat this disease in goslings.
New biomarkers for gout are needed to improve the diagnosis of gout. High-throughput techniques used to identify biomarkers, such as metabolomic profiling, can deepen the understanding of disease pathogenesis and may eventually lead to new therapeutic targets (Yang et al. Citation2018; Jia et al. Citation2019; Lai et al. Citation2019). In the present study, untargeted GC/MS metabolomic analyses were performed to compare the serum profiles of goslings with gout to those of healthy individuals. The objectives were to identify key metabolites involved in gout pathogenesis, and to identify potential diagnostic biomarkers for gout.
Material and methods
Animals and sample collection
Thirty goslings (Anser cygnoides, 10–14 day-old) with suspected visceral gout were collected from several goose farmers in the vicinity of Nanjing, China, from Oct 2017 to Jun 2018. Twenty-five healthy goslings of similar ages were selected as controls and subjected to routine serum metabolite analysis along with the diseased birds. The blood samples (5 ml per gosling) were collected from all goslings using vacuum blood-collection tubes without anticoagulant. The blood samples were incubated at 37°C for 2 h and then centrifuged at 1500 × g for 15 min. The separated serum was stored in 0.6 ml Eppendorf tubes at −80°C for further analysis. The concentrations of serum UA, Cr and urea nitrogen (UN) were determined using enzymatic colorimetry in a microplate spectrophotometer (Promega Corporation, Madison, WI, USA) with reagents purchased from Jiancheng Bioengineering Institute (Nanjing, China). Through routine serum examination, 15 samples from diseased and 15 samples from healthy goslings, including nine females and six males, were selected for the further study.
As part of the selection standards, all the diseased goslings had gross kidney lesions and high serum UA (>500 μmol/l) (Xi et al. Citation2019a). The typical predominant gross lesions of kidneys were pale, mottled, and swollen. Renal tubules and ureters were distended with excess urates. In healthy individuals, the blood-UA concentration was 357 μmol/l for female and 416 μmol/l for male, which was considered dangerously high, given that the UA-saturation threshold in biological fluids is 416.5 μmol/l (Shi et al. Citation2003). In addition, the animals received no drug treatment. The study protocol was approved by the Ethics Committee of Jiangsu Academy of Agricultural Sciences.
Serum metabolite extraction
Samples of 10 μl from each serum collection (15 from each group) were pooled to use as the quality control (QC) sample. An aliquot of 50 μl of serum sample was transferred into 1.5 ml Eppendorf tubes, extracted with 0.2 ml methanol, mixed with 5 μl of L-2-chlorophenylalanine (1 mg/ml stock in distilled water) as internal standard, and vortexed for 30 s. The samples were subjected to ultrasound for 5 min in ice water and centrifuged for 15 min at 12 000 rpm at 150 x g and 4ºC. The supernatant (0.2 ml) was transferred into a fresh 1.5 ml Eppendorf tube and dried completely in a vacuum concentrator without heating. A volume of 30 μl of methoxy amination hydrochloride (20 mg/ml in pyridine) was added and the mixture incubated for 30 min at 80ºC. Next, 40 μl N,O-Bis trimethylsilyl trifluoroacetamide (BSTFA-TMCS) with trimethylchlorosilane, (99:1 v/v) was added to each sample and the mixture incubated for 1.5 h at 70ºC. A volume of 5 μl fatty acid methyl esters (FAME) in chloroform was added to the QC sample whilst cooling at room temperature. All samples were analysed using a gas chromatograph system coupled with a Pegasus HT time-of-flight mass spectrometer for further analysis.
Gas chromatography time-of-flight mass spectrometry (GC-TOF-MS) analysis
GC-TOF-MS analysis was performed using an Agilent 7890 gas chromatography system coupled with a Pegasus HT time-of-flight mass spectrometer. The system utilised a DB-5MS capillary column coated with 5% diphenyl cross-linked with 95% dimethylpolysiloxane (30 m × 250 μm inner diameter, 0.25 μm film thickness; J&W Scientific, Folsom, CA, USA). A 1 μl aliquot of the analyte was injected in splitless mode. Helium was used as the carrier gas; the front inlet purge flow was 3 ml/min and the gas flow rate through the column was 1 ml/min. The initial temperature was kept at 50°C for 1 min, then raised to 310°C at a rate of 20°C/min, then kept for 6 min at 310°C. The injection, transfer line, and ion source temperatures were 280, 280, and 250°C, respectively. The energy was −70 eV in electron impact mode. The mass spectrometry data were acquired in full-scan mode with the m/z range of 50–500 at a rate of 20 spectra per second after a solvent delay of 4.7 min. The procedure described by Li et al. (Citation2017) was followed.
Data preprocessing and annotation
Chroma TOF 4.3X software and the LECO-Fiehn Rtx5 database (LECO Corporation) were used for raw peak extraction, data baseline filtering, and calibration of the baseline, peak alignment, deconvolution analysis, peak identification and integration of the peak area (Kind et al. Citation2009). Both the mass spectrum and retention index matches were considered in metabolites identification. Peaks that were detected in <50% of QC samples or RSD >30% in QC samples were removed (Dunn et al. Citation2011).
Data processing
The resulting metabolite data, following normalisation and minimum value imputation, were loaded into SIMCA14.1 software (V14.1, Sartorius Stedim Data Analytics AB, Umea, Sweden) for principal component analysis (PCA) and orthogonal projections to latent structures discriminate analysis (OPLS-DA). The PCA showed the distribution of the original data. To obtain a higher-level group separation and to better understand the variables responsible for classification, supervised OPLS-DA was applied. Based on the variable importance on the projection (VIP) scores, we screened metabolites that differed significantly (i.e. those with VIP >1.0) between the gout and control groups. The screened metabolites were analysed using the Student’s t-test (unpaired, two-tailed) in Microsoft SPSS 17.0 (IBM), with a significance threshold of P < 0.05. Hierarchical clustering analysis was performed on the significantly expressed metabolites using Euclidean correlation as the distance measure, based on the Ward clustering algorithm. Receiver operating characteristic (ROC) curves were constructed using an Excel add-in, Multibase (Numerical Dynamics, Japan). Graphs were constructed using the gplot and ggplot2 packages in R. The KEGG (http://www.genome.jp/kegg/) and MetaboAnalyst 4.0 (http://www.metaboanalyst.ca/) commercial databases were used to identify metabolic pathways.
Results
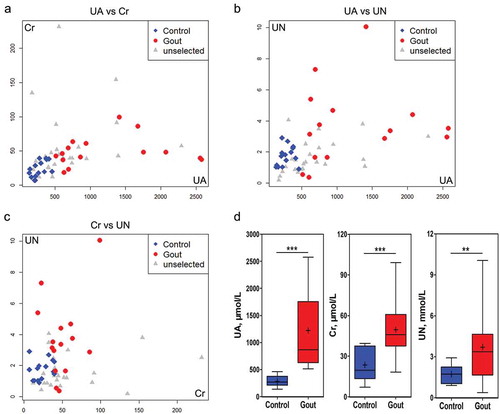
shows the Spearman correlation analysis between the metabolic indicators and the comparison of levels between the two groups; which were closely associated with occurrence visceral gout in the goslings. Serum UA, Cr, and UN levels in the gout group were significantly higher than those in the control group. The diseased and control goslings were of similar age and there were no statistically significant differences in age (control vs. gout: 12.14 ± 1.25 vs. 11.27 ± 1.94 days) or gender (nine females and six males, both in control and gout groups).
Figure 1. Analysis of uric acid (UA), creatine (Cr) and urea nitrogen (UN) in serum samples from goslings with gout and healthy individuals. a–c: Correlation analyses of serum samples comparing UA and Cr (a), UA and UN (b), and Cr and UN (c) levels. d: Differential analysis of selected serum variables between the control and gout-afflicted group (n = 15).
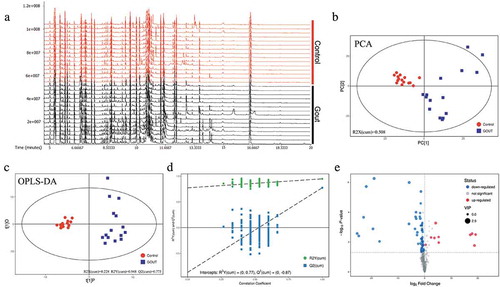
In GC-TOF-MS analysis, an overview of the metabolic characteristics of gout in the goslings is illustrated in . A total of 465 peaks were detected, and 306 metabolites were retained using interquartile range de-noising, for the 15 healthy and the 15 gout goslings. PCA supported the observation (R2X(cum) = 0.508) that the metabolomic profile of those with gout separated well from that of the controls ()). In OPLS-DA analysis, the parameters for classification from the software were R2Y (cum) = 0.228 and Q2Y (cum) = 0.948, which were stable and provide good fitness and prediction ()). Seven-fold cross validation was used to estimate the robustness and predictive ability of the model; a permutation test was used to further validate the model. The R and Q intercept values were (0, 0.77) and (0, −0.87), respectively, after 200 permutations. The low values of the Q intercept indicate the robustness of the models, indicating a low risk of overfitting, which were reliable ()). A volcano plot for these differential analyses was constructed to display the differences between the healthy and diseased groups ()).
Figure 2. Data modeling and selection of differentially expressed metabolites in healthy and gout-afflicted goslings. (a) Ion base peak intensity chromatogram of serum samples from gout-afflicted goslings. (b) PCA (principal component analysis) of the normalized peak areas of individual metabolites. (c) OPLS-DA differentiation of the control and gout groups. (d) Validation of OPLS-DA results based on 200 permutation tests. OPLS-DA: orthogonal projections to latent structures-discriminate analysis. PCA and OPLS-DA analysis were measured with SIMCA14.1 software (V14.1, Sartorius Stedim Data Analytics AB, Umea, Sweden). (e) Volcano plot of the differences in metabolite abundance between healthy and gout-afflicted goslings. N = 15. Gout-afflicted vs. Control.
A total of 45 metabolites differed significantly (VIP > 1 and P < 0.05) between gout-afflicted and healthy goslings, with most metabolites downregulated in the gout-afflicted group (Table S1). The heatmap for the two groups () was developed based on normalised data using auto-scale features for standardisation.
Figure 3. Heat map and hierarchical clustering of differentially expressed metabolites in healthy and gout-afflicted goslings. Red: upregulation; blue: downregulation. Hierarchical clustering analysis was performed on significantly expressed metabolites, using Euclidean correlation as the distance measure, based on the Ward clustering algorithm. N = 15 Gout-afflicted vs Control.
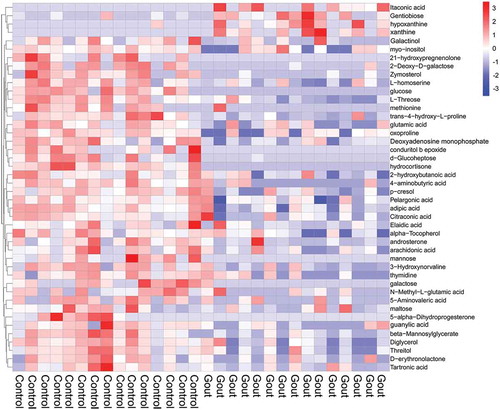
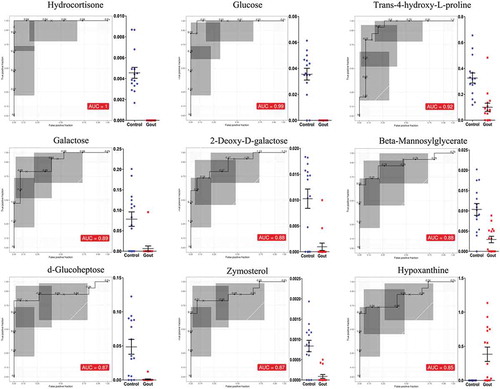
The majority of the differentially expressed metabolites were detected at lower concentrations in serum samples from goslings with gout; these comprised galactinol, mannose, glucose, conduritol β epoxide, hydrocortisone, 5-alpha-dihydroprogesterone, d-glucoheptose, and galactose. Only four metabolites (xanthine, itaconic acid, hypoxanthine, and gentiobiose) were upregulated in the gout-afflicted group relative to the control group. More importantly, there were nine differentially expressed metabolites (hydrocortisone, glucose, trans-4-hydroxy-L-proline, galactose, 2-deoxy-D-galactose, beta-mannosylglycerate, d-glucoheptose, zymosterol, and hypoxanthine), with AUC scores ≥85% for the ROC (). Relative abundances of these serum metabolites between the two groups are shown in .
Figure 4. Receiver operating characteristic (ROC) curves for the nine significantly expressed metabolites with an area under the ROC curve above 85%; comparisons are between gout-afflicted and control (healthy) goslings (Mean ± SE). ROC curves were constructed using an Excel add-in, Multibase (Numerical Dynamics, Japan).
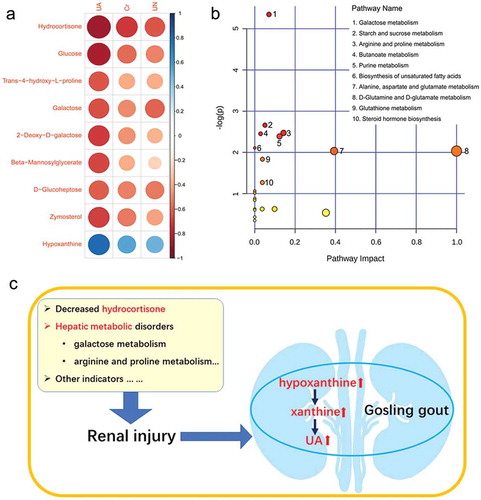
To explore the systemic relationship between disease occurrence and serum metabolites in goslings, the association between the abundance of marker metabolites and concentrations of serum UA, Cr and UN were analysed ()). A negative correlation was observed between serum indices and the average abundances of hydrocortisone, glucose, trans-4-hydroxy-L-proline, galactose, 2-deoxy-D-galactose, beta-mannosylglycerate, d-glucoheptose, and zymosterol, whereas hypoxanthine exhibited a positive correlation. Interestingly, these marker metabolites were more closely associated with the changes in serum UA. Differentially abundant metabolites in gout-afflicted and healthy goslings were compared to identify which pathways and biological functions were potentially impacted ()). The most affected pathways included those related to galactose metabolism, starch and sucrose metabolism, arginine and proline metabolism, butanoate metabolism and purine metabolism. Based on the amounts of metabolites that matched the databases, those metabolites involved in the pathways, including galactose metabolism (galactose, 2-deoxy-D-galactose, D-glucose, D-mannose, myoinositol, and galactinol), arginine and proline metabolism (trans-4-hydroxy-L-proline, gamma-aminobutyric acid, and L-glutamic acid), and purine metabolism (xanthine, deoxyadenosine monophosphate, guanosine monophosphate, and hypoxanthine) were selected for further discussion.
Figure 5. Analysis of the relationship between gout occurrence and significantly expressed metabolites affected by gout in goslings. (a) Correlation analysis between marker metabolites and serum indexes (UA, Cr and UN) associated with renal injury. The circle size and colour intensity represent the magnitude of correlation. Blue circle = positive correlation; red circle = negative correlation. UA: uric acid; Cr: creatine; UN: urea nitrogen. (b) Perturbed pathways identified in MetaboAnalyst 3.0 using a hypergeometric test for overrepresentation analysis and relative-betweenness centrality for pathway topology analysis. Here, the x-axis represents pathway impact and the y-axis represents pathway enrichment. Each node marks a pathway, with larger sizes and darker colours representing higher pathway enrichment and higher pathway impact values, respectively. (c) Schematic overview of the major metabolic pathways in goslings with gout. Avian gout could be believed as an aggregation of multiple metabolic disorders.
Discussion
This study was conducted to apply metabolomic approaches and elucidate blood metabolic changes during the development of avian visceral gout. A total of 306 metabolites were identified, including 45 that were differentially abundant in gout-afflicted and healthy goslings. PCA and OPLS-DA analysis of these metabolites identified a clear separation between the control and the gout-afflicted groups. Goslings with gout were characterised by a distinct metabolomic profile. Although most of the metabolites identified were present in both groups, it was postulated that a subset of differentially abundant metabolites may serve as potential biomarkers for gout, providing new insights into its pathogenesis in birds.
Gout has clear characteristics of purine metabolic disorder both in birds (Guo et al. Citation2005; Zhang et al. Citation2018) and humans (Reginato et al. Citation2012; Desai et al. Citation2017), in that it causes abnormal accumulation of urates. The current data revealed a significant alteration in metabolite levels in purine metabolism, whereby xanthine and hypoxanthine were upregulated in the gout-afflicted group. Hypoxanthine had an area under the ROC curve equal to 85%, demonstrating its potential for diagnosing gout. In humans, levels of xanthine and hypoxanthine (precursors of UA) have been elevated in gout patients with hyperuricemia and are presumed to be biomarkers for gout (Wang et al. Citation2019a). Moreover, they may be more helpful than serum UA for early diagnosis of gout, because in approximately 50% of cases, and particularly in acute attacks of gout, the disease occurs without hyperuricemia (Schlesinger Citation2010). In addition, most damage to kidney function associated with hyperuricemia is considered to be closely related to the increase in XOD (Lin et al. Citation2016), which can catalyse hypoxanthine to xanthine and then to UA. For birds, changes in purine metabolism associated with gout have not yet been reported; however, the physiological processes of purine metabolism are similar in birds and humans, because both lack urate oxidase (Guo et al. Citation2005, Citation2008; Xi et al. Citation2018). Therefore, using xanthine and hypoxanthine can be recommended, which are representative metabolites of purine metabolism, as biomarkers in the early diagnosis of avian gout.
Some workers have considered that alterations in glucocorticoid hormone metabolism are not a significant factor in gout (Marinello et al. Citation1985). Hydrocortisone (cortisol) is a steroid hormone – a glucocorticoid – that is released from the adrenal glands, which is responsible for a number of physiological and behavioural effects (Gormally et al. Citation2019). In the present study, it was found that serum levels of hydrocortisone (AUC = 1) in the gout-afflicted group were significantly decreased and negatively correlated to serum UA, Cr, and UN concentrations, which may have been due to serious kidney injury in gout-afflicted goslings. In glomerular disease patients, many blood proteins are excreted from the body in the urine, which can lead to hypoproteinemia and the decrease of corticosteroid-binding globulin, thus lowering the plasma cortisol (Palermo et al. Citation2000; Raff et al. Citation2008). In an earlier study, it was found that glomerular hypertrophy and basement membrane thickening occurred in goslings with gout (Xi et al. Citation2019a), which might be an important factor contributing to decreased cortisol in serum. Moreover, in human medicine, hydrocortisone has been used as a common drug for treatment of gout because of its anti‑inflammatory action, which can relieve intra-articular exudation, oedema, congestion, and leukocytic phagocytosis in the early stages of acute gout (Yagnik and Hills Citation2018). However, it was suspected that this is not the sole mechanism of action of hydrocortisone in the treatment of gout, because an external supplement of glucocorticoid hormone directly promotes in vitro cell proliferation of renal tubular epithelial in a noninflammatory environment (Huang et al. Citation2005).
In the present study, many metabolites in galactose metabolism were differentially expressed between the gout-afflicted and control groups. In particular, galactose (AUC = 0.89) and 2-deoxy-D-galactose (AUC = 0.88) levels showed a strong negative correlation with renal injury. It has been reported that abnormal concentrations of galactose causes degeneration of multiple organs, ageing (Cui et al. Citation2004) and liver diseases (Barretina et al. Citation2019), and causes a large release of reactive oxygen species and superoxide anion free radicals (Barretina et al. Citation2019). The liver is the main site of enzymic conversion of galactose to glucose (Schuler et al. Citation2018). In cancerous human liver tissue, galactokinase and galactose-1 phosphate uridylyl transferase genes are significantly upregulated relative to their levels in normal liver tissues (Barretina et al. Citation2019). Although no direct evidence of the link between galactose metabolism and avian gout has been reported so far, considering that goslings with gout usually experience liver injury (Jin et al. Citation2018; Zhang et al. Citation2018), it was speculated that abnormal galactose metabolism associated with gout may be related to liver lesions. In addition, utilisation of galactose requires a close interplay of metabolic enzymes, as mis-regulation or malfunction of individual components can lead to the accumulation of toxic intermediate compounds (Schuler et al. Citation2018). It was found that 2-deoxy-D-galactose can be considered a marker for gosling gout. It is known that 2-deoxy-D-galactose may induce hepatotoxicity owing to inhibition of uridine triphosphate-dependent macromolecule biosynthesis by uridine phosphate depletion (Veillon et al. Citation2010), and thus might be involved in the development of gout. It was not the intention in this study to clarify the mechanisms of galactose metabolism in goslings with gout; however, this field is important for future studies into avian gout. In addition, the other metabolites produced during glycometabolism (), including glucose (AUC = 0.99) and d-glucoheptose (AUC = 0.87), reflect the close relationship between gout and glycometabolic disorders. It is known that the liver is a primary organ in glycometabolism (Ding et al. Citation2019), and alterations in glycometabolites suggest the existence of liver injuries that can be induced by gout in goslings. In this regard, the use of metabolomic analysis in this study helped to demonstrate a novel link between gout and liver injury.
The experiment showed that the arginine and proline metabolic pathways were affected in avian gout. In particular, trans-4-hydroxy-L-proline (AUC = 0.92) was as an effective marker metabolite for diagnosing gout in goslings. Upon cellular uptake of arginine, it is metabolised to proline (Wang et al. Citation2019b). Trans-4-hydroxy-l-proline is a valuable chiral intermediate compound for this metabolic process, the product of the most abundant human posttranslational modification (Levin et al. Citation2017). It has been reported that animals with chronic hepatitis have significantly lower serum trans-4-hydroxy-l-proline concentrations than healthy individuals, possibly as a result of disturbance of amino acid metabolism in the liver (Lawrence et al. Citation2019). Thus, it can be proposed that the decrease of serum trans-4-hydroxy-L-proline in goslings with gout in the current study might be closely-related to severe gout-induced liver injury.
Conclusions
Goslings with gout experienced a significant shift in serum metabolite profiles. This experiment successfully used a metabolomics approach to identify nine marker metabolites involved in purine, galactose, arginine, proline metabolism. Increased xanthine and hypoxanthine, with decreased hydrocortisone, proved to be promising biomarkers for diagnosing gout in goslings, which provided new insights into gout pathogenesis. Moreover, various metabolic pathways in the liver, particularly those for galactose, arginine, and proline metabolism, are usually disrupted during development of gout in goslings. Therefore, more attention needs be paid to liver health, which has been long-overlooked in avian gout. This work not revealed a new dimension for studying the pathogenesis of gout in goslings and provided a research basis for exploring methods for early diagnosis of avian gout.
Table S1. Differentially Expressed Metabolites
Download MS Word (30.7 KB)Disclosure statement
No potential conflict of interest was reported by the authors.
Supplementary material
Supplemental data for this article can be accessed here.
Additional information
Funding
References
- Barretina, J., G. Caponigro, N. Stransky, K. Venkatesan, A. A. Margolin, S. Kim, C. J. Wilson, et al. 2019. “Addendum: The Cancer Cell Line Encyclopedia Enables Predictive Modelling of Anticancer Drug Sensitivity.” Nature 565: E5–E6. doi:10.1038/s41586-018-0722-x.
- Bi, J. 2016. “The Reason Analysis of Gout in Chicken”. Hebei Journal of Animal Husbandry & Veterinary Medicine (in Chinese) (07):64–65.
- Cui, X., L. Wang, P. Zuo, Z. Han, Z. Fang, W. Li, and J. Liu. 2004. “D-galactose-caused Life Shortening in Drosophila Melanogaster and Musca Domestica Is Associated with Oxidative Stress.” Biogerontology 5: 317–325. doi:10.1007/s10522-004-2570-3.
- Desai, J., S. Steiger, and H. J. Anders. 2017. “Molecular Pathophysiology of Gout.” Trends in Molecular Medicine 23: 756–768. doi:10.1016/j.molmed.2017.06.005.
- Ding, H. R., J. L. Wang, Z. T. Tang, Y. Wang, G. Zhou, Y. Liu, H. Z. Ren, and X. L. Shi. 2019. “Mesenchymal Stem Cells Improve Glycometabolism and Liver Regeneration in the Treatment of Post-hepatectomy Liver Failure.” Frontiers in Physiology 10: 412. doi:10.3389/fphys.2019.00412.
- Dunn, W. B., D. Broadhurst, P. Begley, E. Zelena, S. Francis-Mcintyre, N. Anderson, M. Brown, et al. 2011. “Procedures for Large-scale Metabolic Profiling of Serum and Plasma Using Gas Chromatography and Liquid Chromatography Coupled to Mass Spectrometry.” Nature Protocols 6: 1060–1083. doi:10.1038/nprot.2011.335.
- Gaba, A., H. Dave, J. K. Pal, and K. S. Prajapati. 2010. “Isolation, Identification and Molecular Characterization of IBV Variant from Out Break of Visceral Gout in Commercial Broilers.” Veterinary World 65: 431–438.
- Gormally, B. M. G., R. Fuller, M. McVey, and L. M. Romero. 2019. “DNA Damage as an Indicator of Chronic Stress: Correlations with Corticosterone and Uric Acid.” Comparative Biochemistry and Physiology. Part A, Molecular and Integrative Physiology 227: 116–122. doi:10.1016/j.cbpa.2018.10.007.
- Guo, X., K. Huang, F. Chen, J. Luo, and C. Pan. 2008. “High Dietary Calcium Causes Metabolic Alkalosis in Egg-type Pullets.” Poulty Science 87: 1353–1357. doi:10.3382/ps.2008-00058.
- Guo, X., K. Huang, and J. Tang. 2005. “Clinicopathology of Gout in Growing Layers Induced by High Calcium and High Protein Diets.” British Poultry Science 46: 641–646. doi:10.1080/00071660500302661.
- Hainer, B. L., E. Matheson, and R. T. Wilkes. 2014. “Diagnosis, Treatment, and Prevention of Gout.” American Family Physician 90: 831–836.
- Huang, Q. Y., J. E. Huang, and P. C. Huang. 2005. “MTT Assay for Activities of the Renal Tubular Epithelial Cell in Hydrocortisone at Different Concentration.” Anthology of Medicine 024(004): 459–461. (In Chinese).
- Jia, C., H. Xu, Y. Xu, Y. Xu, and Q. Shi. 2019. “Serum Metabolomics Analysis of Patients with Polycystic Ovary Syndrome by Mass Spectrometry.” Molecular Reproduction and Development 86: 292–297. doi:10.1002/mrd.v86.3.
- Jin, M., X. Wang, K. Ning, N. Liu, and D. Zhang. 2018. “Genetic Characterization of a New Astrovirus in Goslings Suffering from Gout.” Archives of Virology 163: 2865–2869. doi:10.1007/s00705-018-3932-5.
- Kind, T., G. Wohlgemuth, D. Y. Lee, Y. Lu, M. Palazoglu, S. Shahbaz, and O. Fiehn. 2009. “FiehnLib: Mass Spectral and Retention Index Libraries for Metabolomics Based on Quadrupole and Time-of-flight Gas Chromatography/mass Spectrometry.” Analytical Chemistry 81: 10038–10048. doi:10.1021/ac9019522.
- Lai, Y., J. Xue, C. W. Liu, B. Gao, L. Chi, P. Tu, K. Lu, and H. Ru. 2019. “Serum Metabolomics Identifies Altered Bioenergetics, Signaling Cascades in Parallel with Exposome Markers in Crohn’s Disease.” Molecules 24 (3), doi:10.3390/molecules24030449.
- Lawrence, Y. A., A. Rodrigues-Hoffmann, J. M. Steiner, J. S. Suchodolski, S. Shankar, C. L. Klemashevich, and J. A. Lidbury. 2019. “Development, Validation, and Application of a Liquid Chromatography-tandem Mass Spectrometry Method for Quantitative Determination of Trans-4-hydroxy-l-proline Concentration in the Serum of Dogs with Chronic Hepatitis.” American Journal of Veterinary Research 80: 434–440. doi:10.2460/ajvr.80.5.434.
- Levin, B. J., Y. Y. Huang, S. C. Peck, Y. Wei, A. Martinez-Del Campo, J. A. Marks, E. A. Franzosa, C. Huttenhower, and E. P. Balskus. 2017. “A Prominent Glycyl Radical Enzyme in Human Gut Microbiomes Metabolizes Trans-4-hydroxy-l-proline.” Science 355(6325).
- Li, M. M., X. D. Ding, X. L. Rong, T. Y. Fang, S. F. Shou, and J. J. Wu. 2019. “Clinical Pathological Study of Gout in Goose Induced by High Protein Diet (In Chinese).” Journal of South China Agricultural University 40 (1): 46–52.
- Li, T., E. Li, Y. Suo, Z. Xu, Y. Jia, J. G. Qin, L. Chen, and Z. Gu. 2017. “Energy Metabolism and Metabolomics Response of Pacific White Shrimp Litopenaeus Vannamei to Sulfide Toxicity.” Aquatic Toxicology (Amsterdam, Netherlands) 183: 28–37. doi:10.1016/j.aquatox.2016.12.010.
- Lin, H., Y. Chen, Q. Huang, X. Guo, P. Liu, W. Liu, C. Zhang, H. Cao, and G. Hu. 2016. “Prokaryotic Expression of the Chicken Xanthine Oxidase (XOD) Subunit and Its Localization in Liver and Kidney.” International Journal of Biological Macromolecules 87: 341–347. doi:10.1016/j.ijbiomac.2016.03.001.
- Lingping, L., and C. Hengmin. 1995. “Avian Gout──A Review.” China Poultry 23: 15–16.
- Marinello, E., G. Riario-Sforza, and R. Marcolongo. 1985. “Plasma Follicle-stimulating Hormone, Luteinizing Hormone, and Sex Hormones in Patients with Gout.” Arthritis & Rheumatism 28: 127–131. doi:10.1002/(ISSN)1529-0131.
- Palermo, M., G. Delitala, G. Sorba, M. Cossu, R. Satta, R. Tedde, A. Pala, and C. H. Shackleton. 2000. “Does Kidney Transplantation Normalise Cortisol Metabolism in Apparent Mineralocorticoid Excess Syndrome?.” Journal of Endocrinological Investigation 23: 457–462. doi:10.1007/BF03343755.
- Raff, H., S. Brock, and J. W. Findling. 2008. “Cosyntropin-stimulated Salivary Cortisol in Hospitalized Patients with Hypoproteinemia.” Endocrine 34: 68–74. doi:10.1007/s12020-008-9101-y.
- Rahimi, M., Z. Minoosh, and S. Haghighi. 2015. “Visceral Urate Deposition in a Little Bittern (Ixobrychus Minutus).” Veterinary Research Forum: an International Quarterly Journal 6: 177–180.
- Reginato, A. M., D. B. Mount, I. Yang, and H. K. Choi. 2012. “The Genetics of Hyperuricaemia and Gout.” Nature Reviews. Rheumatology 8: 610–621. doi:10.1038/nrrheum.2012.144.
- Schlesinger, N. 2010. “Diagnosing and Treating Gout: A Review to Aid Primary Care Physicians.” Postgraduate Medicine 122: 157–161. doi:10.3810/pgm.2010.03.2133.
- Schuler, D., C. Holl, N. Grun, J. Ulrich, B. Dillner, F. Klebl, A. Ammon, L. M. Voll, and J. Kamper. 2018. “Galactose Metabolism and Toxicity in Ustilago Maydis.” Fungal Genetics and Biology 114: 42–52. doi:10.1016/j.fgb.2018.03.005.
- Shi, Y., J. E. Evans, and K. L. Rock. 2003. “Molecular Identification of a Danger Signal that Alerts the Immune System to Dying Cells.” Nature 425: 516–521. doi:10.1038/nature01991.
- Smyth, V. J. 2017. “A Review of the Strain Diversity and Pathogenesis of Chicken Astrovirus.” Viruses 9(2). doi:10.3390/v9020029.
- Veillon, L., S. Muniruzzaman, G. Henderson, and R. A. Laine. 2010. “Toxic Effects of 2-Deoxy-D-Galactose on Coptotermes Formosanus (Isoptera: Rhinotermitidae) and Symbionts.” Journal of Economic Entomology 103: 1647–1656. doi:10.1603/EC09155.
- Wang, Y., M. Deng, B. Deng, L. Ye, X. Fei, and Z. Huang. 2019a. “Study on the Diagnosis of Gout with Xanthine and Hypoxanthine.” Journal of Clinical Laboratory Analysis 33(5): e22868.
- Wang, Y., D. Zhu, Y. Chen, R. Jiang, H. Xu, Z. Qiu, D. Liu, and H. Luo. 2019b. “Metabonomics Study of Ginseng Glycoproteins on Improving Sleep Quality in Mice.” BioMed Research International 2019, 2561828. doi:10.1155/2019/2561828.
- Xi, Y., J. Yan, M. Li, S. Ying, and Z. Shi. 2019a. “Gut Microbiota Dysbiosis Increases the Risk of Visceral Gout in Goslings through Translocation of Gut-derived Lipopolysaccharide.” Poultry Science 98 (11): 5361–5373. doi:10.3382/ps/pez357.
- Xi, Y. M., J. S. Yan, S. J. Ying, and Z. D. Shi. 2018. “Causes and Control Measures of Gout in Goslings (In Chinese).” China Poultry 40: 63–66.
- Xi, Y. M., J. S. Yan, S. J. Ying, and Z. D. Shi. 2019b. “The Effects of High -protein and -calcium Diets on the Visceral Gout Development, Kidney Functions and Intestinal Microbial Communities in Goslings (In Chinese).” Chinese Journal of Animal Nutrition 31: 20–28.
- Yagnik, D., and F. Hills. 2018. “Urate Crystals Induce Macrophage PAFAH Secretion Which Is Differentially Regulated by TGFbeta1 and Hydrocortisone.” Molecular Medicine Reports 18: 3506–3512. doi:10.3892/mmr.2018.9323.
- Yang, X., L. Chai, C. Liu, M. Liu, L. Han, C. Li, H. Guo, et al. 2018. “Serum Metabolomics Analysis in Wasp Sting Patients.” BioMed Research International 2018: 5631372. doi:10.1155/2018/5631372.
- Zhang, Q., Y. Cao, J. Wang, G. Fu, M. Sun, L. Zhang, L. Meng, et al. 2018. “Isolation and Characterization of an Astrovirus Causing Fatal Visceral Gout in Domestic Goslings.” Emerging Microbes & Infections 7: 71. doi:10.1038/s41426-018-0074-5.