
Abstract
Indonesia is maintaining economic growth at 5% per annum, with the country holding the mantle of the world’s most stable economic growth since 2002. However, trade flows contracted in the first half of 2019, and ongoing international trade frictions have created a challenging external environment. Inflation remains within the target range, and Bank Indonesia has, like other central banks, moved to cut interest rates. Urban air pollution is an increasingly prominent issue, with Jakarta’s air quality index frequently reaching unhealthy levels in mid-2019. President Joko Widodo has announced an intention for the government to build a new national capital city in East Kalimantan, a plan that would involve substantial costs if it were to go ahead.
The president has used the phrase ‘No one left behind’ in prioritising inclusivity in the development process in line with the United Nations’ Sustainable Development Goals (SDGs). We review Indonesia’s considerable progress in broadening residential access to modern energy, developing the case for a new ‘beyond electrification’ agenda and renewed efforts in improving access to clean cooking. We also focus on the status of three groups with members who face marginalisation from full participation in society: the disabled, the elderly and the unemployed. Steps are being taken to establish and broaden targeted assistance for members of each of these groups. Nevertheless, there is a long way to go in reducing the extent to which marginalised members of society are left behind.
Indonesia mempertahankan tingkat pertumbuhan ekonomi sebesar 5% per tahun, menjadikannya sebagai negara dengan pertumbuhan ekonomi paling stabil sejak tahun 2002. Tetapi, arus perdagangan mengalami kontraksi di paruh pertama tahun 2019, dan friksi perdagangan internasional yang terjadi saat ini memberikan tantangan dalam ekonomi luar negeri. Inflasi tetap berada dalam rentang yang ditargetkan, dan Bank Indonesia, seperti juga bank sentral lainnya, telah menurunan suku bunga acuan. Polusi udara di kota-kota besar terus menjadi isu dengan indeks kualitas udara di Jakarta mencapai tingkat yang membahayakan kesehatan pada pertengahan tahun 2019. Presiden Joko Widodo telah mengumumkan keinginan pemerintah untuk membangun sebuah ibu kota baru di Kalimantan Timur, sebuah rencana dengan konsekuensi biaya yang luar biasa besar jika dilaksanakan. Presiden sudah menggunakan frasa ‘no one left behind’ (tidak ada orang tertinggal) dalam memprioritaskan inklusifitas dalam proses pembangunan, sejalan dengan Tujuan Pembangunan Berkelanjutan (SDG) dari Perserikatan Bangsa-bangsa. Kami mengkaji perkembangan Indonesia dalam memperluas akses rumah tangga untuk energi modern, sebagai bagian untuk mempromosikan agenda baru “lebih dari sekedar elektrifikasi” dan untuk memperbaharui upaya memperbaiki akses untuk praktik memasak yang lebih bersih. Kami juga berfokus pada status dari tiga kelompok yang anggotanya menghadapi marjinalisasi dari partisipasi penuh dalam masyarakat: kaum cacat, orang tua, dan pengangguran. Telah diambil langkah-langkah untuk menetapkan dan memperluas sasaran untuk masing-masing grup ini. Namun demikian, jalan masih panjang untuk bisa mengurangi ketertinggalan kelompok-kelompok marjinal tersebut.
ENTERING JOKOWI’S SECOND TERM
In late June 2019, the Constitutional Court rejected presidential candidate Prabowo Subianto’s appeal against the presidential election result, paving the way for incumbent president Joko Widodo (Jokowi) to prepare for a second term. The court’s decision saw the post-election protests by Prabowo’s supporters come to an end. In mid-July, Prabowo met the president to congratulate him on his win, with the two sharing a ride on Jakarta’s newly opened mass rapid transit (MRT) system. However, the lead-up to Jokowi’s October reinauguration has remained far from smooth. In September—the final sitting month of its term—the House of Representatives (DPR) seized an opportunity to pass a bill that undermines the independence of the Corruption Eradication Commission (KPK). The highly popular KPK will be subject to oversight from a supervisory board and will no longer have the right to carry out independent wiretapping, among other changes. The KPK has played an important role in fighting corruption in Indonesia, including bringing cases against sitting politicians (Umam et al. Citation2018). If the new arrangement is not reversed, all signs suggest that the ability of the KPK to do this important work will be diminished.
The KPK bill, together with a series of other proposed bills considered by the DPR, triggered a major wave of student-led protests in late September across cities including Jakarta, Bandung, Yogyakarta, Semarang and Medan. Chief among the other proposed new bills was a draft criminal code that, if passed, would lead to the criminalisation of a variety of actions, including insulting the president and having sex outside marriage. The bills have now been passed over for consideration by the newly elected members of the DPR, who were sworn in at the start of October.
Separately, the most serious episode of protests and riots in Papua and West Papua in decades commenced in late August, culminating in violent clashes, the destruction of public buildings and the death of more than 30 people in Wamena, the district capital of Jayawijaya in Papua, on 23 September. Worryingly, the flow of information from these two provinces is restricted by the Indonesian government. The government also slowed internet access in some areas as the tensions simmered.
There has been considerable disappointment in the president’s lack of advocacy and leadership on the matters of the KPK and the criminal code, and Jokowi faces a difficult challenge in navigating a course that will balance pressures from both his political allies and the public. A degree of diminution of Jokowi’s political capital in the aftermath of the protests threatens to constrain his ability to pursue an ambitious second-term agenda. The president’s post-election focus has also been diverted to a proposal for Indonesia to build a new capital city in East Kalimantan. The desirability of this plan is highly questionable (see below).
Much interest lies in the president’s choice of cabinet members for his new term. Jokowi has expressed an intention to appoint some younger professionals to key roles, although he has the challenge of accommodating the varied interests of the 10 parties that belong to the Working Indonesia Coalition (KIK).Footnote1 In August, Jokowi confirmed that there would be reforms to the structures and mandates of some ministries, with a new Ministry of Investment to be established (Jakarta Globe Citation2019).
At the October 2018 ASEAN Leaders’ Gathering in Bali, the president used the phrase ‘No one left behind’ in referring to the need to ensure that economic development is inclusive of all. The phrase is drawn from the United Nations’ 2030 Agenda for Sustainable Development, under which 17 Sustainable Development Goals (SDGs) were agreed by the international community.Footnote2 The SDGs include ending poverty (SDG 1), achieving universal access to affordable and clean energy (SDG 7) and sustaining decent work and economic growth (SDG 8). Jokowi has also used the phrase with reference to participation in the digital economy (Jordan Citation2019) and in a key post-election speech in Bogor in July 2019. While the phrase should not be taken too literally—some people are always left behind, at least in relative terms—it does encapsulate a desire to make progress towards meeting the SDGs and enhancing the inclusivity of development, not only for the poor but also for other often-marginalised groups.
A NEW CAPITAL CITY FOR INDONESIA?
While the idea of building a new capital city has a long history, its prominent reemergence in the post-election period of 2019 has taken many by surprise. In late April 2019—less than two weeks after the presidential election—President Widodo publicly flagged his desire to establish a new national capital, despite not having hinted at it during the election campaign. During his 16 August State of the Nation address, the president encouraged support for a move to a yet-to-be-decided location in Kalimantan. On 28 August, he went on to announce that his chosen location encompasses parts of North Penajam Paser and Kutai Kartanegara districts in East Kalimantan, and that a bill was being prepared for house approval. The stated plan is for construction to start at the end of 2020 and for offices to begin to be moved in 2024, although substantial delays should be expected.
There are three stated motives. The first is to try to help decentralise Indonesia’s political and economic activities away from Jakarta and Java. The second is to take some pressure off Jakarta, a city affected by traffic congestion, air pollution (see box 1), and subsidence and flooding. The third is to ensure that Indonesia has a safe and liveable capital for the long term, noting that Jakarta is exposed to both sea level rise and earthquake risk. The idea of a new capital city is consistent with Jokowi’s style of prioritising ‘developmentalism’—often in the form of big infrastructure projects—over other economic or governance priorities (Warburton Citation2018). Personal ambition is often not entirely absent from big projects conceived by political leaders. The ambitious minister of national development planning, Bambang Brodjonegoro, has been a key figure in championing the idea.
Jakarta’s air pollution became a very public issue in mid-2019 after a large number of unusually polluted days and after a group of citizens launched legal action against the president, the Ministry of Environment and Forestry, the Ministry of Health, and the governors of Jakarta, Banten and West Java (Andapita Citation2019). Air pollution from forest and peat fires in Sumatra and Kalimantan was again serious, with cities such as Palembang, Jambi and Palangkaraya experiencing severe haze and associated public health issues in September. The fires of 2019 were the worst since 2015. Effects have flowed on to Malaysia, Singapore and other countries in the region.
Greenstone and Fan (Citation2019) estimate that the average life expectancy of Indonesians is reduced by about a year because of exposure to airborne particulate matter 2.5 (PM2.5) levels in excess of World Health Organization guidelines.Footnote1 There is sizeable regional variation in this effect: the estimate for Jakartans is about two years, and for residents of Palembang about five years. Evidence on the deleterious effects of air pollution on many aspects of human health is growing. In a study of China, for example, Zhang, Chen and Zhang (Citation2018) found that cumulative exposure to air pollution reduces cognitive ability.
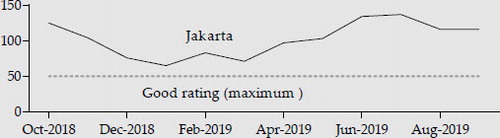
Just how polluted is Jakarta’s air? shows monthly averages of the air quality index (AQI) for PM2.5 pollution in Jakarta over the 12 months to September 2019. Jakarta’s monthly average AQI is typically in the ‘moderate’ (51–100) or ‘unhealthy for sensitive groups’ (101–50) ranges. Conditions were particularly bad in June and July 2019, with the average AQI exceeding 130. Daily-average air quality was in the ‘unhealthy’ range (151+) on 16% of days in this two-month window. Jakarta’s average AQI for the year to September was 101—better than Delhi’s (167) but worse than Bangkok’s (82).Footnote2
FIGURE 1 PM2.5 Air Quality Index for Jakarta, October 2018–September 2019
Source: World Air Quality Index (Citation2019).
Notes: The air quality index is based on the US Environmental Protection Agency standard, with 0–50 considered to be good, 51–100 moderate, 101–50 unhealthy for sensitive groups, 151–200 unhealthy, 201–300 very unhealthy, and 300 and over hazardous. The figure shows monthly averages of daily-average recordings, as measured at the US Embassy. PM = particulate matter.
Policy frameworks for reducing urban pollution remain weak in Indonesia (OECD 2019), although the Ministry of Environment and Forestry is belatedly seeking to introduce a national regulation requiring emissions tests for motor vehicles (Kurniawan Citation2019). Many opportunities are available for tackling Jakarta’s air pollution, including a transition to cleaner forms of energy and non-polluting transport options such as electric vehicles. At a cabinet meeting on 8 July 2019, the president reportedly called for Indonesia to begin to reduce its use of coal (Jong Citation2019), although there is a large disconnect between this statement and Indonesia’s Electricity Supply Business Plan (RUPTL) 2019–28, which is centred on ongoing expansion of coal-fired electricity generation.
Building a new capital would be costly, however, and would displace resources from Indonesia’s many other priorities, including the improvement of infrastructure in existing cities and the pursuit of the ‘no one left behind’ agenda. The National Development Planning Agency prepared a widely cited estimate that the investment required by the government and the private sector would be in the order of Rp 466 trillion ($33 billion) (Bappenas 2019), although this does not include all of the investment requirements for a modern capital. The need for ongoing travel between the new capital and the rest of the country (including Jakarta) means that additional costs would also be ongoing, not just upfront. While Jakarta may not lie at the geographical centre of Indonesia’s vast archipelago, it is far more connected to most Indonesians than East Kalimantan and will likely remain so for many decades. There would also be sizeable environmental costs and social implications of a move, as the chosen site and surrounding areas are forested and home to indigenous communities.
Local ‘Dutch disease’ effects of a relocation should be expected. An inflow of investment to East Kalimantan would push up prices of non-tradables such as housing. Labour and some other inputs are also likely to be relatively scarce given the remoteness of the proposed location and the time that would be needed to develop a viable city. Living costs in the new capital are likely to be high.
The proposal would not solve Jakarta’s problems, since only a small proportion of Jakarta’s population could be expected to move. Direct solutions are needed, such as pollution reduction policies, road pricing and tighter management of groundwater access. One of the more ambitious options is a proposal in the National Capital Integrated Coastal Development (NCICD) masterplan to build a 20-kilometre sea dike in the western part of Jakarta Bay, with the goal of reducing Jakarta’s exposure to flooding. This project would require substantial investment funds, and concerns remain about its environmental, social and economic desirability (Atika Citation2019a). Progress on simpler projects such as the reinforcement of an embankment on the northern coast of Jakarta has been slow, partly because of uncertainty over funding (Atika Citation2019b). In August 2019, the central government announced that Rp 571 trillion ($40 billion) would be committed to an urban regeneration program for Jakarta. In considering a move to a new capital, one case to avoid emulating is Naypyidaw, Myanmar’s capital city since 2005. The city remains remote and isolated—far from being a dynamic national centre. The former capital, Yangon, remains the city of choice for most embassies and non-government organisations. The risk for Indonesia is that, geographically, East Kalimantan is even more isolated. Naypyidaw is only about 320 kilometres overland from Yangon, whereas the chosen location in East Kalimantan is about 1,300 kilometres from Jakarta—with the Java Sea in between. South Korea is another case to consider, having recently moved key government functions to a new city, Sejong Special Autonomous City (about 120 kilometres south of Seoul). The decision to do so was made in 2002, with the first agencies starting the move in late 2013. Six years later, many of the relocated government officials continue to have their main residence in Seoul, citing reasons such as not wanting to be separated from family (Steger and Lee Citation2018; Babe Citation2019). It is not a straightforward task to shift to a new administrative centre.
The case of Malaysia is also relevant. In 1999, Malaysia moved its seat of government to Putrajaya, 23 kilometres from Kuala Lumpur. Kuala Lumpur retains the role of capital city. Moving government functions to a nearby location involves much less disruption than moving them to a distant location. There is evidence that distance matters for governance quality: recent research by Campante, Do and Guimaraes (Citation2019) found that countries with capital cities that are more isolated from their populations tend to have poorer governance.
Commencing the construction of a new capital city would come with a high likelihood of future regret, in stark contrast to the many other no- or low-regret investment options that are available in Indonesia, such as improved infrastructure in established cities and investments in health and education. Improving the sustainability and liveability of Jakarta is not a hopeless task; Tokyo and London are examples of megacities that are also national capitals, each having substantially overcome previously acute problems such as air pollution. Indeed, Tokyo halted a long-run trend of groundwater loss and land subsidence by enacting steps such as restrictions on groundwater pumping (Erkens et al. Citation2015). While climate change poses a serious threat to Jakarta and other low-lying cities, building a new capital city in East Kalimantan is unlikely to be the least-cost option for adapting to climate change.
We conclude that the costs of building a remote new capital, together with a host of other considerations, make it an inadvisable idea. If the plan goes ahead, it may well come at the cost of a diminished legacy for the president in terms of improvements to existing cities and to health, education and other outcomes for Indonesians.
MACROECONOMIC DEVELOPMENTS
Economic Growth
Indonesia has continued its uninterrupted run of stable, if softening, economic growth, recording an expansion of 5.0% in the June quarter of 2019 in year-on-year terms (). Investment growth slowed to just 5.0% year on year in both the March and June quarters, down from an annual rate of 6.7% in 2018. Growth in household consumption has remained relatively stable (5.2% in the June quarter of 2019), while growth in government consumption has strengthened.
Table 1. Components of GDP Growth (2010 prices; % year on year)
Indonesia’s exports declined by 1.8% and imports by 7.0% in real terms in the first half of 2019 relative to the first half of 2018. A key factor has been reductions in both exports and imports of oil and gas, with exports down by 20.4% and imports down by 16.9% in real terms. Contributing to these declines were new interventionist mandates introduced in September 2018 that require prioritisation of the domestic use of Indonesian oil and increased use of biodiesel (World Bank Citation2019a). It has also been a difficult first half of the year for international trade throughout the region because of the ongoing trade frictions between the United States and China, and slowdowns in economic growth in China, India and elsewhere.
Indonesia’s information/communication and services sectors continued to grow rapidly, whereas the output of the mining and quarrying sector fell slightly in the June quarter relative to the same quarter in 2018. While coal output expanded quickly, recording 11.9% year-on-year growth in the June quarter, there was a large decline in the output of copper ore as a result of the transitioning of Freeport-McMoRan’s Grasberg mine from open-pit to underground extraction (SMM News Citation2019). Production at the Tangguh liquefied natural gas plant in West Papua fell because of scheduled maintenance (Hellenic Shipping News Citation2019).
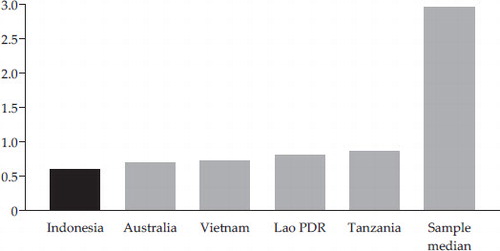
The stability of Indonesia’s economic growth has not only been a phenomenon of the past several years. Indeed, Indonesia had the world’s most stable economic growth over the period 2002–18, with its annual real GDP growth rate exhibiting a standard deviation of only 0.6 percentage points ().Footnote3 The rate remained in the narrow range of 4.5%–6.3% in every year of this period. Economic growth has become even more stable over time, remaining between 4.9% and 5.2% per annum in every year since 2014 (World Bank Citation2019b). The consistency of Indonesia’s economic growth performance stands in stark contrast to the economic turbulence that the country witnessed during the Asian financial crisis (AFC) of the late 1990s. At that moment in history, one would have found it difficult to imagine that Indonesia would assume the mantle of having the world’s most stable economic growth rate over such a sustained period.
FIGURE 2 Standard Deviation of Annual GDP Growth Rate, 2002–18 (percentage points)
Source: World Bank (Citation2019b).
Notes: The standard deviation is calculated for each country’s real annual GDP growth rate in percentage terms, using GDP data in constant 2010 dollars. The five countries with the lowest standard deviations are shown, along with the sample median. Data are available for 209 countries.
What explains the stability of Indonesia’s economic growth? The spatial and sectoral diversification of Indonesia’s economy has helped: when commodities are not booming, growth in other sectors such as services has tended to hold up.Footnote4 A relatively small trade-to-GDP ratio means that Indonesia has been less exposed to global fluctuations than many other countries.Footnote5 Indonesia’s political stability has also helped, certainly relative to a country such as Thailand, which has experienced political crises and coups. Indonesia has also maintained a good overall record of macroeconomic management and crisis risk mitigation (IMF 2019). The avoidance of any major short-term dips in economic growth has likely helped to consolidate Indonesia’s new democratic institutions, as growth slowdowns can trigger political instability (Burke Citation2012).
In terms of the rate of economic growth, Indonesia’s average of 5.4% per annum over 2002–18 ranks in the top quartile of countries. While economic growth has been slower than in China (9.2% per annum on average over 2002–18) or Vietnam (6.5%), Indonesia’s performance compares favourably with the overall economic growth rate of the East Asia and Pacific region (4.6%). Indonesia’s economic growth rate has slowed slightly in recent years, from above 6% per annum in 2010–12 to an average of just over 5% per annum since. Resosudarmo and Abdurohman (Citation2018) concluded that economic growth is likely to continue at about 5% per annum—or perhaps a slightly lower rate—over coming years in the absence of strong external stimulus or major reforms. The US–China trade tensions have contributed more to downside than upside momentum from the world economy over the short term (IMF 2019; World Bank Citation2019c).
Inflation, Monetary Policy and Financial Markets
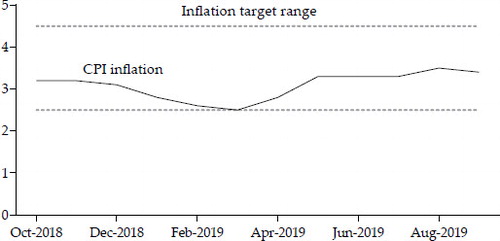
Indonesia’s annual inflation rate was 3.4% over the year to September 2019, near the middle of Bank Indonesia’s target range of 2.5%–4.5% (). Average consumer prices for energy products fell by 0.1% in this period for reasons including a cut in March 2019 to the unsubsidised electricity tariff for customers with 900-volt-ampere connections, together with an ongoing freeze on most administered energy prices.
FIGURE 3 Inflation Rate (% per annum)
Source: Bank Indonesia through CEIC.
Notes: CPI = consumer price index. The inflation rate is calculated on a year-on-year basis, which involves comparing the CPI in each month with the CPI in the same month of the prior year.
Bank Indonesia cut its benchmark interest rate—the seven-day reverse repo rate—by 0.25 percentage points in July, August and September 2019, after having maintained this rate at 6% throughout the first half of 2019. Low inflation expectations and a desire to boost economic growth in light of a slowing global economy were cited as motivations for the cuts (Bank Indonesia Citation2019). Interest rate reductions have also been seen in other East Asian countries, including Malaysia, South Korea, the Philippines and Thailand. At Bank Indonesia’s September meeting, the bank also announced an easing of macroprudential policy in order to stimulate lending, with changes that include a reduction in the down payment requirements for house and vehicle purchases. Macroprudential policy has been central to efforts to maintain financial system stability (Warjiyo Citation2017), so this round of easing brings risks.
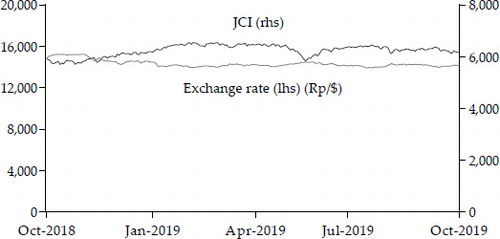
The rupiah reached its weakest level against the dollar on 11 October 2018, at Rp 15,253 per dollar. Its previously depreciating trend was reversed during subsequent months, with the rupiah trading at Rp 14,100 per dollar by the end of January 2019 (). Strong portfolio inflows have been cited as a primary reason for the currency’s appreciation (World Bank Citation2019a). At the end of September 2019, the rupiah was trading at about Rp 14,200 per dollar. For Indonesia’s stock market, the first three-quarters of 2019 were disappointing, with the Jakarta composite index (JCI) down 0.4% at the end of September. The JCI remained 8% below its February 2018 peak.
FIGURE 4 Jakarta Stock Exchange Composite Index (JCI) and Exchange Rate
Sources: Bank Indonesia and Indonesia Stock Exchange through CEIC.
Balance of Payments
Goods exports were down by 7.7% in nominal dollar terms in the first half of 2019 relative to the first half of 2018 (), with the value of oil and gas exports down by more than 31% on account of both a quantity decline and lower prices. The value of copper exports decreased by more than three-quarters because of lower output from the Grasberg mine, together with a lower copper price. The value of services exports increased slightly (0.9%). Indonesia’s goods imports were 6.5% lower in the first half of 2019 than in the same period a year earlier, in nominal dollar terms. The overall current account deficit widened, reaching 2.8% of GDP during the first half of 2019 and 3.1% over the year to June.
Table 2. Balance of Payments ($ billion per quarter)
The final quarter of 2018 and the first half of 2019 saw a return to strong net portfolio investment inflows after the net outflows witnessed during the first three-quarters of 2018. Indonesia received $5.4 billion in net foreign direct investment and $4.5 billion in net portfolio investment in the June quarter. Foreign reserves were $123.8 billion as of June 2019, almost unchanged from the level recorded two years earlier. These reserves are sufficient to finance about seven months of imports—well above the traditional rule of thumb of a minimum of three months. Macroeconomic commentators in Indonesia often express concern about the current account deficit, fearing that investors may suddenly shift funds out of the country. The president even labelled the current account deficit Indonesia’s leading economic problem (Patria, Tehusijarana and Ghaliya Citation2019). The heightened focus on this issue is misplaced. If investors were to move some funds out of Indonesia because of concerns about the current account deficit, this would place downward pressure on the exchange rate, providing a boost to exports vis-à-vis imports—which would work to reduce the size of the current account deficit. A floating exchange rate thus allows correction of the issue that had caused the initial concern. It seems that more confidence is needed in the role of Indonesia’s variable exchange rate.
Indonesia’s current account deficit—and financial account surplus—reflects the fact that resources are entering the country to underpin current and future economic production, through net investment inflows. This is not an undesirable state of affairs. Policies that seek to target a reduction in the current account deficit—for example, by discouraging imports—have economic costs that are important to consider. While Indonesia’s experience with the AFC provides a salient reminder of the risks of short-term episodes of capital flight, these risks—and the implications of them—can be greatly reduced by maintaining a stable and attractive investment environment, as well as adequate crisis response capabilities.
National Budget
The proposed national budget for 2020 is based on a real economic growth assumption of 5.3%, which looks overly ambitious given the current global economic headwinds. The World Bank (Citation2019c) expects that Indonesia’s economic growth rate will be closer to 4.9% in 2020. The proposed budget foresees tax collections increasing by 4.2% relative to the 2019 level (), although non-tax revenue is expected to decline because of reductions in the expected lift rates of oil and natural gas and restrained prices for these commodities. Expenditure on infrastructure by the central government is planned to increase by only 1.0% in 2020 relative to the revised budget for 2019, which is below the rate of inflation. Expenditure on education is planned to rise by 2.7%, and on health by 7.4%. The overall budget deficit is expected to remain at 1.8% of GDP, easily within the legislated limit of 3.0%.
Table 3. Budgets for 2018, 2019 and 2020 (Rp trillion)
Indonesia has had substantial success in reducing energy subsidies (G20 2019), which peaked at Rp 341.8 trillion in 2014. However, at a budgeted Rp 160 trillion in 2019 these subsidies remain sizeable. Subsidies for fuel use—now mostly going to liquefied petroleum gas (LPG)—are expected to shrink in 2020, with spending on electricity subsidies increasing slightly. The ongoing reorientation towards direct forms of social assistance is set to continue, with social assistance spending proposed to increase by 5.5% in 2020, after a 21% increase in 2019 (based on the revised budget). However, Indonesia’s social assistance spending remains low as a share of GDP, at about 0.7% in the 2019 revised budget (up from 0.6% in 2018). A key factor limiting the ability of Indonesia to make progress on a socially inclusive ‘no one left behind’ agenda is its low level of government revenue. Excluding overseas grants, central government revenue equalled only 12.2% of GDP in 2017 (World Bank Citation2019b), among the lowest in the world. The IMF (2019) concluded that low tax revenues present one of Indonesia’s most pressing structural weaknesses and recommended a medium-term revenue strategy to boost collections.
RESIDENTIAL ACCESS TO MODERN ENERGY
One of the requisites for success in a ‘no one left behind’ agenda is achieving broad access to modern energy sources. In this section, we review progress in expanding residential access to both electricity and clean cooking sources. The focus is on household access issues; Burke et al. (Citation2019) provide a recent update on policy options for bringing more solar and wind power into Indonesia’s electricity supply.
Electricity
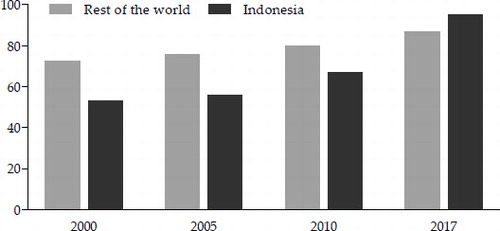
Indonesia has made impressive progress in broadening residential electricity access. At the turn of the century, only about half the population had residential access to electricity—well below the rate for the rest of the world (IEA 2018). This had increased to 95% by 2017 (), a remarkable achievement. Progress has continued, with data from the Ministry of Energy and Mineral Resources (Citation2019) indicating that Indonesia had reached a household electrification rate of 98.8% by June 2019.Footnote6 The number of residential electricity customers of the state electricity company, PLN, has risen quickly and had reached 66 million by 2018 (PLN Citation2018). About 3.5% of households have a non-PLN connection, according to the ministry’s official numbers, and about 0.4% have off-grid electricity access. The province with the lowest overall household electrification rate is East Nusa Tenggara (72%).
FIGURE 5 Household Access to Electricity (% of population)
Sources: IEA (2018). Population data from World Bank (Citation2019b) were used in the calculations.
The headline numbers hide much of the story, however. Households with broken connections or systems are included in the electricity-access count. Furthermore, many households consume only a small quantity of electricity; among customers of PLN, the average residence in East Nusa Tenggara (the province with the lowest average residential electricity consumption) consumed only 831 kilowatt hours (kWh) in 2018, less than half the national average. Electricity outages also remain a serious issue, especially outside Java. PLN’s customers in South Sumatra, Jambi and Bengkulu on average experienced 34 outages in 2018 (PLN Citation2018). Even Jakarta and neighbouring provinces face ongoing challenges in terms of a secure electricity supply, with the region experiencing a major blackout on 4 August 2019 that was the worst since 1997 (Sulaiman Citation2019). The president visited PLN the next day, publicly admonishing the utility for the failure, caused by a technical fault in Central Java. Off-grid access to electricity in some remote areas typically consists of a small solar panel and battery pack, providing enough electricity to power lamps and charge mobile phones. This is better than nothing, but not enough to power a modern life. The key current initiative for off-grid access is the government’s solar-powered energy-saving lamps (LTSHE) scheme, which provides solar kits for remote villages. A large number of mini-grids are also in operation in Indonesia; for example, on small islands.
With household electrification near universal, we suggest that the next challenge is to move ‘beyond electrification’, prioritising improvements in the quantity and quality of available electricity. It would be useful for data on the number of households that exceed a raised threshold of basic electricity access to be recorded, and for targets to be set for achieving universal coverage according to this threshold. Such a threshold could be defined as access to a 900-volt-ampere connection or equivalent, or access to tier-three electricity as specified by the Energy Sector Management Assistance Program (ESMAP 2015) in its framework for evaluating electricity access. Another approach could be to measure basic access by whether households consume more than, say, a minimum of 500 kWh per capita per year. The maintenance of off-grid and mini-grid systems in remote areas has been challenging. The approach of ‘electrify and leave’ does not work well: systems break and the community does not get as much value from electricity as it could (Didik et al. Citation2018). Community involvement and training are parts of the solution and they would, ideally, be incorporated into project design more routinely. There is also scope for greater use of maintenance contracts with the private sector, which would facilitate the development of private-sector supply chains. Ambitious targets calibrated to a new measure of basic electricity access could help to encourage PLN to adopt an increased focus on system upkeep.
Investments in the electricity grid will be needed in coming years in order to reduce supply interruptions and integrate growing contributions from intermittent energy sources, especially solar photovoltaics (an energy technology that has become increasingly cost competitive). Batteries and smart grid technologies are set to play an increasingly important role in electricity supply management. Indonesia is also pursuing the development of pumped-hydro energy storage, although the Upper Cisokan Pumped Storage Plant, a major project in West Java, has faced delays (Burke et al. Citation2019).
Clean Cooking
Residential access to clean cooking technologies and clean fuels is another important consideration. The International Energy Agency defines clean cooking access as cooking that relies primarily on energy sources other than primary biomass, coal and kerosene (IEA 2018). Cooking with electricity, natural gas or LPG exposes households to much lower levels of airborne pollutants than cooking with biomass, coal or kerosene.
Indonesia’s progress on expanding access to clean cooking has been impressive, although there is a long way to go. In 2000, about 88% of Indonesians relied primarily on dirty cooking fuels. By 2017, this had been reduced to about 30% (IEA 2018), with traditional biomass remaining the most-used dirty cooking fuel.Footnote7 Reliance on biomass is particularly high in eastern Indonesia (Kusumawardhani et al. Citation2017).
A major contributor to the expanded access to clean cooking was the national kerosene-to-LPG conversion program launched in 2007. The conversion program distributed more than 57 million LPG stoves and cylinders (Thoday et al. Citation2018), providing a subsidy for the use of LPG from three-kilogram cylinders known as ‘melon’ cylinders on account of their size, shape and green colour. The subsidised price for LPG has remained unadjusted since 2007. When combined with increasing usage, this has led to a growing LPG subsidy bill.
The LPG subsidies do not flow only to those in need. Only about 12% of the benefits of the subsidy flow to the bottom income quintile, for reasons including that LPG canisters are not easily accessible in eastern Indonesia (Kusumawardhani et al. Citation2017). The National Team for the Acceleration of Poverty Reduction found that about 72% of non-poor households accessed subsidised LPG cylinders in 2018, while slightly more than half of poor households accessed them (TNP2K 2018).
There are thus opportunities to improve the targeting of the LPG subsidy. TNP2K is trialling new approaches, with those eligible to receive subsidised cylinders being able to identify themselves using methods such as a text message e-voucher that has been sent out to them. A medium-term option is to phase out LPG subsidies altogether, switching instead to increased use of cash-based assistance. Doing so would be in line with Indonesia’s G20 and Asia-Pacific Economic Cooperation (APEC) commitments to phase out fossil fuel subsidies. A challenge, however, is to minimise the extent to which any reform leads households to switch back to dirty fuels such as biomass and kerosene.
There is currently not much emphasis on clean stove adoption in Indonesia. The Indonesia Clean Stove Initiative (World Bank Citation2013)—a collaboration between the Ministry of Energy and Mineral Resources and the World Bank—was wound down in 2017.Footnote8 Renewed emphasis on clean cooking will be required if Indonesia is to have a chance of achieving SDG 7 on universal access to affordable and clean energy by 2030.
OPPORTUNITIES AND SUPPORT FOR THE DISADVANTAGED
Indonesia’s poverty rate fell to 9.4% in March 2019, from more than 14% a decade earlier (BPS 2019a). However, about one-fifth of Indonesians have expenditure levels that are less than 50% above the poverty line (World Bank Citation2019a). There are also many marginalised people who lack opportunities to participate fully in society. A major development in the past several years has been the expansion of the Hopeful Families Program (PKH). Introduced in 2007, the PKH is a conditional cash transfer program that now targets 10 million families.Footnote9 The PKH budget was increased to Rp 29 trillion ($2 billion) in 2019, up from Rp 19 trillion in 2018. Conditionalities and benefits for the elderly and persons with disability (PWD) were also added for the first time, based on Ministry of Social Affairs Regulation 1/2018. The PKH looks set to form the basis for an expanding social assistance system over time.
To qualify for the PKH, families must have low income (in the bottom 20%) and at least one of the following:
A pregnant woman or a child below age seven
A child at school
A family member who is severely disabled
A family member who is aged 60 or over.
Each recipient family is entitled to a fixed benefit of Rp 1,550,000 per year and an additional Rp 2,400,000 per year for each pregnant woman, child aged below seven, severely disabled person or elderly person in the household. Families are also entitled to Rp 900,000, Rp 1,500,000 and Rp 2,000,000 per year for each child in elementary, junior and senior high school, respectively. These additional benefits are capped at four recipients per family.
In 2018, about 150,000 elderly people (about 6% of this sub-population) and 118,382 people with severe disabilities (3%) were covered by the PKH (TNP2K 2018). These numbers are expected to increase sharply as a result of the 2019 reforms. Indonesia also has a separate social assistance scheme for the elderly (BANTU-LU) as well as a social assistance scheme for persons with disabilities (ASPD). However, these schemes have relatively small coverage.
In the remainder of the Survey, we focus on the status of and recent initiatives for three groups who have members among the more marginalised individuals in society: people with disabilities, the elderly and the unemployed. We note that not all members of each of these groups face relative disadvantage and that there are other key groups—for example, the homeless and the working poor—who face many challenges and who are very worthy of research focus. We also note that we are taking a broad approach to the definition of ‘marginalisation’—one that involves exclusion from various aspects of society, including education and employment. Unlike the standard measure of poverty—which is based on per capita expenditure at the household level—disability, age and employment status are concepts that apply at the individual level. The ‘no one left behind’ agenda clarifies the importance of homing in on disadvantages faced by individuals.
People with Disabilities
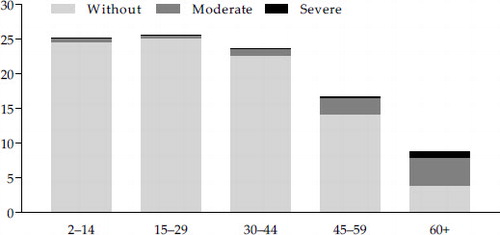
The definition of a PWD under the United Nations’ Convention on the Rights of Persons with Disabilities is someone who has long-term physical, mental, intellectual or sensory impairments that, in interaction with various barriers, may hinder their full and effective participation in society on an equal basis with others. Following this definition and guidance from the Washington Group,Footnote10 the 2015 intercensal population survey (SUPAS; BPS 2016) estimates that about 9% of Indonesians aged two or older have a moderate or severe disability. Disability prevalence is particularly high among those aged 60 or older, with about 12% of this group affected by a severe disability and 45% a moderate disability (). The prevalence of disability is similar for males and females.
FIGURE 6 Disability Prevalence by Age Cohort, 2015 (% of total population aged two or older)
Source: Authors’ calculations using BPS (2016). The five columns sum to 100%.
As in many other countries, institutional, attitudinal and environmental barriers exacerbate the difficulties faced by PWD in Indonesia. Having a disability is associated with lower educational attainment, worse health, fewer economic opportunities and reduced use of public services (Cameron and Contreras Suarez 2017). PWD are more likely to live in poverty. Further, conventional poverty measures tend to underestimate the number of PWD living in poverty by neglecting the need to cover disability-related expenditure (such as medical costs).
Children with disabilities face a number of disadvantages, such as impeded access to education. According to data from the 2018 National Socio-economic Survey (Susenas), only 76% of severely disabled children aged 6–12 attend school, compared with 91% of children without a disability. Only 58% of severely disabled children aged 13–17 attend school. PWD also have lower labour force participation rates: based on the August 2017 National Labour Force Survey (Sakernas), the labour force participation rate was 69% for people without a disability, 52% for people with a mild disability and only 14% for people with a severe disability. Having a disabled member of the family is also known to adversely affect the labour force participation of other members of the family (Mitra, Posarac and Vick Citation2013).
Law 8/2016 on Persons (or People) with Disabilities provides a legal framework for the inclusion of PWD in all aspects of life related to social welfare (articles 17 and 90–96), to living independently and being included in the community (article 23), to concessional benefits (articles 114–16) and to women and children (articles 5 and 126) (Larasati et al. Citation2019). Disability issues are thus considered distinct from poverty issues. Nevertheless, there is a large gap between what is required under the law and what has been achieved in reality. An example is the challenges that PWD face in the labour market. Law 8/2016, article 11, mandates that PWD have equal rights to obtain decent work, while article 53 mandates that at least 2% of employees of each public sector entity and 1% of employees of each private sector entity should be PWD. There is, however, no formal procedure for implementing these requirements.
There are many potential approaches for reducing disadvantages faced by PWD. Reducing stigma, including self-stigma, is a large challenge (Hastuti, Pramana and Sadaly Citation2019). There is scope to increase the availability of PWD-friendly infrastructure, as well as provisions such as hearing aids and sign language translators. Disability issues are cross-sectoral, so prioritisation by ministries across the economic, health, education and culture portfolios, among others, is important.
Most of the severely disabled in Indonesia do not benefit from disability-focused social assistance schemes, with Indonesia lagging behind countries such as Vietnam and Nepal (Larasati et al. Citation2019). The 2019 expansion of the PKH is an important step towards broader coverage. An issue, however, is that the severely disabled do not receive PKH support if their family income exceeds the threshold level for the scheme, even though their situation may be dire. There is also debate over whether additional PKH funds for the severely disabled do enough to help to increase the autonomy of PWD, given that the funds are transferred to the family rather than directly to the person with the disability. Over time, a broader support system focused on vulnerable PWD could be introduced.
The Elderly
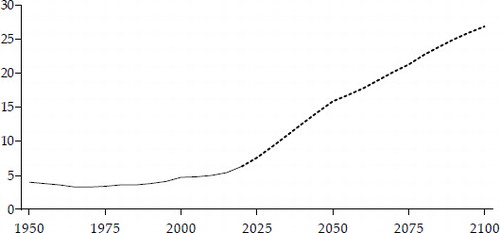
Indonesia’s population is ageing. Currently, about 6% of the population is aged 65 or older. In the ‘medium fertility’ variant of the United Nations’ (2019) population projections, this share is estimated to increase to about 9% by 2030 and 27% by 2100 (). Under current settings, the elderly are much more likely to be poor or near poor. The national poverty rate for people aged 65 or older is 14.7%, with about 80% of people in this age range living in households with per capita consumption below Rp 50,000 (less than $4) a day (TNP2K 2018).Footnote11
FIGURE 7 Share of Indonesia’s Population Aged 65 or Older (%)
Source: United Nations (Citation2019).
Note: The solid line represents the estimated historical share; the dashed line represents the projected share in the medium-fertility variant of the projections of the United Nations (Citation2019).
Indonesia is quite poorly prepared for an ageing population. Currently, only a small fraction of the elderly, mostly former government employees, have access to pension schemes. TNP2K (2018) documented that in 2017 there were 2.5 million retired civil servant pensioners who had access to a contributory pension scheme for civil servants through the state-owned enterprise PT TASPEN. There were also 0.9 million pensioners who were retirees from the military, police or Ministry of Defence. Poor and vulnerable elderly people can access the Premiums Assistance Recipient (PBI) program through the National Health Insurance (JKN) scheme. Many older Indonesians—about 40% of people aged 65 or older (6 million people)— are still working, according to the 2018 Susenas. Many of these people—about 62%—work in the agricultural sector, with generally low and insecure earnings.
Progress towards policies that are inclusive of the elderly has included overturning Law 4/1965 on Social Assistance for the Elderly and replacing it with Law 13/1998 on Elderly Welfare, a change that provided the framework for facilitating fuller participation of older persons in society. Under the 1998 law, an elderly person is defined as anyone aged 60 or older. The National Medium-Term Development Plan for 2015–19 targets increased provision of basic services for the elderly, including infrastructure.
There have been some initiatives for the elderly at the local level. The most notable example is a grant program for the elderly in Aceh Jaya district known as the High-Risk Elderly Social Assistance (ASLURETI) pension (MAHKOTA 2017). Introduced in 2012, the grant is motivated by the philosophy that the elderly are among the most vulnerable in the community and are entitled to a dignified life. Initially, ASLURETI was designed to protect persons aged 60 or older, but the age cut-off was increased to 70 because of fiscal constraints. By 2016, the program had 2,709 beneficiaries. An evaluation by MAHKOTA (2017) showed that the grant benefitted not only the recipients but also their families and communities. It was found that ASLURETI recipients mostly spent the money on food, health care and the school expenses of their grandchildren. About 75% of recipients said they accessed health services more frequently because of the pension and about 81% went from being financially dependent on family to contributing to household income. Of the 40% who were still working at the time of the evaluation, many reported being able to shift into less strenuous jobs, such as operating shops from their homes. Jakarta introduced a similar program in April 2018.
There is the potential for Indonesia to move towards a more comprehensive system of retirement pensions for the elderly. TNP2K (2018) explored a three-tiered approach that follows international best practice: (1) providing non-contributory grants to elderly people who are without access to old-age insurance or pensions; (2) enhancing publicly managed pension schemes; (3) developing contributory private pension schemes for people who can afford to make direct contributions. Providing non-contributory grants to the elderly (the first tier) would come at a fiscal cost, although this could be manageable. TNP2K (2018) calculated that a grant of Rp 300,000 per month to every Indonesian aged 70 or older without a pension would involve a fiscal cost equal to only 0.2% of GDP. The report also concluded that this type of approach would be able to help reduce the overall rate of poverty. Many countries, such as Nepal, have introduced social support schemes for the elderly despite having lower GDP per capita levels than Indonesia’s current level (Kidd et al. Citation2018).
The Unemployed
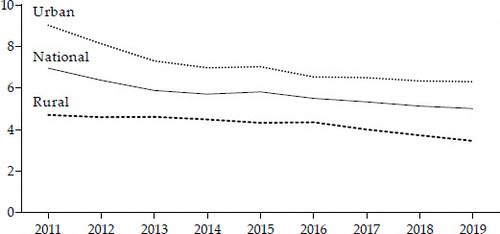
People are classed as unemployed if they did not work for pay or assist others in obtaining pay or profit for at least one hour during the survey week, and either have actively looked for a job in the previous month or have not been actively seeking work because they do not expect to get it. In February 2019, Indonesia’s unemployment rate among those aged 15 or over was down to 5.0%, equal to 6.8 million people (). The rate is higher in urban areas than in rural areas. Those with either a general or vocational high school education have an unemployment rate of 7.5%, whereas those with no or little education have a low unemployment rate (0.9%), as they typically cannot get by without some type of work. A sizeable proportion of the unemployed are thus individuals who are not members of the lowest-income families. Nevertheless, unemployment brings a level of disconnection from society and a depreciation of skills. As of February 2019, the youth (aged 15–24) unemployment rate was high, at 15.4%.
FIGURE 8 Unemployment Rate, 2011–19 (%)
Source: BPS (2019b). Measured in February each year to remove seasonal influences and because the August 2019 data were not available at the time of writing.
Of the 129 million employed people in Indonesia as of February 2019, close to 30 million (29%) were part-time employees who were working less than 35 hours per week and did not intend to work more hours. Another 9.5% were ‘underemployed’, defined as working less than 35 hours per week but willing to work more. Of the underemployed workers, 42.5%—about 4 million people—were living in rural areas and had only elementary education.
Indonesia’s labour market policies create significant obstacles to job creation in the modern sectors of the economy. A major structural constraint is the complex system of rules under Law 13/2003 on Manpower concerning the hiring and firing of permanent employees. This law stipulates four types of compensation for permanent employees upon termination of their employment agreements: severance payments; long-service pay; benefits payouts; and voluntary separation payouts (Allen Citation2018). The World Bank (Citation2019d) lists Indonesia as having among the highest severance pay requirements in the world, including 17 weeks of pay for workers made redundant after only a year of tenure.
Although rates of compliance with the severance pay legislation have been found to be low (World Bank Citation2010), the effect of the manpower law is almost certain to be that fewer permanent jobs are created in the formal sectors of the economy, as a result of the costs imposed on employers and potential employers. Many employees are instead engaged through fixed-term contracts or informally (Purnagunawan, Pratomo and Suryadarma Citation2017), despite other restrictions on the use and extension of employment contracts and on outsourcing.
Proponents of the existing arrangements sometimes claim that the arrangements give employees higher bargaining power. However, only 9% of employed people in Indonesia are on permanent contracts, according to the Sakernas survey of August 2018, so most workers do not receive any benefit in the form of severance pay. Strong demand for labour resulting from a rapidly growing economy, competitive market conditions and reduced constraints on the employment of labour would do much more to raise the overall bargaining power of labour. It is also sometimes said that the costs of firing workers under the manpower law lead to longer employment, which encourages employers to invest in firm-specific human capital. Yet only a small share of firms in Indonesia offer formal training to their employees (Manning and Pratomo Citation2018).
Although opposition from politically well-connected unions is likely to continue to pose an obstacle, the president has expressed a desire to ease over-restrictive labour regulations. He has indicated an intention to limit changes to new rather than existing employees in order to minimise opposition to the change (Salna and Rahadiana Citation2019). The proposed reform is motivated in part by frustration that more manufacturing firms are not choosing to invest in Indonesia, even after the United States imposed tariffs on exports from China. The Indonesian government is also proposing a doubling of the tax-deduction allowance for businesses that invest in vocational training.
Another proposed initiative is the introduction of pre-employment cards (Program Kartu Pra-Kerja) to fund short-term vocational training for job seekers and perhaps also a short-term job-search allowance. The idea follows numerous other initiatives that have sought to boost labour-market-relevant skills in Indonesia. The government has projected that as many as two million people would receive the card, with Rp 10.3 trillion ($726 million) allocated in the proposed 2020 budget. Initial indications suggest that about one million people would receive digital training and the remainder would receive training in other vocational skills. The idea is still being developed and may take longer to implement than planned. Key issues include whether Indonesia’s institutional architecture is ready to administer the scheme, whether adequate-quality training will be provided and whether the vocational skills could be productively applied in the workforce.
No One Left Behind?
Considerable progress has been made in moving to near-universal residential access to electricity in most of Indonesia, although sizeable energy access challenges remain, especially in remote regions. Indonesia has also begun to tackle some of the more challenging issues facing disadvantaged groups hitherto largely neglected by public policy. Most notably, the first steps have been taken to establish a broader social safety net—including for the disabled, the elderly and the unemployed. The government has given a degree of priority to the SDGs, including by linking SDG targets and indicators to the national mid-term development plan for 2015–19 and through the president’s ‘no one left behind’ focus. Unfortunately, Indonesia’s fiscal capacity remains small, and scarce resources are proposed to be diverted to an expensive plan to build a remote new national capital.
There is scope for research into what is and is not working in broadening the inclusiveness of Indonesia’s economic development. For example, future evaluations of the effectiveness and impacts of the 2019 reforms to the PKH may be useful for informing policy design in both Indonesia and other countries. An issue of particular interest is the effect of PKH disability-support payments on the labour force participation of both PWD and other members of their families. If the preemployment card scheme goes ahead, future evaluations will also be important for identifying whether this type of approach can make a tangible contribution to improving productivity and reducing unemployment.
Notes
1 The KIK consists of the Indonesian Democratic Party of Struggle (PDIP), United Development Party (PPP), National Awakening Party (PKB), Functional Groups Party (Golkar), National Democrats (Nasdem), Indonesian Solidarity Party (PSI), United Indonesia Party (Perindo), Indonesian Justice and Unity Party (PKPI), People’s Conscience Party (Hanura) and Crescent Star Party (PBB).
2 The United Nations adopted the SDGs in 2015. In Indonesia, Presidential Decree 59/2017 established a national SDG governance structure and the mechanisms for plan- ning, budgeting and financing of strategies to achieve the SDGs, together with monitoring and reporting frameworks.
1 The life expectancy penalties associated with excessive PM2.5 levels are larger still in China (three years) and India (four years).
2 Calculated based on daily AQI data. Historical data are available for some cities only.
3 The same is true for growth in GDP per capita. With population growth at 1.1% per annum, Indonesia’s real GDP per capita growth rate is 3.9% per annum. Note that GDP measures do not directly account for depletion of natural capital stocks or the costs of pollution.
4 Indonesia has a relatively low Herfindahl index (0.39) across value added in the agricul- ture, services and industry sectors, according to data for 2018 from the World Bank (Citation2019a), with 85% of countries for which data are available having less diversified economies accord- ing to this measure.
5 Imports plus exports equalled 43% of GDP in Indonesia in 2018, lower than the overall ratio of 51% for middle-income economies (World Bank Citation2019a). Countries with larger popu- lations tend to have lower trade ratios. The point is not that low trade exposure is desirable; greater trade exposure might well have increased Indonesia’s average rate of GDP growth. However, low trade shares reduce exposure to international shocks.
6 The IEA data are reported as a share of the population, while the Ministry of Energy and Mineral Resources data are reported as a share of households.
7 IEA (2018) data for 2017 are modelled estimates based on household survey data.
8 The Indonesian Domestic Biogas Programme (http://www.biru.or.id) is an example of a relevant initiative.
9 Targeting is aided by the use of TNP2K’s Unified Database (Booth, Purnagunawan and Satriawan Citation2019).
10 The Washington Group on Disability Statistics is a voluntary working group established under the United Nations Statistical Division.
11 TNP2K (2018) used Susenas 2017. Susenas 2018 provides a similar result. Note that this measure is based on consumption rather than income, so it incorporates the effects of accumulated assets on the current ability to consume.
Related Research Data
REFERENCES
- Allen, Emma. 2018. ‘Labor Market Policies and Institutions in Indonesia’. In Indonesia: Enhancing Productivity through Quality Jobs, edited by Edimon Ginting, Christopher Manning and Kiyoshi Taniguchi. Manila: Asian Development Bank (ADB).
- Andapita, Vela. 2019. ‘Residents to Sue Govt over Air Pollution’. Jakarta Post, 4 June. https://www.thejakartapost.com/news/2019/06/04/residents-sue-govt-over-air-pollution.html.
- Atika, Sausan. 2019a. ‘Govt Warned of Huge Impact of Sea Dike’. Jakarta Post, 23 July. https://www.thejakartapost.com/news/2019/07/23/govt-warned-huge-impact-sea-dike.html.
- Atika, Sausan. 2019b. ‘Jakarta’s 120-km Coastal Protection Races against Time’. Jakarta Post, 17 September. https://www.thejakartapost.com/news/2019/09/17/jakarta-s-120-km-coastal-protection-races-against-time.html.
- Babe, Ann. 2019. ‘South Korea’s Master-planned City Draws Criticism’, U.S. News & World Report, 4 June. https://www.usnews.com/news/cities/articles/2019-06-04/sejong-south-koreas-new-administrative-capital-city-draws-critics.
- Bank Indonesia. 2019. ‘BI 7-Day Reverse Repo Rate Lowered 25 bps to 5,25%: Driving Growth Momentum, Maintaining External Stability’. Press release no. 21/68/DKom, 19 September. https://www.bi.go.id/en/ruang-media/siaran-pers/Pages/SP_216819.aspx.
- Bappenas (National Development Planning Agency). 2019. Pemindahan Ibu Kota Negara [Transfer of the national capital], 16 May, Jakarta.
- Booth, Anne, Raden Muhamad Purnagunawan and Elan Satriawan. 2019. ‘Towards a Healthy Indonesia?’ Bulletin of Indonesian Economic Studies 55 (2): 133–55. doi: 10.1080/00074918.2019.1639509
- BPS (Statistics Indonesia). 2016. ‘Indonesia - Survei Penduduk Antar Sensus 2015’. https://mikrodata.bps.go.id/mikrodata/index.php/catalog/714.
- BPS (Statistics Indonesia). 2019a. ‘Percentage of Poor People 2007–2019’. Accessed 20 July 2019. https://www.bps.go.id/dynamictable/2016/08/18/1219/persentase-penduduk-mis-kin-menurut-provinsi-2007---2018.html.
- BPS (Statistics Indonesia). 2019b. ‘Indikator Pasar Tenaga Kerja Indonesia Februari 2019’ [Labor market indicators, Indonesia, February 2019]. Accessed 10 August 2019. https://www.bps.go.id/publication/2019/06/14/2647df94a2a708b1976d4383/indikator-pasar-tenaga-kerja-indonesia-februari-2019.html. Earlier releases were also accessed.
- Burke, Paul J. 2012. ‘Economic Growth and Political Survival’. B.E. Journal of Macroeconomics 12 (1): 1–43. doi: 10.1515/1935-1690.2398
- Burke, Paul J., Jinnie Widnyana, Zeba Anjum, Emma Aisbett, Budy Resosudarmo and Kenneth G.H. Baldwin. 2019. ‘Overcoming Barriers to Solar and Wind Energy Adoption in Two Asian Giants: India and Indonesia’. Energy Policy 132 (September): 1216–28. doi: 10.1016/j.enpol.2019.05.055
- Cameron, Lisa and Diana Contreras Suarez. 2017. Disability in Indonesia: What Can We Learn from the Data? Canberra: Australia Indonesia Partnership for Economic Governance.
- Campante, Filipe R., Quoc-Anh Do and Bernardo Guimaraes. 2019. ‘Capital Cities, Conflict, and Misgovernance’. American Economic Journal: Applied Economics 11 (3): 298–337.
- Didik, H., P.N. Bambang, S. Asep. and Y.A. Purwanto. 2018. ‘Sustainability Challenge of Micro Hydro Power Development in Indonesia’. IOP Conference Series: Earth and Environmental Science 147: 012031. doi: 10.1088/1755-1315/147/1/012031
- Erkens, G., T. Bucx, R. Dam, G. de Lange and J. Lambert. 2015. ‘Sinking Coastal Cities’. Proceedings of the International Association of Hydrological Sciences 372: 189–98. doi: 10.5194/piahs-372-189-2015
- ESMAP (Energy Sector Management Assistance Program). 2015. Beyond Connections: Energy Access Redefined. Technical Report 008/15. Washington, DC: World Bank.
- G20 (Group of Twenty). 2019. Indonesia’s Effort to Phase Out and Rationalise its Fossil-fuel Subsidies: A Report on the G20 Peer-review of Inefficient Fossil-fuel Subsidies that Encourage Wasteful Consumption in Indonesia. April, OECD.
- Greenstone, Michael and Qing (Claire) Fan. 2019. Indonesia’s Worsening Air Quality and Its Impact on Life Expectancy. Chicago: Air Quality Life Index. https://aqli.epic.uchicago.edu/wp-content/uploads/2019/03/Indonesia-Report.pdf.
- Hastuti, Rika Kumala Dewi, Rezanti Putri Pramana and Hariyanti Sadaly. 2019. ‘Kendala Mewujudkan Pembangunan Inklusif Terhadap Penyandang Disabilitas’ [Constraints to realising inclusive development of persons with disabilities]. Working paper, SMERU Research Institute, Jakarta.
- Hellenic Shipping News. 2019. ‘Indonesia’s Apr LNG Exports Dive 50% from Mar, Crude Rises 35%’. 23 June. https://www.hellenicshippingnews.com/indonesias-apr-lng-exports-dive-50-from-mar-crude-rises-35.
- IEA (International Energy Agency). 2018. World Energy Outlook 2018. Paris: IEA.
- IMF (International Monetary Fund). 2019. 2019 Article IV Consultation. IMF Country Report No. 19/250. Washington, DC: IMF.
- Jakarta Globe. 2019. ‘Jokowi Finalizes New Cabinet Ahead of Second Term’. 14 August. https://jakartaglobe.id/context/jokowi-finalizes-new-cabinet-ahead-of-second-term.
- Jong, Hans Nicholas. 2019. ‘Indonesia’s President Signals a Transition away from Coal Power’. Mongabay, 16 July. https://news.mongabay.com/2019/07/indonesias-president-signals-a-transition-away-from-coal-power/.
- Jordan, Ray. 2019. ‘Usulkan Konsep IDEA Hub di KTT G20, Jokowi: No One Left Behind’ [IDEA Hub concept proposed at the G20 Summit, Jokowi: no one left behind]. Detik, 28 June. https://news.detik.com/berita/d-4604220/usulkan-konsep-idea-hub-di-ktt-g20-jokowi-no-one-left-behind.
- Kidd, Stephen, Bjorn Gelders, Sri Kusumastuti Rahayu, Dyah Larasati, Karishma Huda and Martin Siyaranamual. 2018. Policy Brief: Implementing Social Protection for the Elderly in Indonesia. Jakarta: National Team for the Acceleration of Poverty Reduction (TNP2K).
- Kurniawan, Ruly. 2019. ‘Mulai Tahun Ini, Perpanjang STNK Harus Lulus Uji Emisi’ [Starting this year, STNK extensions must pass emissions test]. Kompas, 14 July. https://otomotif.kompas. com/read/2019/07/14/114200715/mulai-tahun-ini-perpanjang-stnk-harus-lulus-uji-emisi.
- Kusumawardhani, Niken, Rafiazka Hilman, Tara Laan, Nila Warda and Rachma Nurbani. 2017. Gender and Fossil Fuel Subsidy Reform: An Audit of Data on Energy Subsidies, Energy Use and Gender in Indonesia. Winnipeg: International Institute for Sustainable Development (IISD). https://www.iisd.org/sites/default/files/publications/gender-fossil-fuel-subsidy-reform-indonesia.pdf.
- Larasati, Dyah, Karishma Huda, Alexandre Cote, Sri Kusumastuti Rahayu and Martin Siyaranamual. 2019. Policy Brief: Inclusive Social Protection for Persons with Disability in Indonesia. Jakarta: National Team for the Acceleration of Poverty Reduction (TNP2K). http://www.tnp2k.go.id/download/65217190113-PB%20DisabilitiesEng-web.pdf.
- MAHKOTA (Towards a Strong and Prosperous Indonesian Society). 2017. Cash Transfers for the Elderly to Address Poverty and Stimulate Economic Growth: An Evaluation of Aceh Jaya’s Old-age Cash Transfer. Jakarta: MAHKOTA. http://www.tnp2k.go.id/images/uploads/downloads/ASLURETI%20Summary_english_FINAL.pdf.
- Manning, Chris and Devanto Pratomo. 2018. ‘Labour Market Developments in the Jokowi Years’. Journal of Southeast Asian Economies 35 (2): 165–84. doi: 10.1355/ae35-2d
- Ministry of Energy and Mineral Resources. 2019. ‘Update Informasi Sub Sektor Ketenagalistrikan’ [Electricity sub-sector information update]. PowerPoint presentation, Jakarta, 2 July. https://www.esdm.go.id/assets/media/content/content-media-gathering-dirjen-gatrik-update-informasi-sub-sektor-ketenagalistrikan.pdf.
- Mitra, Sophie, Aleksandra Posarac and Brandon Vick. 2013. ‘Disability and Poverty in Developing Countries: A Multidimensional Study’. World Development 41 (January): 1–18. doi: 10.1016/j.worlddev.2012.05.024
- OECD (Organisation for Economic Co-operation and Development). 2019. OECD Green Growth Policy Review of Indonesia 2019. OECD Environmental Performance Reviews. Paris: OECD Publishing.
- Patria, Nezar, Karina M. Tehusijarana and Ghina Ghaliya. 2019. ‘New Cabinet: Fresh Effort to Boost Economy’. Jakarta Post, 15 August. https://www.thejakartapost.com/news/2019/08/14/new-cabinet-fresh-effort-to-jack-up-economy.html.
- PLN. 2018. PLN Statistics 2018. Jakarta: PT PLN (Persero). https://www.pln.co.id/statics/uploads/2019/07/STATISTICS-English-26.7.19.pdf.
- Purnagunawan, Muhammad, Devanto Shasta Pratomo and Daniel Suryadarma. 2017. ‘Labour Market and Firm Competitiveness in Indonesia: Issues and Challenges’. In The Indonesian Economy: Trade and Industrial Policies, edited by Lili Yan Ing, Gordon H. Hanson and Sri Mulyani Indrawati. London: Routledge.
- Resosudarmo, Budy P. and Abdurohman 2018. ‘Is Being Stuck with a Five Percent Growth Rate a New Normal for Indonesia?’ Bulletin of Indonesian Economic Studies 54 (2): 141–64. doi: 10.1080/00074918.2018.1521776
- Salna, Karlis and Rieka Rahadiana. 2019. ‘Indonesia Will Open Up to More Foreign Investment, Jokowi Says’. Bloomberg, 3 October. https://www.bloomberg.com/news/articles/2019-10-02/jokowi-promises-to-make-new-labor-investment-rules-a-reality.
- SMM News. 2019. ‘Copper Production across 20 Global Miners Dips 0.2% in 1H19’. 4 September. https://news.metal.com/newscontent/100969149/copper-production-across-20-global-miners-dips-02-in-1h19/
- Steger, Isabella and Sookyoung Lee. 2018. ‘A New Capital Built from Scratch is an Unlikely Utopia for Korean Families’. Quartz, 20 June. https://qz.com/1275754/a-new-capital-built-from-scratch-is-an-unlikely-utopia-for-korean-families.
- Sulaiman, Stefanno Reinard. 2019. ‘Power Expected to Return before Midnight after Major Hours-long Blackout: PLN’. Jakarta Post, 4 August. https://www.thejakartapost.com/news/2019/08/04/power-expected-to-return-before-midnight-after-major-hours-long-blackout-pln.html.
- Thoday, Katharine, Precious Benjamin, Meixi Gan and Eliza Puzzolo. 2018. ‘The Mega Conversion Program from Kerosene to LPG in Indonesia: Lessons Learned and Recommendations for Future Clean Cooking Energy Expansion’. Energy for Sustainable Development 46 (October): 71–81. doi: 10.1016/j.esd.2018.05.011
- TNP2K (National Team for the Acceleration of Poverty Reduction). 2018. The Future of The Social Protection System in Indonesia: Social Protection for All. Jakarta: TNP2K.
- Umam, Ahmad Khoirul, Gillian Whitehouse, Brian Head and Mohammed Adil Khan. 2018. ‘Addressing Corruption in Post-Soeharto Indonesia: The Role of the Corruption Eradication Commission’. Journal of Contemporary Asia. Published ahead of print, 14 December: 1–19. https://doi.org/10.1080/00472336.2018.1552983.
- United Nations. 2019. ‘World Population Prospects 2019’. Department of Economic and Social Affairs (DESA)/Population Division. Accessed 9 July 2019. https://population.un.org/wpp.
- Warburton, Eve. 2018. ‘A New Developmentalism in Indonesia?’ Journal of Southeast Asian Economies 35 (3): 355–68. doi: 10.1355/ae35-3c
- Warjiyo, Perry. 2017. ‘Indonesia: The Macroprudential Framework and the Central Bank’s Policy Mix’. In ‘Macroprudential Frameworks, Implementation and Relationship with Other Policies’. BIS Papers 94 (December): 189–205. https://www.bis.org/publ/bppdf/bispap94.pdf.
- World Air Quality Index. 2019. ‘Jakarta Central (US Consulate) Air Pollution: Real-time Air Quality Index (AQI)’. Accessed 1 October 2019. http://aqicn.org/city/indonesia/jakarta/us-consulate/central.
- World Bank. 2010. Indonesia Jobs Report: Towards Better Jobs and Security for All. Jakarta.
- World Bank. 2013. Indonesia: Toward Universal Access to Clean Cooking. East Asia and Pacific Clean Stove Initiative Series. Washington, DC: World Bank.
- World Bank. 2019a. Indonesia Economic Quarterly: Oceans of Opportunity. Jakarta: Washington, DC, June.
- World Bank. 2019b. ‘World Development Indicators’. Data Catalog. http://data.worldbank. org/data-catalog/world-development-indicators.
- World Bank. 2019c. ‘Global Economic Risks and Implications for Indonesia’, Presentation. Jakarta, September.
- World Bank. 2019d. ‘Doing Business 2019: Training for Reform’. Doing Business: Measuring Business Regulations. https://www.doingbusiness.org/en/doingbusiness.
- Zhang, Xin, Xi Chen and Xiaobo Zhang. 2018. ‘The Impact of Exposure to Air Pollution on Cognitive Performance’. Proceedings of the National Academy of Sciences 115 (37): 9193–7. doi: 10.1073/pnas.1809474115