
Abstract
There are various studies on the relationship between law enforcement and tax compliance; however, a study that empirically examines the relationship between law enforcement and tax compliance within an actual tax administration’s strategy map is lacking in the literature. We examine an identified knowledge gap about whether, and precisely how effectively, law enforcement may impact tax compliance in Indonesia. Investigating administrative data from all 352 tax offices across Indonesia, we reveal two principal findings. First, that law enforcement appears to have a discernible impact on tax compliance. Second, that while audit coverage ratio has played a vital role in improving tax compliance, criminal investigation appears to be an influential factor in determining the effectiveness of law enforcement. We conclude that law enforcement is an important aspect of tax administration, and that better law enforcement would help the Indonesian tax authority improve tax compliance and raise revenue.
INTRODUCTION
No matter how good a tax policy is, if it cannot be implemented effectively it is futile (Bird Citation2008). The main purpose of this paper is to investigate the extent to which law enforcement activities are capable of increasing tax compliance in Indonesia from the viewpoint of tax authorities. This question is an important one because tax policy and tax administration interact at three separate levels: (i) policy formulation and legislation, (ii) the administrative and institutional procedures required to implement these laws and regulations and (iii) the actual implementation of the tax system (Bird Citation2004). For this reason, tax policy formulation must consider the institutional dimension of the tax system (Bird Citation2004).
Tax authorities must operate effectively and efficiently to maintain an equitable and economically viable tax regime (Klun Citation2004). This is because, while tax policy and legislation will increase the opportunity for additional tax revenue collection, the actual number of tax receipts that can be collected is largely dependent on the effectiveness and efficiency of tax administration (Gill Citation2003).
Unfortunately, managing tax administration is challenging (Bird Citation2003). Not only is good tax administration highly dependent on the internal capabilities of the organisation and the actions (and reactions) of individuals and the public, but also intertwined with the complex interactions between various environmental factors (OECD 2014; Rosid, Evans and Tran-Nam Citation2016; Umar and Tusubira Citation2017), which the OECD (2004) calls its ‘operating context’.
For this reason, the first step policymakers need to consider in undertaking tax administration reform is diagnosing its existing problems and then developing appropriate strategies for improvement (Silvani and Baer Citation1997). Otherwise, without appropriate strategies and execution, tax authorities are at risk of underperforming (Gill Citation2000, Citation2003; McKerchar and Evans 2009).
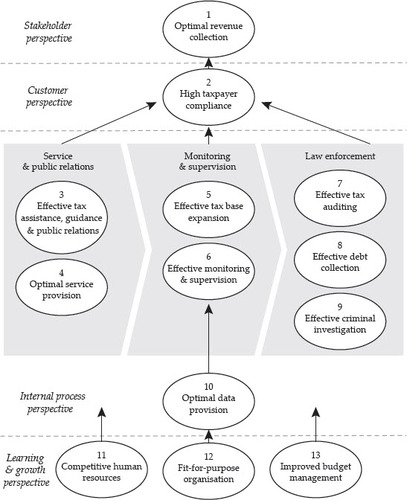
In this sense, in managing its performance, the Indonesian tax authority—that is, the Directorate General of Taxes (DGT)—has implemented a strategic planning framework and strategy execution using a balanced score card (BSC) approach since 2010. It is a strategy map that visually describes a high-level strategy, through several strategic objectives (SO) that are integrated in a structural causal relationship. Within the BSC framework, the organisation’s SOs are grouped into four perspectives: (i) stakeholders, (ii) customers, (iii) internal processes and (iv) learning and growth.Footnote1
On the DGT’s strategy map, the stakeholder perspective has an objective ‘optimal tax revenue collection’, which is generated from a ‘high level of taxpayer compliance’ by customers. From the customers’ perspective, the SO is influenced by how well the SOs of internal processes perform. Consecutively, the performance of several SOs in internal processes depends on the performance of several SOs in learning and growth.Footnote2
In this regard, the SOs of internal processes are divided into three major groups: (i) services and public relations, (ii) monitoring and supervision and (iii) law enforcement. Modern tax administration generally carries out the same types of activities or business processes (Baurer Citation2005). Unfortunately, at least empirically, there is no consensus on the causal relationship between business process performance and increased tax compliance. Studies related to the performance of tax administration business processes tend to focus on performance measurement rather than performance management (see, for example, Klun Citation2004; Serra Citation2005; von Soest Citation2006; Tennant and Tennant Citation2007).
Tax authorities, in general, engage in three main activities: service and public relations, monitoring and supervision, and law enforcement (OECD 2014). Traditionally, the relationship between law enforcement and tax compliance has often emphasised the likely impact of audits, the probability of detection and the severity of sanctions (see, for example, Allingham and Sandmo Citation1972; Sandmo Citation2005; Cowell Citation1985; Franzoni Citation1998; Beck and Jung Citation1989; Dubin, Graetz and Wilde Citation1990; Kirchler et al. Citation2010; Kirchler, Kogler and Muehlbacher Citation2014). Unfortunately, the standard formulation of deterrence in this conventional model does not always perform well in practice, partly due to practical constraints (Osofsky Citation2014).
This gap has led many studies on tax compliance to depart from the concept of ‘economic deterrence models’ (see, for example, Brink and Porcano Citation2016; Congdon, Kling and Mullainathan Citation2009; Cummings et al. Citation2009; Frey and Torgler Citation2007; Halla Citation2012; Kornhauser Citation2007; MacGregor and Wilkinson Citation2012; McKerchar, Bloomquist and Pope Citation2013; Yucedogru and Hasseldine Citation2016). As Umar and Tusubira (Citation2017) suggest, the challenge of increasing tax revenue, particularly in developing countries, cannot be overcome by tax administration alone, and understanding the effectiveness of law enforcement is critical. Thus, given that no ‘magical medicine’ or fiscal ‘silver bullet’ exists to overcome the complicated phenomenon of tax compliance (Bird Citation2013), understanding how effective law enforcement is in increasing tax compliance is an important avenue for tax research (Walsh Citation2012).
According to the DGT’s Strategic Plan 2020–24 (DGT 2020), one initiative aimed at improving tax compliance is introducing proper risk-based oversight and law enforcement. But this raises the question: to what extent are law enforcement activities capable of increasing tax compliance in Indonesia? We empirically investigated this issue through the lens of Indonesia’s tax authority strategy map. Using micro administrative data, we found that law enforcement seems to have a positive impact on tax compliance. Our results indicate that, while audit coverage ratio (ACR) plays a vital role in improving tax compliance, criminal investigation appears to be an influential factor in determining the effectiveness of law enforcement.
Our research contributes to the extant literature in the following ways. First, our paper adds to the growing body of work that empirically examines the impact of law enforcement on tax compliance, particularly from an emerging economy perspective. Second, we add to the literature by providing a detailed analysis of the effectiveness of law enforcement in increasing tax compliance. Unlike the extant literature, we demonstrate the results through the lens of a tax authority. Third, to the best of the authors’ knowledge, no empirical study has been conducted on the effectiveness of law enforcement in improving tax compliance using an actual strategy map and administrative data. Consequently, this study provides the first comprehensive assessment of a tax authority’s strategy map. Finally, as many tax administrations operate under multiple uncertainties (Wenzel and Taylor Citation2003), this paper offers evidence-based findings that may be beneficial in reducing some of those ex-ante uncertainties, especially for the Indonesian tax authority. The remainder of the paper is structured as follows: contextual background, description of the data and empirical strategy, results and discussion, and conclusions.
LITERATURE AND CONCEPTUAL FRAMEWORK
Tax Compliance and Law Enforcement
A conceptual model of tax compliance highlights the importance of law enforcement in improving tax compliance. According to the OECD (2013), a conceptual model widely used by tax authorities in various parts of the world is the cooperative compliance model (CCM). From the perspective of a tax authority, compliance strategies include a range of service-oriented ones at the bottom of the pyramid (for taxpayers who want to comply) to legal prosecution at the top (for the non-compliant).
If taxpayers are known or suspected tax evaders, they may be subject to law enforcement. There are two main law enforcement strategies in the CCM: (i) use of the full force of the law and (ii) deterrence by detection. Both are undertaken via ‘audit, investigation and other verification’ and ‘debt collection’ (OECD 2017). The ability of tax authorities to provide optimal services for taxpayers who want to comply and prevent or detect non-compliance of taxpayers can be called administrative effectiveness (Langham, Paulsen and Hartel Citation2012). According to Lewis (Citation1982) and Cullis and Jones (Citation1992), tax-enforcement structures can influence perceptions of enforcement and the opportunity for tax evasion. Numerous studies describe the role of tax enforcement in improving tax compliance (see, for example, Scotchmer and Slemrod Citation1989; Slemrod and Yitzhaki Citation2000; Richardson and Sawyer Citation2001; Slemrod, Blumenthal and Christian Citation2001; Slemrod Citation2019; Yong et al. Citation2019), and the concept of tax enforcement has received increased attention in the literature since 2008 (Yong et al. Citation2019). So far, however, very few studies have investigated this area using administrative data.
In the Indonesian context, the effectiveness of law enforcement needs urgent attention for two main reasons. First, Indonesian’s ratio of tax to GDP is relatively low compared to other developing countries (Araki and Claus Citation2014) and increasing it has proven to be difficult (OECD 2018). Indonesia’s average tax ratio is still below 12% (OECD 2018) and this figure, according to the IMF (2011), is lower than the average tax ratio in poor countries (low-income countries). Indonesia’s tax ratio is very low by international standards and has shown a decline over the past five years.Footnote3 Poor law enforcement appears to contribute to low tax ratios (OECD 2015) and one of the ways to improve this is to strengthen tax administration (OECD 2018).
Second, although a self-assessment system has been operating for almost 37 years in Indonesia, the issue of tax compliance remains a major unresolved problem (Ikhsan, Trialdi and Syahrial Citation2005; Francis Citation2012; Basri et al. Citation2019). As a result, although the DGT has made substantial changes through the tax administration reform program since 2002, the tax revenues that have been collected are still relatively low (Arnold Citation2012). Issues related to tax compliance are not easy to resolve (Mikesell and Birskyte Citation2007). Referring to the 2015–19 DGT Strategic Plan, the main concerns faced by the DGT in relation to its low tax ratios were low taxpayer compliance, and ineffective supervision and law enforcement.Footnote4
The concept of tax compliance can be defined from multiple viewpoints and so has various meanings; hence, its definition tends to be very broad and to include numerous aspects. Consequently, there is little to no consensus about what is meant by tax compliance (see, for example, Devos Citation2014; McKerchar Citation2003; Weber, Fooken and Herrmann Citation2014). However, it is commonly divided into two categories (Rosid, Evans and Tran-Nam Citation2016): conceptual (see, for example, James and Alley Citation2004; Kirchler Citation2007; and Weber, Fooken and Herrmann Citation2014) and operational (see, for example, Jackson and Milliron Citation1986; Alm Citation1991; Alm and Mckee Citation2006; IRS 2009; OECD 2014).
The conceptual approach tends to emphasise the willingness of taxpayers to comply with tax provisions when law enforcement activities are absent. By contrast, the operational approach tends to focus on certain aspects of fulfilling the administrative aspect of tax liabilities. For this reason, given its more practical use, the operational approach seems to offer more advantages (Rosid, Evans and Tran-Nam Citation2016). Under this approach, the level of taxpayer compliance can be easily measured by simply evaluating whether certain operational or technical aspects of tax requirements have been met. This is somewhat comparable to the OECD (2014) definition. Similarly, in Indonesia, tax compliance is divided into two main categories: ‘formal compliance’, which primarily refers to the filing of tax returns, and ‘material compliance’, which narrowly refers to the proper reporting and payment component.Footnote5
It is worth adding that both compliance and non-compliance can be intentional or unintentional (Cooper Citation1994; Erard Citation1997; Lederman Citation2003; OECD 2014). In other words, differences in the level of taxpayer intentions and the effectiveness of the administration of tax authorities can lead to four types of compliance behaviour: (i) deliberately compliant, (ii) accidentally non-compliant, (iii) accidentally compliant, and (iv) non-compliant or evasive (Langham, Paulsen and Hartel Citation2012; OECD 2014).
Referring to the ex-post definition of tax compliance, uncovering the typology of most taxpayers and/or the extent of their (non-)compliance is a daunting task indeed. However, several indicators can be used to measure this. From a practical perspective, based on the criteria in the DGT’s strategy map, formal compliance measures the difference between the number of taxpayers who lodge tax returns and the number who are obliged to do so. Material compliance is defined as the ratio of taxpayers who make payments to taxpayers who are obliged to submit tax returns.
Those who are obliged to submit tax returns are generally subject to audits. The term ACR relates to this common form of law enforcement. ACR is a measure to determine the likelihood of getting audited at the national level (DGT 2019). As in other countries with limited resources, Indonesia has a low ACR. Based on the 2018 DGT Performance Report, the ACR targets for corporate income taxpayers for 2016, 2017 and 2018 were 1.68%, 2.32% and 2.32%, respectively; the targets for individual taxpayers in the same years were 0.23%, 0.39% and 0.39%.
In calculating ACR targets, the current formula includes the number of routine audits. From a taxpayer’s viewpoint, a routine audit can be considered an anticipated audit.Footnote6 This is because it applies to all taxpayers who lodge overpaid annual tax returns. As shows, on average, 70% of all audits are routine. This implies that 30% of audits are random. Random audits are risk-based and are carried out following a risk assessment of non-compliant behaviour. Accordingly, if the ACR is based on the number of random audits, the actual audit rate is much lower.Footnote7
Table 1. Number of Audits and Audit Coverage Ratio for FY 2016–18
Indonesia’s Tax Administration Strategy Map
Strategy can be described as the integrated set of choices an organisation has at its disposal to achieve certain expected results (Rivkin Citation2004). As mentioned earlier, the DGT adopts a BSC approach as a strategic management tool that translates its vision, mission and goals (DGT 2019). The DGT’s strategy map provides a visual description of this approach, incorporating several key strategic goals (SGs) linked conceptually in causal relationships. SGs are statements about what the organisation should have, implement, produce or achieve. The DGT’s strategy map includes four perspectives: (i) stakeholders, (ii) customers, (iii) internal processes, and (iv) learning and growth (see ).
FIGURE 1 DGT’s Strategy Map
Source: DGT (2019).
We utilise the hypothetical, structural causal relationships among the SGs deployed across the four perspectives in the strategy map as a conceptual framework for this study.Footnote8 The performance of each SG is measured by the realised scores of its corresponding key performance indicators (KPIs) (Marr Citation2008). In this study, we use these values as empirical referents in measuring effectiveness. According to the OECD (2008), effectiveness measures the extent to which ‘results’ or ‘impacts’ can be achieved. Law enforcement policy can be considered effective if the impact generated is in accordance with the desired outcome—namely, improved compliance. To put this another way, the extent to which compliance levels could be increased indicates the effectiveness of law enforcement activities. Although several studies have recognised the importance of law enforcement in improving tax compliance (see, for example, Gemmel and Ratto 2012; Slemrod Citation2019), research has yet to systematically investigate its effectiveness using actual administrative data.
Utilising KPI realised values as parameters, we examine whether the programs and/or activities attributed to law enforcement in the strategy map improve taxpayer compliance. As depicted in , ‘optimal tax revenue collection’ is a strategic goal within the stakeholder perspective resulting from ‘high taxpayer compliance’ by customers. Conceptually, the strategic goal of customers is influenced by the effectiveness of internal processes. Consecutively, the performance of SGs in internal processes depends on the performance of SGs in the learning and growth perspective. It is worth noting that the SGs of internal processes are divided into three major groups: (i) services and public relations, (ii) supervision and (iii) law enforcement. A detailed explanation of the SGs prescribed in the DGT strategy map can be found in table A1 in the online appendix.Footnote9
Program Logic of Tax Compliance
Effectiveness is a measure to evaluate the extent to which ‘results’ or ‘impacts’ have been achieved (OECD 2008). In improving tax compliance, tax authority requires resources (inputs), such as human resources and budgets. These resources are used to carry out various activities, such as education for taxpayers, administrative services, audits and billing. These activities produce outputs, which can take the form of number of services performed or number of audits completed. These outputs are then expected to have an impact (that is, an outcome). In general, the overall impact that the tax authorities want to achieve in relation to their operation is improved taxpayer compliance (OECD 2008). In this sense, effectiveness occurs when the impact of the activity or program is as expected.
For this reason, we consider law enforcement to be effective when the actual impact is in accordance with its desired outcome—in other words, increased taxpayer compliance (OECD 2010). Thus, the extent to which compliance behaviour can be improved is a strong indication of the effectiveness of a program. Referring to the previous explanation, using KPI values as a parameter, we explore whether the law enforcement activities in the strategy map increase taxpayer compliance, as conceptually expected.
Research Problem and Propositions
The performance of tax authorities can be broadly measured at three levels: strategic, operational and individual (Crandall Citation2010). In this study, we examine whether law enforcement is effective in improving tax compliance in Indonesia at a strategic level. We hypothesise conceptual mechanisms that underpin the causal relationship between law enforcement and tax compliance based on the tax authority’s strategy map. To clearly comprehend the scope of the study, we present the research propositions as a set of alternative and null (H0) hypotheses in as follows.
Table 2. Hypotheses under Study
DATA AND EMPIRICAL STRATEGY Data
The main objective of this study is to better understand the effectiveness of law enforcement in improving tax compliance in Indonesia, particularly from a tax authority’s perspective. To optimise the level of generalisability of the findings, we employ a census approach for data collection. By census, we mean ‘a complete enumeration’ or collection of information from all units in the population (Neuman 2007; Northrop and Arsneault Citation2008). The population in this study comprises all tax offices in Indonesia. Thus, we collect and analyse hand-collected quantitative data (that is, the scores of KPIs) from all 352 tax offices in Indonesia. The number and the distribution of tax offices are described in .
Table 3. Number of Tax Offices in Study
The number of tax offices varies in each of Indonesia’s main islands. Java has the largest number of tax offices (57% or 202/352 tax offices); this correlates with the fact that 58% of Indonesia’s GDP is generated from this region. In terms of type, most tax offices are categorised as small (91% or 319/352 tax offices).
In addition, we obtained a confidential list of 480 taxpayers who had been investigated in relation to tax crime in 2018.Footnote10 Using this list, we generated two additional data sets: (i) the 185 tax offices that administered those 480 criminal investigations and (ii) the 167 tax offices that were not involved in investigating the 480 taxpayers. To simplify, we named the former set ‘Group A’ and the latter set ‘Group B’.
Empirical Strategy
As previously indicated, we use the DGT’s strategy map as an intuitive conceptual model to test the effectiveness of law enforcement at improving tax compliance. To empirically examine the effectiveness of law enforcement in increasing tax compliance, we adopt a ‘conceptual testing’ approach to evaluate whether law enforcement activities affect tax compliance. The conceptual framework being tested here is the strategy map.
In this regard, we consider structural equation modelling (SEM)—defined as a statistical technique for determining, estimating and evaluating the linear relationship model among a set of observed variables (Shah and Goldstein Citation2006)—an appropriate approach to adopt. This is because SEM is a tool for ‘confirmatory’ rather than ‘exploratory’ research (Gefen, Straub and Boudreau Citation2000; Kline Citation2005, Citation2011). An a priori technique for determining the pattern of linear relationships between a set of variables simultaneously (Shah and Goldstein Citation2006), SEM is an appropriate and powerful statistical tool for testing theories or concepts (Steenkamp and Baumgartner Citation2000; Hair et al. Citation2010; Blunch Citation2013).
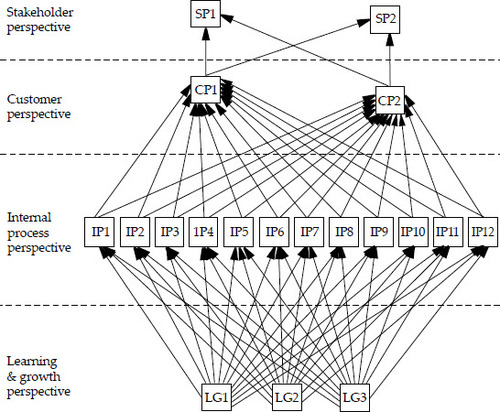
The SEM method emphasises the importance of understanding the pattern of correlations between a set of variables and describing as much of their variance with the model being tested as possible (Kline Citation2005, Citation2011). The conceptual framework of path analysis in which SEM is applied to test simultaneously all causal relationships among observed variables in the strategy map is pictorially shown in .
FIGURE 2 Conceptual Framework under Review
Note: The rectangles indicate the observed variables under review (that is, KPIs; 19 in total). SP represents the KPIs from the stakeholder perspective (two KPIs), CP represents the KPIs from the customer perspective (two KPIs), IP represents the KPIs from the internal process perspective (12 KPIs) and LG represents the KPIs from the learning and growth perspective (three KPIs). In this intuitive conceptual model, 64 causal relationships were analysed simultaneously. Note, however, that the emphasis of this study lies in the relationships between KPIs in the internal process and customer perspectives.
To examine the hypotheses, we treat KPI scores as empirical referents. In total, there are 19 KPIs in the DGT’s 2018 strategy map. These serve as quantitative reflective indicators of how well the SGs have been achieved.Footnote11 By way of illustration, the empirical referent for the ACR is the KPI score for the ACR; likewise, the empirical referent for the level of tax compliance is the KPI score for tax compliance. By doing this, we operationalise variables that were previously theoretical, transforming them into empirical variables for further statistical analysis. It is worth noting that the scale of all empirical referents in this study is ratio (that is, percentage). We provide detailed information relating to KPIs, including their codes, aims and formulas, in table A2 (online appendix).Footnote12
RESULTS
Descriptive Statistics
We report the descriptive statistics (mean, standard deviation, minimum and maximum) of 19 KPI scores from 352 tax offices across Indonesia for 2018 in . The values presented reveal that the realised scores for KPIs vary, with the mean for routine tax revenue being the lowest (87%) and the mean for data feeding for tax potential being the highest (451%).
Table 4. KPI Scores (%) (N = 352 tax offices)
Inferential Statistics
As depicted in the conceptual model (), 64 causal relationships were tested simultaneously using an SEM approach. The details of these relationships are as follows: 36 causal relationships resulted from 3 KPIs in the learning and growth perspective and 12 KPIs in the internal process perspective, 24 causal relationships resulted from 12 KPIs in the internal process perspective and 2 KPIs in the customer perspective, and 4 causal relationships were generated from 2 KPIs in the customer perspective and 2 KPIs in the stakeholder perspective.
Based on these SEM outputs, we classified the causal relationships based on the direction of the relationship and the level of statistical significance. We mainly used a confidence level of 95% (that is, p < 0.05). Four categories of relationships emerged: (i) positive—significant, (ii) positive—insignificant, (iii) negative—significant and (iv) negative—insignificant.Footnote13
At the national level, we found that the majority (63%) of causal relationships were positive (43/64). We report the statistical outputs in figure A1/table A3 (online appendix) and summarise the results in .
Table 5. Variation in Causal Relationships in the DGT’s Strategy Map (N = 352 tax offices)
Regarding the DGT’s internal business process, as shown in , all KPIs for service and public relations activities appear to have a positive relationship with tax compliance KPIs, with 67% having a statistically significant relationship. Meanwhile, the KPIs for monitoring and supervision activities show equal positive and negative relationships (50% each) with tax compliance KPIs, but only one statistically significant positive relationship (17%). Further, 75% of causal relationships between law enforcement and tax compliance appear to have positive relationships, with 38% being statistically significant.
Table 6. Causal Relationships between the DGT’s Internal Business Process and Tax Compliance
Hypotheses Testing
To address the research problem, we examined the eight hypotheses shown in at the national level and with an α level of 0.05. The findings are as follows.
H1: Audit Coverage Ratios Improve Formal Compliance We found a statistically significant positive relationship between audit coverage ratios and formal compliance (p = 0.01), with a standardised coefficient value of 0.13. This finding shows that the level of audit coverage is influential in improving the level of formal compliance. Based on this result, the null hypothesis H10 can be rejected.
H2: Non-Disputed Tax Assessments Improve Formal Compliance
We found a statistically significant positive relationship between non-disputed tax assessment and formal compliance (p = 0.04), with a standardised coefficient value of 0.10. This suggests that tax audit processes are an important part in improving the level of formal compliance. Based on this result, the null hypothesis H20 can be rejected.
H3: Proposal for Tax Arrears Imprisonment Do Not Improve Formal Compliance
We discovered no statistically significant relationship between the proposal for tax arrears imprisonment and formal compliance (p = 0.75), with a standardised coefficient value of –0.02. This finding indicates that increasing the proposal for tax arrears imprisonment has no effect on the level of formal compliance. Based on this result, the null hypothesis H30 can be accepted.
H4: Information Reporting upon Indication of Tax Crimes Improves Formal Compliance
We found a statistically significant positive relationship between information reporting upon indication of tax crimes and formal compliance (p = 0.10), with a standardised coefficient value of 0.08. This means that, although it seems miniscule, information reporting upon the indication of tax crime increases the level of formal compliance. Based on this result, the null hypothesis H40 can be rejected.
H5: Audit Coverage Ratios Improve Material Compliance
We detected a statistically significant positive relationship between audit coverage ratios and material compliance (p = 0.003), with a standardised coefficient value of 0.15. This finding shows that the level of audit coverage is influential in improving the level of material compliance. Based on this result, the null hypothesis H10 can be rejected.
H6: Non-Disputed Tax Assessments Decrease Material Compliance
We observed a statistically significant negative causal relationship between non-disputed tax assessment and material compliance (p = 0.02), with a standardised coefficient value of –0.12. This suggests that tax audit processes are an important part of taxpayers’ material compliance. Based on this result, the null hypothesis H20 can be rejected.
H7: Proposals for Tax Arrears Imprisonment Do Not Improve Material Compliance
We found no statistically significant relationship between proposals for tax arrears imprisonment and material compliance (p = 0.55), with a standardised coefficient value of 0.03. This demonstrates that increasing the proposal for tax arrears imprisonment has no effect on the level of material compliance. Based on this result, the null hypothesis H30 can be accepted.
H8: Information Reporting the Indication of Tax Crime Does Not Improve Material Compliance
We discerned no statistically significant relationship between information reporting the indication of tax crime and material compliance (p = 0.68), with a standardised coefficient value of 0.02. This demonstrates that increasing the incidence of reporting of tax crime has no effect on the level of material compliance. Based on this result, the null hypothesis H30 can be accepted. For an easier comparison, we summarise the results for H1–H8 in .
Table 7. Summary of Standardised Direct Effects between Law Enforcement Activities and the Level of Tax Compliance Arising from Hypotheses H1–H8
shows that, while non-disputed tax assessment appears to have mixed effects on compliance, ACR appears to have a positive effect on both formal and material compliance. That is, when audit coverage ratio increases by 1 standard deviation, formal and material compliance improves by 0.134 and 0.147 standard deviations, respectively.
Robustness Tests
For the sake of robustness, we conducted two additional analyses. First, we differentiated the level of analysis based on the five major island groups in Indonesia: (i) Java; (ii) Sumatra; (iii) Sulawesi; (iv) Kalimantan; and (v) Bali, Nusa Tenggara, Papua and Maluku. We provide the statistical results of these analyses in figures A2–A6/tables A4–A8 (online appendix).Footnote14 presents the breakdown of observations by region.
Table 8. Summary of Standardised Direct Effects between Law Enforcement Activities and the Level of Tax Compliance by Group of Five Main Islands
As shows, in general, ACR had a positive effect on both formal and material compliance in Java, where most tax offices were located (202 tax offices). Nevertheless, varying effects were recorded outside of Java. For example, the prospect of imprisonment for tax arrears was seemingly influential in Bali, Nusa Tenggara, Papua and Maluku, but not in the Kalimantan area.
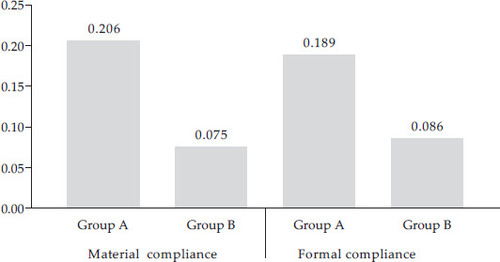
Second, as indicated earlier, we employed an additional data set of 480 taxpayers who had been investigated in relation to tax crime in 2018 and then split the data sets. The first data set consisted of 185 tax offices where the 480 taxpayers were administered; the second data set comprised the remaining 167 tax offices that were not involved in investigating the 480 taxpayers. We utilised the SEM approach to examine these data sets. We report the statistical results in figure A7/table A9 (online appendix) for the former, and in figure A8/table A10 (online appendix) for the latter. We summarise and present these findings in as follows.
Table 9. Comparison of Standardised Direct Effects between Law Enforcement Activities and the Level of Tax Compliance between Two Groups of Tax Offices
These results show statistically significant positive relationships between ACR and both formal and normal compliance, but only for Group A, in which an increase in ACR by 1 standard deviation resulted in improvements in formal and material compliance by 0.206 and 0.189 standard deviations, respectively. Surprisingly, we found no statistically significant relationships for Group B. This indicates that the level of audit coverage was influential in improving the level of both formal and material compliance, but only for tax offices that administered criminally investigated taxpayers, as indicated by its statistical significance and by the value of the standardised coefficients.
DISCUSSION
Adopting a conceptual testing approach, we empirically examined the causal relationships between the various observed variables under review, as prescribed in the DGT’s strategy map. In general, the nature of the relationships between the three internal business processes and level of tax compliance appeared to be somewhat as expected. For instance, within the service and public relations activity, all four causal relationships showed positive values (100%), while six out of eight relationships were positive (75%) for law enforcement activities. The lowest activity was monitoring and supervision, which had 50% of positive relationships.
For the purpose of this study, law enforcement activities, in particular, showed a somewhat expected result. This can be seen not only in the major proportion of positive causality (75%) but also in the fact that half of the positive relationships were statistically significant. At the national level (that is, 352 tax offices), the results showed that ACR was influential in improving both types of tax compliance.Footnote15
Nevertheless, the robustness tests showed that ACR had different effects on Group A and Group B. demonstrates that ACR had a stronger and more statistically significant effect on Group A (that is, the group of tax offices where taxpayers were criminally investigated) than Group B, which showed no discernible impacts.
FIGURE 3 Comparison of Standardised Direct Effects of ACR on Level of Compliance between Two Groups of Tax Offices
Note: *** = p ≤ 0.01. Group A represents a group of tax offices having taxpayers being criminally investigated. Group B represents a group of tax offices not having taxpayers being criminally investigated.
These results agree with the findings of other studies. First, this study supports the notion that a group of taxpayers who are connected in some way with those who are the subject of tax-enforcement activities may learn actions that change their views on law enforcement activities, and that these changed views will then spread in their networks (Slemrod Citation2019). The resulting network deterrent effect captures the transmission of information about a change in enforcement strategy through word-of-mouth—a conceivable mechanism that may lead to widespread deterrence (Slemrod Citation2019).
The findings of this study are also consistent with a study by Davis, Hect and Perkins (Citation2003). According to their research, the characteristics of a taxpayer population are a factor in determining the extent to which law enforcement can improve tax compliance. For example, compliant taxpayer populations tend to be less sensitive to law enforcement activities, while non-compliant taxpayer populations are inclined to be more sensitive to law enforcement policies. In relation to this, a study by Rosid, Evans and Tran-Nam (Citation2018) showed a high incidence of non-compliant behaviour in Indonesia, with 44% of surveyed taxpayers underreporting between 50% and 100% of their income. As suggested by Davis, Hect and Perkins (Citation2003), the significant presence of non-compliant taxpayers in Indonesia may be a contributing factor in the positive effect of ACR in increasing both formal and material compliance.
In part, these findings support the continued relevance of traditional economic deterrence models that emphasise the probability effect of audits and the probability of detection (see, for example, Allingham and Sandmo Citation1972; Sandmo Citation2005; Cowell Citation1985; Beck and Jung Citation1989; Dubin, Graetz and Wilde Citation1990; Kirchler, Kogler and Muehlbacher Citation2014). While it is acknowledged that dissatisfaction with these traditional approaches was what motivated the development of research into behavioural models in the first place (Reeson and Dunstall Citation2009; Alm Citation2011; OECD 2013; Ritsatos Citation2014), it is worth emphasising that non-deterrence approaches have not supplanted the critical role of deterrence as an essential measure of ensuring tax compliance—they merely complement them (Hofmann, Hoelzl and Kirchler Citation2008; Kirchler Hoelzl and Wahl 2008; Osofsky Citation2014).
Nevertheless, at least in practice, the purely traditional economic deterrence model is considered unrealistic. This is because, in reality, ACR values are relatively, if not extremely, small, and the decision to undertake tax non-compliance is not purely influenced by considerations of economic rationality (maximising strategies) but by more common considerations (rules of thumb or heuristics) (Cullis and Jones Citation1992; Ritsatos Citation2014).Footnote16
Regarding this, in support of the so-called spillover effect phenomenon (see, for example, Alm Citation2011; Lederman Citation2010), the findings of this study demonstrate that ‘actual’ law enforcement—that is, criminal investigation—appears to have a real influence on the effectiveness of tax authorities’ capabilities in improving tax compliance. From the viewpoint of taxpayers, one possible explanation for this is a cognitive bias that suggests that taxpayers tend to rely more heavily on information that is readily accessible to evaluate the frequency or likelihood of getting audited or investigated—a phenomenon known as availability bias (Sunstein Citation2002; Gemmell and Ratto Citation2012).Footnote17
CONCLUSIONS
This study sought to measure the effectiveness of law enforcement activities carried out by Indonesia’s tax authority to increase tax compliance. A comprehensive analysis would require, inter alia, an examination at both the taxpayer and administrative levels. However, from an institutional viewpoint, we argue that the tax authority’s perspective is the more relevant. Hence, this is the side of the equation we sought to answer empirically. Since doing so required measurement and assessment at the strategic level, this study employed the DGT’s strategy map as its working conceptual lens.
The DGT’s strategy map is a visual description of strategy charted through several SGs integrated into structural causal relationships. We found that it could be used conceptually as an underlying parameter to quantitatively measure the effectiveness of law enforcement in improving tax compliance. Accordingly, an activity or program was considered effective if it had the expected result. The effectiveness of law enforcement activities was measured and empirically examined in relation to compliance levels. In assessing the effectiveness of law enforcement in improving tax compliance, this study analysed 19 KPIs from 352 tax offices across Indonesia for the 2018 fiscal year.
Our findings can be summarised as follows. First, we found that the causal relationships aligned with SGs in the DGT strategy map were dominated by positive values (63%), and that law enforcement activities, particularly in the form of ACR, appeared to be effective at improving both formal and material compliance. This study found that ACR had a discernible positive influence on the level of compliance. At the national level, both formal and material compliance improved by 0.134 and 0.147 standard deviations, respectively, when the ACR was increased by 1 standard deviation. Second, in this context, the prospect of criminal investigation seemed to be a defining factor. As noted, the level of audit coverage positively influenced the level of both formal and material compliance in Group A only—that is, the group of tax offices where criminal investigations took place. The discernible impact of this tax enforcement on improving tax compliance was observed. In Group A, both formal and material compliance improved by 0.206 and 0.189 standard deviations, respectively, when the ACR increased by 1 standard deviation. These findings are of particular importance given the relative lack of empirical data related to the relationship between law enforcement and tax compliance. Further research is needed to better understand this complex relationship.
Finally, it is worth noting that these results provide evidence of the impact of law enforcement on tax compliance at the administrative level, specifically in the context of the Indonesian tax authority’s strategy map; they do not provide insight into the taxpayers’ level nor to the actual behaviour of taxpayers, as this would require different empirical data and a different methodology. This study only examined micro administrative data with respect to the Indonesian tax authority’s strategy map. Consequently, the relevance of its findings to other administrative contexts or jurisdictions with different strategy maps and/or operating contexts is unknown. Further, as this study quantitatively examined the administrative data at face value, its usefulness to other jurisdictions could be limited. Nevertheless, the findings have, to some extent, confirmed existing theories and empirical findings, making them relevant to other contexts in a broader sense.
Future research could scrutinise several questions arising from this study: Do the results documented here vary from year to year? Do institutional characteristics shape how taxpayers react to various types of law enforcement activities? How do taxpayers respond to the presence of routine audits and random audits? Answering these follow-up questions is likely to generate useful insights.
Supplemental Material
Download MS Word (1.5 MB)Notes
1 BSC was developed by Robert S. Kaplan and David P. Norton in 1992 (Kaplan and Norton Citation1992, Citation2000). In 1996, their book, The Balanced Scorecards, was published. BSC is a tool for executing and monitoring organisational strategy using financial and non-financial measures. See https://balancedscorecard.org/bsc-basics-overview/.
2 This is visually depicted in and will be elaborated later.
3 It should be noted that tax ratios can be defined and calculated in several ways. In the Indonesian context, a narrow calculation is commonly used—one that does not include elements of local taxes and social security contributions. A more detailed discussion of the various methods of calculating the tax ratio can be seen in OECD (2001).
4 See, Director General of Taxation Decree KEP-95/PJ/2015 regarding the DGT’s strategic plan for 2015–19, especially pp. 10–11.
5 According to the OECD (2014, 60), tax compliance has four pillars: ‘(i) to register for tax purposes; (ii) to file tax returns on time; (iii) to correctly report tax liabilities; and (iv) to pay taxes on time’.
6 See, Director General of Taxation Circular Letter 10/PJ.04/2008 concerning tax audit policy to assess level of compliance. On the other hand, developed countries emphasise a risk-based audit approach in assessing the level of compliance (IMF 2015).
7 It should be noted that, in calculating ACR, the DGT employs the number of taxpayers who are obliged to lodge annual tax return as the denominator. Several countries use a different approach—for example, using the number of active taxpayers as the denominator (OECD 2017). The implication is that the Indonesian ACR is likely to be overstated compared to other countries.
8 Regarding the design of the strategy map and performance management in the DGT, see Minister of Finance Decree 467/KMK.01/2014.
9 See the appendix here: http://dx.doi.org/10.1080/00074918.2021.1970110.
10 According to preliminary criminal investigation reports for the 2018 fiscal year, it generally took 1.5–2 years to conclude an investigation.
11 In SEM, a hypothesised causal structure can be represented in two ways: as a system of equations or as a graph. We prefer the latter because diagrammatic structural models have more communicative capacity in describing the relationships between the variables under study (Blunch Citation2013).
12 See the appendix here: http://dx.doi.org/10.1080/00074918.2021.1970110.
13 A positive causal relationship between, for instance, A→B is considered to occur if an increase in the value of variable A is followed by an increase in the value of variable B or vice versa. Conversely, a negative causal relationship between, for instance, C→D is considered to occur if an increase in the value of variable C is followed by a decrease in the value of variable B or vice versa.
14 See the appendix here: http://dx.doi.org/10.1080/00074918.2021.1970110.
15 It should be noted that, in relation to ACR, the Indonesian tax authority appears to focus on corporate taxpayers rather than individual taxpayers. By way of illustration, based on the 2018 DGT Performance Report, the targeted ACR for corporate taxpayers in 2016, 2017 and 2018 was 1.68%, 2.32% and 2.32%, respectively, while for individual taxpayers it was 0.23%, 0.39% and 0.39%.
16 ACR’s ability to influence tax non-compliance can be described traditionally in the following illustration. Assuming the taxable income is Y and the tax rate is t, then a person who reports taxes honestly will pay all taxes owed and enjoy an income of (1-t) Y. However, if the individual is non-compliant, the possibility of being discovered by the tax authorities is p, and the penalty to be paid is F. The expected value (EV) of this action is: E (v) = p (Y-F) + (1-p) Y. If the value of this EV is greater than (1-t) Y, then, based on this model, it is assumed that the individual will commit tax evasion. For example, if Y = Rp 12 million, p = 0.5, t = 0.33 and F = Rp 5 million, then the comparison is as follows: (1-t) Y = 0.66 x Rp 12 million = Rp 8 million, compared to: p (Y-F) + (1-p) Y = 0.5 (Rp 12 million – Rp 5 million) + 0.5 (Rp 12 million) = Rp 9.5 million. If the p value in this example is changed to 0.25, the comparison value changes to Rp 11 million. The assumption for a p-value of 0.5 or 0.25 is arguably unrealistic. That is to say, the possibility of a taxpayer being audited by 50% or 25% in the real world is almost impossible. In fact, as described earlier, the probability of getting audited for individual taxpayers in Indonesia is less than 0.4%.
17 For instance, ‘the impact of seeing a house burning on the subjective probability of such accidents is probably greater than the impact of reading about a fire in the local paper’ (Tversky and Kahneman Citation1974, 1127).
REFERENCES
- Allingham, Michael G. and Agnar Sandmo. 1972. ‘Income Tax Evasion: A Theoretical Analysis’. Journal of Public Economics I: 323–38. doi: 10.1016/0047-2727(72)90010-2
- Alm, James. 1991. ‘A Perspective on the Experimental Analysis of Taxpayer Reporting’. The Accounting Review 66 (3): 577.
- Alm, James. 2011. ‘Measuring, Explaining, and Controlling Tax Evasion: Lessons from Theory, Experiments, and Field Studies’. International Tax and Public Finance 19 (1): 54–77. doi: 10.1007/s10797-011-9171-2
- Alm, James, and Michael McKee. 2006. ‘Audit Certainty, Audit Productivity, and Taxpayer Compliance’. Research Paper Series, Andrew Young School of Policy Studies.
- Araki, Satoru and Iris Claus. 2014. A Comparative Analysis of Tax Administration in Asia and the Pacific. Mandaluyong City, Philippines: Asian Development Bank.
- Arnold, Jens. 2012. ‘Improving the Tax System in Indonesia’. OECD Economics Department Working Papers, no. 998.
- Basri, Muhammad C., Mayara Felix, Rema Hanna and Benjamin A. Olken. 2019. ‘Tax Administration vs. Tax Rates: Evidence from Corporate Taxation in Indonesia’. NBER Working Paper, no. 26150.
- Baurer, Lewis I. 2005. ‘Tax Administration and Small and Medium Enterprises (SMEs) in Developing Countries’. https://documents1.worldbank.org/curated/en/711511468779448847/pdf/391100Taxadmin01PUBLIC1.pdf.
- Beck, Paul J. and Woon-Oh Jung. 1989. ‘Taxpayer Compliance Under Uncertainty’. Journal of Accounting and Public Policy 8 (1): 1–27. doi: 10.1016/0278-4254(89)90009-4
- Bird, Richard M. 2003. Managing the Reform Process. ITP Paper 0301.
- Bird, Richard M. 2004. ‘Administrative Dimension of Tax Reform’. Asia-Pacific Tax Bulletin 10 (3): 134–50.
- Bird, Richard M. 2008. ‘Tax Challenges Facing Developing Countries’. Institute for International Business Working Paper, no. 9. http://doi.org/10.2139/ssrn.1114084.
- Bird, Richard M. 2013. ‘Taxation and Development: What Have We Learned from Fifty Years of Research?’. Public Finance and Management 13 (4): 266–88.
- Blunch, Niels. 2013. Introduction to Structural Equation Modeling Using SPSS Statistics and AMOS. 2nd ed. London: Sage Publications.
- Brink, William D. and Thomas M. Porcano. 2016. ‘The Impact of Culture and Economic Structure on Tax Morale and Tax Evasion: A Country-Level Analysis Using SEM’. Advances in Taxation 23: 87–123. doi: 10.1108/S1058-749720160000023004
- Congdon, William J., Jeffrey R. Kling and Sendhil Mullainathan. 2009. ‘Behavioral Economics and Tax Policy’. National Tax Journal LXIl (3): 375–86. doi: 10.17310/ntj.2009.3.01
- Cooper, Graeme S. 1994. ‘Analyzing Corporate Tax Evasion’. Tax Law Review 50: 33–152.
- Cowell, Frank A. 1985. ‘The Economic Analysis of Tax Evasion’. Bulletin of Economic Research 37 (3): 163–93. doi: 10.1111/j.1467-8586.1985.tb00192.x
- Crandall, William. 2010. ‘Revenue Administration: Performance Measurement in Tax Administration’. International Monetary Fund. https://www.imf.org/en/Publications/TNM/Issues/2016/12/31/Revenue-Administration-Performance-Measurement-in-Tax-Administration-23956.
- Cullis, John and Phillip Jones. 1992. Public Finance and Public Choice. London: McGraw-Hill.
- Cummings, Ronald G., Jorge Martinez-Vazquez, Michael McKee and Benno Torgler. 2009. ‘Tax Morale Affects Tax Compliance: Evidence from Surveys and an Artefactual Field Experiment’. Journal of Economic Behavior & Organization 70 (3): 447–57. doi: 10.1016/j.jebo.2008.02.010
- Davis, Jon S., Gary Hect and Jon D. Perkins. 2003. ‘Social Behaviors, Enforcement, and Tax Compliance Dynamics’. The Accounting Review 78 (1): 39–69. doi: 10.2308/accr.2003.78.1.39
- Devos, Ken. 2014. Factors Influencing Individual Taxpayer Compliance Behavior. Springer. https://link.springer.com/book/10.1007978-94-007-7476-6.
- DGT (Directorate General of Taxation). 2019. Performance Report of Directorate General of Taxation 2018. Jakarta: DGT.
- DGT (Directorate General of Taxation). 2020. Strategic Plan of Directorate General of Taxation 2020-2024. Jakarta: DGT.
- Dubin, Jeffrey A., Michael J. Graetz and Lousi L. Wilde. 1990. ‘The Effect of Audit Rates on the Federal Individual Income Tax, 1977-1986’. National Tax Journal 43 (4): 395–409. doi: 10.1086/NTJ41788861
- Erard, Brian. 1997. ‘Self-Selection with Measurement Errors: A Microeconometric Analysis of the Decision to Seek Tax Assistance and Its Implications for Tax Compliance’. Journal of Econometrics 81 (2): 319–56. doi: 10.1016/S0304-4076(97)86570-0
- Francis, Smitha. 2012. ‘Fiscal Policy Evolution and Distributional Implications: The Indonesian Experience’. Ideas Working Paper Series, 01/2012: 1–42. Accessed 31 August 2013. http://www.networkideas.org/working/may2012/2001_2012.pdf.
- Franzoni, Luigi Alberto. 1998. ‘Tax Evasion and Tax Compliance’. In Encyclopedia of Law and Economics, vol. IV, edited by B. Bouckaert and GD Geest, 51–94. Cheltenham: Edward Elgar.
- Frey, Bruno S. and Benno Torgler. 2007. ‘Tax Morale and Conditional Cooperation’. Journal of Comparative Economics 35 (1): 136–59. doi: 10.1016/j.jce.2006.10.006
- Gefen, David, Detmar W. Straub and Marie-Claude Boudreau. 2000. ‘Structural Equation Modeling and Regression: Guidelines for Research Practice’. Communications of the Association for Information Systems 4 (1): 1–77.
- Gemmell, Norman and Marisa Ratto. (2012). ‘Behavioral Responses to Taxpayer Audits: Evidence from Random Taxpayer Inquiries’. National Tax Journal 65 (1): 33–58 doi: 10.17310/ntj.2012.1.02
- Gill, Jit B. S. 2000. ‘A Diagnostic Framework for Revenue Administration’. World Bank Technical Paper, no 472.
- Gill, Jit B. S. 2003. ‘The Nuts and Bolts of Revenue Administration Reform’. https://documents1.worldbank.org/curated/en/621061468339899486/pdf/331810NutsBolts.pdf
- Hair, Joseph F., William C. Black, Barry J. Babin, and Rolph E. Anderson. 2010. Multivariate Data Analysis (7th ed.). New Jersey: Pearson Prentice Hall.
- Halla, Martin. 2012. ‘Tax Morale and Compliance Behavior: First Evidence on A Causal Link’. The BE Journal of Economic Analysis & Policy 12 (1). doi.org/10.15151935-1682.3165.
- Hofmann, Eva, Erik Hoelzl and Erich Kirchler. 2008. ‘Preconditions of Voluntary Tax Compliance: Knowledge and Evaluation of Taxation, Norms, Fairness, and Motivation to Cooperate’. Z Psychol 216 (4): 209–17.
- Ikhsan, Mohamad, Ledi Trialdi and Syarif Syahrial. 2005. ‘Indonesia’s New Tax Reform: Potential and Direction’. Journal of Asian Economics 16 (6): 1029–46. doi: 10.1016/j.asieco.2005.10.004
- IMF (International Monetary Fund). 2011. ‘Revenue Mobilization in Developing Countries’. International Monetary Fund. Accessed 10 June 2014. http://www.imf.org/external/np/pp/eng/2011/030811.pdf.
- IMF (International Monetary Fund). 2015. ‘Understanding Revenue Administration: An Initial Data Analysis Using the Revenue Administration Fiscal Information Tool’. Fiscal Affairs Department.
- IRS (Internal Revenue Service). 2009. ‘Update on Reducing the Federal Tax Gap and Improving Voluntary Compliance’. Accessed 26 September 2013. http://www.irs.gov/pub/newsroom/tax_gap_report_-final_version.pdf.
- Jackson, Betty R. and Valerie C. Milliron. 1986. ‘Tax Compliance Research: Findings, Problems and Prospects’. Journal of Accounting Literature 5: 125–65.
- James, Simon and Clinto Alley. 2004. ‘Tax Compliance, Self Assessment, and Tax Administration’. Journal of Finance and Management in Public Services 2: 27–42.
- Kaplan, Robert S. and David P. Norton. 1992. ‘The Balanced Scorecard—Measures that Drive Performance’. Harvard Business Review, January–February 1992, Product no. 4096.
- Kaplan, Robert S. and David P. Norton. 2000. ‘Having Trouble with Your Strategy? Then Map It’. Harvard Business Review, September–October: 167–76.
- Kirchler, Erich. 2007. The Economic Psychology of Tax Behavior. Cambridge: Cambridge University Press.
- Kirchler, Erich., Erik Hoelzl and Ingrid Wahl. 2008. ‘Enforced versus Voluntary Tax Compliance: The Slippery Slope’. Framework. Journal of Economic Psychology 29 (2): 210–25. doi: 10.1016/j.joep.2007.05.004
- Kirchler, Erich, Cristoph Kogler and Stephan Muehlbacher. 2014. ‘Cooperative Tax Compliance: From Deterrence to Deference’. Current Directions in Psychological Science 23 (2): 87–92. doi: 10.1177/0963721413516975
- Kirchler, Erich, Stephan Muehlbacher, Barbara Kastlunger and Inggrid Wahl. 2010. ‘Why Pay Taxes: A Review on Tax Compliance Decisions’. In Developing Alternative Frameworks for Explaining Tax Compliance, edited by James Alm, J. Martinez-Vazquez and Benno Torgler, 15–32. London, England: Routledge.
- Kline, Rex B. 2005. Principles and Practice of Structural Equation Modeling. 2nd ed. New York: Guilford Press.
- Kline, Rex B. 2011. Principles and Practice of Structural Equation Modeling. 3rd edition. New York: Guilford Press.
- Klun, Maja. 2004. ‘Performance Measurement for Tax Administrations: The Case of Slovenia’. International Review of Administrative Sciences 70 (3): 567–74. doi: 10.1177/0020852304046210
- Kornhauser, Marjorie E. 2007. ‘A Tax Morale Approach to Compliance: Recommendation for the IRS’. Florida Tax Review 8: 601–40.
- Langham, Jo’Anne, Neil Paulsen and Charmine E. J. Hartel. 2012. ‘Improving Tax Compliance Strategies: Can the Theory of Planned Behavior Predict Business Compliance’? eJournal of Tax Research 10 (2): 364–402.
- Lederman, Leandra. 2003. ‘The Interplay between Norms and Enforcement in Tax Compliance’. Ohio State Law Journal 64: 1453–514.
- Lederman, Leandra. 2010. ‘Reducing Information Gaps to Reduce the Tax Gap: When Is Information Reporting Warranted’? Fordham Law Review 78: 1733–58.
- Lewis, Alan. 1982. The Psychology of Taxation. Oxford: Robertson.
- MacGregor, Jason and Brett Wilkinson. 2012. ‘The Effect of Economic Patriotism on Tax Morale and Attitudes Toward Tax Compliance’. Advances in Taxation 20: 159–80. doi: 10.1108/S1058-7497(2012)0000020009
- Marr, Bernard. 2008. Managing and Delivering Performance. Burlington: Elsevier.
- McKerchar, Margaret. 2003. ‘The Impact of Complexity upon Tax Compliance: A Study of Australian Personal Taxpayers’. Australian Tax Research Foundation. Research Study no 39: 1–223.
- McKerchar, Margaret, Kim Bloomquist and Jeff Pope. 2013. ‘Indicators of Tax Morale: An Exploratory Study’. eJournal of Tax Research 11 (1): 5–22.
- McKerchar, Margaret and Chris. Evans. 2009. ‘Sustaining Growth in Developing Economies through Improved Taxpayer Compliance: Challenges for Policy Makers and Revenue Authorities’. eJournal of Tax Research 7: 171–201.
- Mikesell, John L. and Liucija Birskyte. 2007. ‘The Tax Compliance Puzzle: Evidence from Theory and Practice’. International Journal of Public Administration 30 (10): 1045–81. doi: 10.1080/01900690701221423
- Neuman, W. Lawrence. 2007. Basic of Social Research. Boston, MA: Pearson Education.
- Northrop, Alana and Shelly Arsneault. 2008. ‘Sampling and Data Collection’. In Handbook of Research Methods in Public Administration, edited by Gerald J. Miller and Kaifeng Yang, 214–39. Florida: Auerbach Publications.
- OECD (Organisation for Economic Co-operation and Development). 2001. ‘Tax Ratios: A Critical Survey’. In OECD Tax Policy Studies. Paris: OECD.
- OECD (Organisation for Economic Co-operation and Development). 2004. Compliance Risk Management: Managing and Improving Tax Compliance. Center for Tax Policy and Administration. Accessed 12 September 2013. http://www.oecd.org/tax/administration/33818656.pdf.
- OECD (Organisation for Economic Co-operation and Development). 2008. Taxpayers’ Compliance Monitoring: A Practical Guide Based on Revenue Body Experience. Paris: OECD.
- OECD (Organisation for Economic Co-operation and Development). 2010. Understanding and Influencing Taxpayers’ Compliance Behavior. France, Paris.
- OECD (Organisation for Economic Co-operation and Development). 2013. Co-operative Compliance: A Framework: From Enhanced Relationship to Co-operative Compliance. Paris: OECD.
- OECD (Organisation for Economic Co-operation and Development). 2014. Measures of Tax Compliance Outcomes: A Practical Guide. OECD Publishing. http://doi.org/10.1787/9789264223233-en.
- OECD (Organisation for Economic Co-operation and Development). 2015. OECD Economic Survey: Indonesia 2015. Paris: OECD. http://doi.org/10.1787/eco_surveys-idn-2015-en.
- OECD (Organisation for Economic Co-operation and Development). 2017. Comparative Information on OECD and Other Advanced and Emerging Economies 2017. Paris: OECD. http://doi.org/10.1787/tax_admin-2017-en.
- OECD (Organisation for Economic Co-operation and Development). 2018. OECD Economic Surveys: Indonesia 2018. Paris: OECD. https://doi.org/10.1787/eco_surveys-idn-2018-en.
- Osofsky, Leigh. 2014. ‘Concentrated Enforcement’. Florida Tax Review 16 (6): 325–91.
- Reeson, Andrew. and Simon Dunstall. 2009. ‘Behavioral Economics and Complex DecisionMaking: Implication for the Australian Tax and Transfer System’. In CMIS Report, no. 09/11. Commonwealth Scientific and Industrial Research Organization.
- Richardson, Maryann and Adrian J. Sawyer. 2001. ‘A Taxonomy of the Tax Compliance Literature: Further Findings, Problems and Prospects’. Australian Tax Forum 16: 137–320.
- Ritsatos, Titos. 2014. ‘Tax Evasion and Compliance: From the Neo Classical Paradigm to Behavioral Economics, A Review’. Journal of Accounting & Organizational Change 10 (2): 244–62. doi: 10.1108/JAOC-07-2012-0059
- Rivkin, Jan W. 2004. ‘Where Do Great Strategies Come From?’. Boston, Harvard Business School Publishing Class Lecture. Electronic: HBSP Product Number 9-754-4C.
- Rosid, Arifin, Chris Evans and Binh Tran-Nam. 2016. ‘Do Perceptions of Corruption Influence Personal Income Taxpayer Reporting Behavior? Evidence from Indonesia’. eJournal of Tax Research 14 (2): 387–425.
- Rosid, Arifin, Chris Evans and Binh Tran-Nam. 2018. ‘Tax Non-Compliance and Perceptions of Corruption: Policy Implications for Developing Countries’. Bulletin of Indonesian Economic Studies 54 (1): 25–60. doi: 10.1080/00074918.2017.1364349
- Sandmo, Agnar. 2005. ‘The Theory of Tax Evasion: A Retrospective View’. National Tax Journal 58 (4): 643–63. doi: 10.17310/ntj.2005.4.02
- Scotchmer, Suzanne and Joel Slemrod. 1989. ‘Randomness in Tax Enforcement’. Journal of Public Economics 38(1): 17–32. doi: 10.1016/0047-2727(89)90009-1
- Serra, Pablo. 2005. ‘Performance Measures in Tax Administration: Chile as a Case Study’. Public Administration and Development 25: 111–24. doi: 10.1002/pad.356
- Shah, Rachna and Susan Meyer Goldstein. 2006. ‘Use of Structural Equation Modeling in Operations Management Research: Looking Back and Forward’. Journal of Operations Management 24 (2): 148–69. doi: 10.1016/j.jom.2005.05.001
- Silvani, Carlos. and Katherine Baer. 1997. ‘Designing a Tax Administration Reform Strategy: Experiences and Guidelines’. IMF Working Paper, 97/30.
- Slemrod, Joel. 2019. ‘Tax Compliance and Enforcement’. Journal of Economic Literature 57(4): 904–54. doi: 10.1257/jel.20181437
- Slemrod, Joel, Marsha Blumenthal and Charles Christian. 2001. ‘Taxpayer Response to an Increased Probability of Audit: Evidence from a Controlled Experiment in Minnesota’. Journal of Public Economics 79(3): 455–83. doi: 10.1016/S0047-2727(99)00107-3
- Slemrod, Joel and Shlomo Yitzhaki. 2000. ‘Tax Avoidance, Evasion, and Administration’. NBER Working Paper 7473. http://www.nber.org/papers/w7473.pdf.
- Steenkamp, Jan-Benedict E. M. and Hans Baumgartner. 2000. ‘On the Use of Structural Equation Models for Marketing Modeling’. International Journal of Research in Marketing 17 (2–3): 195–202. doi: 10.1016/S0167-8116(00)00016-1
- Sunstein, Cass R. 2002. ‘Probability Neglect: Emotions, Worst Cases, and Law’. The Yale Law Journal 112: 61–107. doi: 10.2307/1562234
- Tennant, Sandria and David Tennant. 2007. ‘The Efficiency of Tax Administration in Jamaica: An Introspective Assessment’. Social and Economic Studies 56 (3): 71–100.
- Tversky, Amos and Daniel Kahneman. 1974, ‘Judgment Under Uncertainty: Heuristics and Biases’. Science 185: 1124–31. doi: 10.1126/science.185.4157.1124
- Umar, Mohammed Abdullahi and Nyende Festo Tusubira. 2017. ‘Challenges of Tax Administration in Developing Countries—Insights from the 5th Annual Tax Administration Research Center Workshop, 2017’. Journal of Tax Administration 3 (2): 108–23.
- von Soest, Christian. 2006. ‘Measuring the Capability to Raise Revenues Process and Output Dimension and Their Application to the Zambia Revenue Authority’. GIGA Working Papers, no. 35, GIGA-WP-35/2006.
- Walsh, Keith. 2012. ‘Understanding Taxpayer Behavior: New Opportunities for Tax Administration’. Economic and Social Review 43 (3): 451–75.
- Weber, Till Olaf, Jonas Fooken and Benedikt Herrmann. 2014. ‘Behavioral Economics and Taxation’. Taxation Papers. Working Paper, no. 41.
- Wenzel, Michael and Natalie Taylor. 2003. ‘Towards Evidence-Based Tax Administration’. Australian Journal of Social Issues 38: 409−30. doi: 10.1002/j.1839-4655.2003.tb01153.x
- Yong, Sue, Karen Lo, Brett Freudenberg and Adrian Sawyer. 2019. ‘Tax Compliance in the New Millennium: Understanding the Variables’. Australian Tax Forum 34 (4): 766–809.
- Yucedogru, Recep and John Hasseldine. 2016. ‘Understanding Tax Morale of SMEs: A Qualitative Study’. eJournal of Tax Research 14 (3): 531–66.