
Abstract
Indonesia’s new law on fiscal decentralisation, Law 1/2022, begins implementation this year. The legislation makes numerous noteworthy technical adjustments to the intergovernmental fiscal framework. The broader, more implicit intent of the law is clearly to facilitate more central government control over regions. The increased control is operationalised through a variety of standard public finance tools, with a particular emphasis on performance incentives, revenue earmarks and spending mandates. Unfortunately, the design of many of the law’s reforms is rather flawed. Moreover, the legislation does not—indeed, it cannot—address the main underlying problems of decentralisation such as corruption and clientelism. As a result, the law’s interventions are unlikely to satisfactorily realise their intended objectives of improving the distributional equity of transfers across regions and enhancing subnational government tax mobilisation, spending efficiency and service delivery outcomes.
Undang-undang Indonesia yang baru mengenai desentralisasi fiskal, Undang-undang Nomor 1 Tahun 2022 tentang Hubungan Keuangan antara Pemerintah Pusat dan Pemerintahan Daerah (HKPD), dimulai implementasinya tahun ini. Undang-undang ini memberikan seragam penyesuaian teknis yang penting terhadap kerangka kerja fiskal antar pemerintah. Secara lebih luas, tujuan implisit dari undang-undang tersebut adalah untuk memfasilitasi lebih banyak kendali pemerintah pusat terhadap pemerintah daerah. Naiknya kendali tersebut dioperasikan melalui sejumlah alat keuangan publik standar, dengan penekanan khusus terhadap insentif kinerja, peruntukan penerimaan, dan mandat anggaran. Sayangnya, desain dari reformasi undang-undang tersebut cenderung memiliki kelemahan. Undang-undang tersebut juga tidak dan tak mampu menyasar masalah utama desentralisasi, seperti korupsi dan patron politis. Hasilnya, intervensi undang-undang tidak dapat mencapai tujuan awal untuk meningkatkan persamaan distribusi transfer antar daerah dan menambah mobilisasi pajak pemerintah di tingkat daerah, efisiensi anggaran, dan hasil pelayanan publik.
INTRODUCTION
For the greater part of its history, Indonesia had one of the most centralised systems of government in the world. Since the downfall of Soeharto in 1998 and the initiation of its regional autonomy program in 2001, the country’s public sector has become one of the most decentralised anywhere, at least as indicated by the devolution of service authorities (Lewis and Smoke Citation2017). Most such responsibilities have been assigned to the third tier of government—districts—and, in what follows, I will focus attention there.Footnote1 The key elements of Indonesia’s ‘fiscal federalism’—fiscal transfers to districts and district taxation, spending and service delivery—have become vital to the country’s public economic performance.
Aggregate Outcomes
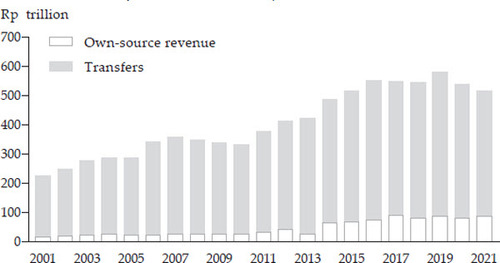
District revenues have grown rapidly since the start of decentralisation. Between 2001 and 2019, intergovernmental fiscal transfers and district own-source revenues increased by a factor of 2.6 in real terms, after which they declined somewhat through 2021 because of the pandemic. Transfers expanded 3.7% per annum while district taxes and charges grew at a rate of 9.0% per year. District own-source revenues are still relatively small, even given strong growth; by the end of the period, they made up only 16.5% of district budgets ().
FIGURE 1 District Own-Source and Intergovernmental Transfer Revenue, 2001–21 (Rp trillion, constant 2010)
Source: Author’s calculations based on Ministry of Finance data.
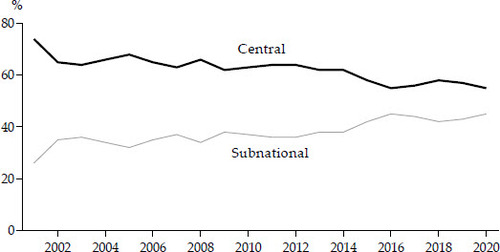
District spending has increased considerably as well, growing more than 4% per year in real terms since decentralisation began. As a result of stagnating central government revenues and spending, rising intergovernmental transfers and district own-source revenue growth, district expenditure as a proportion of total public sector spending rose from around 20% in 2001 to approximately 35% in 2020. Combined, district and provincial (subnational) government spending now makes up about 45% of total government expenditure () and more than half of the total net of central government interest payments and subsidies.
FIGURE 2 Central and Subnational Spending, Percentage of Total, 2001–20
Source: Author’s calculations based on Ministry of Finance data.
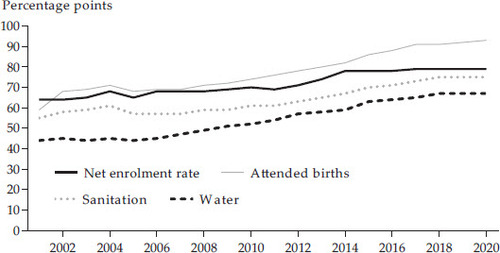
Access to basic local public services has expanded since the start of the regional autonomy program, especially in the education, health and infrastructure sectors. Data from the National Socio-Economic Survey (Susenas) indicate that school enrolment rates across primary and secondary education, the proportion of births attended by a health professional, and household access to water and sanitation facilities have all risen over the past two decades. On average, access to these local services grew by about two percentage points per year between 2001 and 2020 ().
FIGURE 3 Service Access, 2001–20
Source: Author’s calculations based on Susenas data.
Progress in improving the quality of local public services has been less auspicious. In education, between 2006 and 2018, Indonesia’s performance on the OECD’s Program for International Student Assessment (PISA) declined by 19 and 12 points in reading and mathematics, respectively, and rose by just 3 points in science. As of 2018, Indonesia’s average PISA score (382 points) still lagged the OECD average (488) by a considerable margin. Indonesia ranked 71st out of the 77 countries that participated in the 2018 PISA (Lewis Citation2022a). Indonesia’s primary healthcare facilities at the district level (puskesmas) provide inferior-quality services. They have failed to secure critical medicines, and facility practitioners lack basic diagnostic and treatment capabilities. Puskesmas performance vis-à-vis increasingly problematic non-communicable diseases is particularly noteworthy. A recent survey indicates that 96% of puskesmas claim to provide services for the diagnosis and treatment of diabetes, for example, but only 34% of practitioners at those health centres could accurately diagnose the disease and only 35% of patients had their diabetes under control (World Bank Citation2020). Water accessed through local state-owned water companies is not potable and is unlikely to be so for years to come. Most septic tanks are of poor quality and a majority of sludge treatment plants are not fully operational (World Bank Citation2020).
Distributional Results
The distribution of local revenues, spending and service access is uneven across regions.Footnote2 Per capita own-source revenues are reasonably similar across island groups, but per capita transfers and spending are heavily skewed in favour of districts on Kalimantan and Papua, especially, and against districts on Java/Bali, for example. Per capita fiscal resources for districts on Sumatra, Sulawesi and Eastern Indonesia are in the middle range ().
Table 1. Fiscal Resources and Service Access, by Island Group
Average access to local services is considerably higher among districts on Java/Bali and Sumatra and substantially lower on Papua, with service access on Kalimantan, Sulawesi and Eastern Indonesia positioned in the middle of the overall distribution. Annual increases in access are relatively rapid in Papua, in particular, as well as in Eastern Indonesia, suggesting that districts there may be slowly catching up to those elsewhere on the archipelago ().
THE POLICY QUESTION
A critical and ongoing policy debate in Indonesia concerns the extent to which the country’s unique brand of fiscal federalism, the broad aggregate and distributional outcomes of which have been briefly sketched above, has led to sufficient improvements in the quantity and quality of local public services, on average, and across the very heterogenous regions of the country. Many public finance analysts clearly believe that it has not (for example, Lewis Citation2018). In this context, two general problems have been highlighted: (1) insufficient mobilisation of local own-source revenues and the associated dependence of districts on central transfers and (2) failure of the intergovernmental system to adequately equalise fiscal resources across districts and support local spending efficiency. Besides these ‘technical’ defects in the intergovernmental framework, other researchers have stressed the importance of governance-related constraints to improving local fiscal and service outcomes, especially corruption (Olken Citation2006; von Luebke Citation2009; Mietzner Citation2015; Lewis and Hendrawan Citation2019) and clientelism (Aspinall and Sukmajati Citation2016; Aspinall and Berenschot Citation2019; Dong and Lewis Citation2023).Footnote3
Against this backdrop, on 5 January 2022, Indonesia promulgated Law 1/2022 on Financial Relations between Central and Regional Governments (HKPD). The Ministry of Finance took the lead in drafting the new legislation. The National Development Planning Agency (Bappenas), the Ministry of Home Affairs and several important line agencies (especially the ministries for education and culture, health and public works) reviewed early drafts of the law and made significant inputs. The draft legislation was also discussed with provinces and districts, although it seems they had little influence over the process and outcomes. Finally, the draft law was intensely debated and negotiated in the national parliament (DPR).
Nearly 20 years in the making, the new law governs the full range of fiscal decentralisation issues, including intergovernmental transfers and subnational taxation, finance, spending and service delivery, among others. It replaces Law 33/2004 HKPD and Law 28/2009 on Regional Taxes and Charges, and (with some important exceptions) takes effect this fiscal year (2023). Formally, Law 1/2022 intends to (1) develop an efficient system of (subnational) taxation, (2) minimise vertical (central-subnational) and horizontal (among provinces and districts, respectively) fiscal imbalances, (3) support improvements in the quality of subnational spending, and (4) harmonise fiscal and financial relations between central and subnational governments to optimise subnational public service delivery.
In this Survey, I describe and assess the major elements of the new decentralisation law, focusing especially on its objectives related to improving district own-source revenue generation, the design and distribution of intergovernmental fiscal transfers, district borrowing and savings, and district spending. To provide context, I begin with a review of recent macroeconomic developments in Indonesia and then turn my attention to Law 1/2022.
MACROECONOMIC DEVELOPMENTS
Economic Growth
Indonesia ended 2022 with a 5.3% GDP growth rate, well above its pre-pandemic trend of 5.0% (). The economy did not grow as quickly as those of Vietnam (7.2%), the Philippines (6.5%) or Malaysia (6.4%), but grew faster than those of all other countries in East Asia (World Bank Citation2022b). Most analysts predict a slight downturn in Indonesia’s economic growth for 2023, with estimates ranging from 4.7% to 5.1% (Ministry of Finance Citation2022).
FIGURE 4 GDP Annual Growth (%), 2016–22
Source: BPS (Statistics Indonesia).
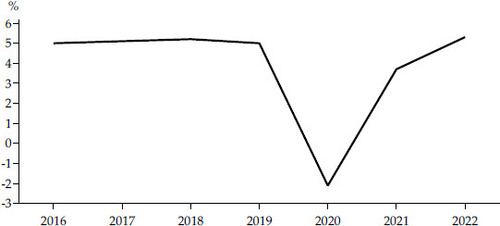
Overall, the economy has weathered the crisis well—the 2020 decline in growth was not too steep and its return to ‘normal’ rates of economic growth took only two years. The challenge now facing the country is to sustain annual growth at 5% (or higher ) to improve welfare for the majority of Indonesians (Resosudarmo and Abdurohman Citation2018). This may prove difficult, at least in the short to medium term, as the global economy faces an uncertain period with several significant downside risks (Khadan and Hill Citation2023).
Exports maintained their strong performance in 2022, with a Q4 year-on-year growth rate of 14.9% while imports grew 6.3% in Q4 year on year, a significant decline from the previous quarter. Exports continued to benefit from strong international commodity prices, while the quarterly downturn in import growth reflected consumers winding up their splurge on long-deferred purchases. Government spending was a drag on overall growth at –4.8% over the same period, as unsustainably high and temporary stimulus spending continued to be cut back. Transport and storage and accommodation and food services grew quickly at 17.0% and 13.8%, respectively, a direct result of the continued improvements in household mobility. Business services also rebounded well with a growth rate of 10.4% ().
TABLE 2 Components of GDP Growth (%, constant 2010)
Eastern Indonesia continues to grow significantly more quickly than the rest of the country. Maluku and Papua, and Sulawesi, exhibited very high 2022 gross regional domestic product (GRDP) growth rates of 8.7% and 7.1%, respectively. Solid economic growth in these two cases is mostly a function of strong performance in the mining sector (Ministry of Finance Citation2022). These regions’ contribution to overall economic growth is relatively small, however, at just 9.5% combined. Economic growth on Java met the country’s average of 5.3%, while GRDP growth rates on Bali, West Nusa Tenggara and East Nusa Tenggara; Kalimantan; and Sumatra were further behind at 5.1%, 4.9% and 4.7%, respectively. Java contributed 56.5% to overall growth while the latter three regions contributed 2.7%, 9.2% and 22.0% to overall economic growth ().
Table 3. Regional Economic Growth
INFLATION AND INTEREST RATES
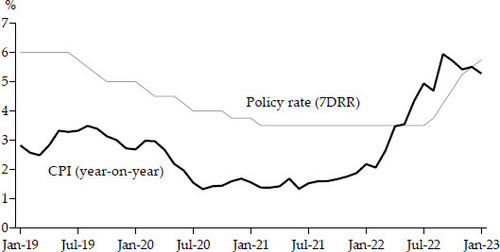
Inflation declined from a high of 6.0% in September to 5.4% in November (). The decrease was largely a function of moderating food prices (LPEM/FEB Citation2022). Inflation ticked up to 5.5% in December, contradicting market expectations, before moderating slightly to 5.3% in January. The rate of inflation has now exceeded the Bank Indonesia (BI) target range of 2%–4% for eight consecutive months. BI increased its policy rate by 50 basis points in each month from September to November but slowed its rate hikes to 25 basis points in both December and January, expecting that inflation would continue to decline. The BI policy rate (the seven-day reverse repo rate) now stands at 5.75%.
FIGURE 5 Inflation (%, year on year ) and Bank Indonesia Policy Rate (% p.a.)
Source: Bank Indonesia.
NATIONAL BUDGET
In 2023, the national budget has returned to pre-crisis normality, at least for now (Anas et al. Citation2022) (). Domestic revenues are expected to increase by 8% relative to last year’s estimated out-turn, largely as a function of a strong growth in income, value-added taxes and state-owned enterprise profits, and net of expected decreases in international taxes and natural resource revenues. Central government spending is anticipated to decline by 3% from last year’s levels, mainly based on decreases in ‘other’—that is, pandemic-related expenditures—net of rising personnel and materials spending, and increasing interest charges and (non-energy) subsidies. Reducing the latter remains an ongoing challenge for government.
TABLE 4 State Budget, 2019–23 (Rp trillion)
Transfers to regions and villages are anticipated to grow by just 1% over last year, bringing the total amounts back to 2019 levels in nominal terms.Footnote4 Both planned shared tax and non-tax revenue and specific-purpose grants are expected to decrease moderately, while the general-purpose transfer is budgeted to rise by a similar percentage. Planned fiscal incentive grants and village funding are both expected to increase, while special-autonomy funds are expected to decline.Footnote5 Note that transfers to regions make up around 25% of the total expenditure budget but over 35% of spending net of interest charges and subsidies. The budget deficit has been compressed to 2.85% of GDP, thereby satisfying the 3% fiscal deficit rule for the first time since 2019.
THE NEW FISCAL DECENTRALISATION LAW
District Own-Source Revenues
Local taxation plays a key role in decentralised systems of governance. Theory suggests local taxes can lead to two positive outcomes. First, local governments may spend more efficiently in the delivery of public services when they rely on the revenues that they generate themselves to fund expenditures. Second, residents may be more likely to hold their local government officials accountable when spending is derived from local taxes and charges that they pay (Martínez-Vázquez, Lago-Peñas and Sacchi Citation2017; Lewis Citation2022b). Both together might be expected to lead to the delivery of more and higher-quality local public services demanded by citizens.
Local own-source revenues are relatively inconsequential in Indonesia. As noted above, district taxes and charges currently make up only 16.5% of total revenue budgets, on average. The implied over-reliance on transfers to fund district spending constrains the efficient and accountable delivery of local services (Lewis Citation2017). With a view to increasing district own-source revenues, the new decentralisation law makes three noteworthy changes.
First, the law increases the urban and rural property tax rate from 0.3% to 0.5% of the estimated sales value (NJOP). Second, it aggregates a number of heretofore individual district taxes—on hotel sales, restaurant sales, parking fees, entertainment venue sales and electricity use—into a ‘final consumption tax’. The general idea in this case is that collapsing individual taxes into a single tax will create administrative efficiencies, thereby freeing up district officials to expand collection efforts and generate more revenue (perhaps from other tax instruments). Third, the law reconfigures provincial tax revenues on motor vehicle ownership and change of title of motor vehicle ownership, which had been shared with districts, into local ‘piggyback’ taxes, whereby districts can raise rates on those provincial administered taxes by 66% and recoup those revenues as their own ().
Table 5. District Tax, User Charge, and Revenue Sharing Rates (%)
The rise in the allowable property tax rate is useful given its current level, which is low by international standards (Lewis Citation2003a). Whether the new rate will have the desired effect of raising own-source revenues remains to be seen. Part of the answer to that question depends on whether districts do, in fact, increase rates to levels now allowed by law. The average property tax rate across all districts is currently 0.22% and only 25% of districts fix rates at the maximum level of 0.3% (World Bank Citation2022a), so there is some doubt about the extent to which districts will take advantage of the new higher rates. Moreover, the law sets a new ‘assessment ratio’ (which is multiplied by the NJOP to create the effective tax base against which the tax rate is applied) at between 20% and 100%. This leaves open the possibility that some districts will opt for assessment ratios less than the maximum, thereby reducing their property taxes, all else being equal (Lewis Citation2007b).
It is not clear that the newly constructed final consumption tax will lead to the desired efficiencies. The instruments comprising the new tax may all need to continue to be administered individually, given the numerous tax base exclusions and tax rate exceptions for most of the revenues that make up the consumption tax. Also, as can be seen in , the base consumption tax rate is lower than the previous rates for some of the now included taxes, implying that overall revenue from the new tax may be smaller than the sum of revenues from the individual taxes before the new law, all else remaining the same.
Finally, it must be pointed out that the two newly created ‘piggyback’ taxes are not really piggyback taxes at all, at least as usually defined. That is, the new taxes do not provide districts with any control over rates, which such taxes always do. The piggyback rate is simply fixed in law at 66% for both (that is, of the respective provincial tax rates). Although the law explicitly refers to these revenues as ‘piggybacks’ (opsen), they are not since they do not give districts rate authority. They are simply another form of revenue sharing.
It must be concluded, therefore, that these three initiatives are unlikely to result in a noteworthy rise in district own-source revenues. The consequence of this outcome is that the potential benefits of increased local taxation, as described above, will probably not emerge.
The new law makes two additional changes of note regarding district taxation. First, it intends to create incentives for the generation of local own-source taxes through the means by which such revenues are treated in the new equalisation transfer (DAU) formula. I discuss this in the next section of the paper. Second, the law insists that districts earmark some of their revenues for particular types of spending. More specifically, forthcoming regulations indicate that at least 10% of revenues from the groundwater tax, the electricity tax component of the consumption tax and the motor vehicle ownership ‘piggyback’ tax must be allocated for spending to improve access to and the quality of water, expand street lighting, and increase the maintenance of and investment in local public transport, respectively.
The consensus among economists is that earmarking may result in efficiency gains if it meets two conditions: (1) the earmarked taxes are paid by residents who directly benefit from the spending to which the revenues are linked; and (2) the earmarked taxes fully fund expenditures on the service in question, so that a change in earmarked revenues necessarily results in a change in associated expenditures (Bird and Jun Citation2005). The first is the well-known benefit principle in taxation. The second is essential to avoid problems related to the fungibility of other revenues, as might be the case, for example, when earmarked revenues rise but local governments reduce funding for the linked expenditure from (other ) general revenues, resulting in ambiguous changes in spending on the targeted service. The earmarks described in the paragraph above might possibly meet the benefit principle, but they do not avoid problems of fungibility, since it is improbable that the 10% allocations would fully fund the services in question. Another issue concerns the doubt that the Ministry of Finance will be able to effectively monitor and enforce district adherence to the mandated earmarks. While the recently adopted ‘chart of accounts’ at the local level is meant to explicitly link individual sources of district revenue to district spending on functions, it is not clear that it will do so in practice, given the immense complexities of the new accounting and reporting systems.Footnote6
Intergovernmental Transfers
Intergovernmental fiscal transfers are typically the most important source of funding for subnational governments, especially in developing countries. There are several different types of transfers, including national revenue sharing and general- and specific-purpose grants. Intergovernmental fiscal transfers intend to achieve a number of different objectives. The four most commonly stated objectives for intergovernmental transfers are adequacy, equity, efficiency and performance. Adequacy refers to addressing vertical imbalances between levels of government (assuring that each subnational level has sufficient funds to deliver on its responsibilities); equity relates to accommodating horizontal imbalances (equalising net fiscal capacities across subnational governments at a particular level); efficiency is linked to the idea of preserving an ‘internal common market’ (for example, guaranteeing that all subnational governments at a certain level have enough money to deliver a minimum standard of services, thereby encouraging the efficient flow of labour, capital and goods across borders), addressing spatial spillovers and other externalities, and promoting the efficient use of inputs and the delivery of outputs demanded by citizens; and performance refers to transfers that encourage any of the many ‘results’ that the central government would like to promote (Boadway and Shah Citation2007; Lewis Citation2021).
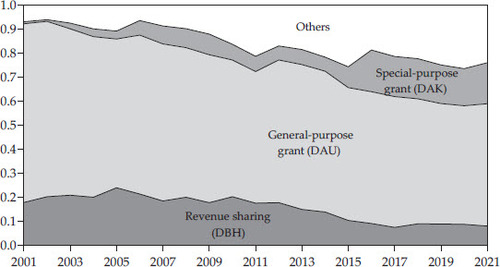
Indonesia’s transfer system attempts to address all of these objectives. To do that, three main types of transfers have been designed: revenue sharing, a generalpurpose transfer and several specific-purpose grants. As noted above, transfers dominate district budgets. The relative significance of various transfers has changed since 2001, with revenue sharing and the general-purpose grant declining in importance, and special-purpose grants and other transfers (special-autonomy funds and provincial grants) rising in significance ().Footnote7
FIGURE 6 Relative Importance of Various Transfers in District Budgets, 2001–21
Source: Author’s calculations based on Ministry of Finance data.
Shared Revenues
Shared revenues comprise those derived from national tax and non-tax revenues. Officially, the main purpose of all shared revenues is to reduce vertical fiscal gaps. However, there is, or at least was, a political objective as well. Shared non-tax (natural resource-based) revenues were originally developed when the intergovernmental system was first being redesigned after East Timor seceded; the aim was to weaken the successionist tendences of resource-rich provinces, especially Aceh and Papua, and, to a lesser extent, East Kalimantan (Lewis Citation2014). The relative importance of revenue sharing has declined over the years. Shared revenues have decreased from around 20% of total district revenue budgets at their peak in 2005 to just over 6% at present. Law 1/2022 makes a number of changes to government’s revenue sharing program, some of which are quite important.
The new law stipulates that the pools of finance for shared revenues are derived from national revenues realised in the previous year, a change from past practice whereby the pools were based on current year projected revenues (subsequently adjusted to match realisations). Income and property taxes continue to be shared with regions, as before, although the latter now comprise only those from the forestry, mining and estate sectors, since urban and rural property taxes were decentralised to districts starting in 2011. In addition, the shared revenues based on changes in property title (property ownership) no longer exist, as these revenue sources have also been decentralised to districts. Shared non-taxes include those for forestry, minerals and geothermal mining, fisheries, and oil and gas, all as before. In addition, government has introduced a new shared non-tax revenue for oil palm. This did not appear in Law 1/2022 but was initiated in the budget law for 2023.
The allocation of shared revenues is based on the principle of ‘derivation’, whereby revenues are returned to the provincial ‘point of origin’—that is, the location where they were generated in the first instance—and then shared between those originating provinces and the districts within their boundaries. One change in the new law is that revenue sharing now distinguishes between provinces that do and do not border the sea, which influences allocations at the district level in the respective types of provinces. (There is no indication in the law as to the purpose of this distinction.) There have been only minor changes in the amounts shared across provinces and districts in the aggregate. The most noteworthy difference concerns how revenues are shared among districts within producing provinces. In this context, the new law now distinguishes among producing districts, districts that share borders with producing districts, districts that are engaged in processing the raw materials related to the shared revenues and all other districts (see appendix ). The new allocations to districts bordering on originating districts are meant to address unspecified negative externalities (spillovers), while those to processing districts are intended to reward their role in adding value to the final good for domestic consumption or trade.
As noted above, revenue sharing has declined in importance over the years and so the instrument’s contribution to closing vertical fiscal gaps has become more limited. Other transfers have increased in magnitude, however, and this has helped to compensate for the revenue sharing’s decline. As regards the transfer’s more political objective, the overall decrease in the magnitude of shared revenues is not likely to encourage successionist tendencies, which in any case appear to have become more muted over the years.
Government has also structured incentives into the allocation procedures to encourage subnationals to improve their general performance and introduced new earmarks for some shared revenues. Regarding the first, government asserts that it will allocate 90% of the shared revenues according to the principles outlined above, while 10% of the distributions will be based on district performance. Forthcoming implementing regulations suggest that performance related to ‘preservation of the environment’, especially as related to the quality of air and water, will be the focus, without further elaboration. This is a significant change to policy. However, without more detail, these performance incentives are difficult to evaluate. Still, based on past experience, government capacity to design and implement the incentive programs must be considered suspect. An initial question in this context relates to whether districts have direct control over ‘environmental preservation’, given the importance of spatial spillovers in the relevant sectors.Footnote8 Concerning the second, the new law stipulates that shared tobacco excises should be spent to improve the wellbeing of the population, reforestation shared revenues should be used to support the preservation of forests, and shared oil palm revenues should be spent on building infrastructure in the sector. These provisions are too vaguely put to assess in any precise manner, but it seems doubtful that the earmarks would meet the necessary efficiency conditions. As before, the central government’s ability to monitor and enforce district adherence to the required earmarks is also questionable.
General-Purpose Transfer
The objective of the general-purpose transfer (DAU) is to equalise fiscal capacities across districts, after accounting for differential costs. While the DAU declined from approximately 70% of total revenue budgets in 2001 to just greater than 40% at present, it is still the largest single source of revenue for districts by a significant margin. Law 1/2022 makes a number of major changes to the design and allocation of DAU transfers ().
Table 6. DAU Allocations, Law 33/2004 and Law 1/2022
First, the law expunges the fiscal rule whereby the total pool of finance for the DAU in the budget was fixed at 26% of national revenues (net of amounts already shared with subnational governments). In the future the pool will be determined in an ad hoc manner, year to year, based on government’s assessment of local service needs, national fiscal capacity, other intergovernmental transfer allocations and national development targets.
Second, while the previous pool shares for subnational governments remain the same (that is, 14.1% and 85.9% for provinces and districts, respectively), both provincial and districts pools will now be further disaggregated by island ‘cluster’: Java and Bali; Sumatra; Kalimantan and Sulawesi; and Nusa Tenggara, Maluku and Papua. Ministry of Finance officials indicate that cluster shares will be based on an equal weighting of population size and land area. In 2023, cluster shares for districts are 34%, 27%, 23% and 16%, respectively.
Third, the long criticised ‘basic allocation’ has been eliminated from the DAU allocation formula, meaning that general grant distributions are now just a function of the district fiscal gap (the difference between district fiscal needs and fiscal capacities). Previously, the basic allocation, which was determined as a function of district personnel spending and presumably created an incentive for such spending, accounted for nearly 50% of total allocations.
Fourth, the estimation of district fiscal needs is now based on district expenditures per ‘client’ and not expenditures per district as before. So-called clients vary by sector. The law specifies that in 2023 these clients are student population, total population, road length (and quality), and total population for education, health, infrastructure and all other sectors, respectively. This indicates that fiscal equalisation will be based on ‘capitation’ norms as opposed to the district norms used in prior years. That is, the DAU for the most part now focuses on the equalisation of per capita fiscal capacities and not per district fiscal capacities.
Fifth, the factors (operationalised with weights in the formula) used to adjust preliminary fiscal needs estimates have changed. Factors now include those for construction costs and population densities as well as those for district characteristics related to island status, tourism, forestry conservation and food security. Although the law does not say so explicitly, government officials report that district personnel spending will also be included among the adjustments, indicating that the ‘basic allocation’ has not been totally eliminated.
Sixth, the fiscal capacity element in the gap formula is to be derived as a function of potential own-source revenues and actual shared revenues and non-capital, specific-purpose grants. Potential own-source revenues will be estimated based on a simple regression of own-source revenues against GRDP (and perhaps other variables), where the predicted value of the dependent variable from the estimated equation is meant to indicate ‘potential’.
Seventh, and perhaps most significantly, the DAU will now be divided into ‘general’ and ‘specific’ funding components. The size of the general component for each district will be derived as a function of its performance in attaining minimum service standards (MSS) and similar outcomes, as assessed by the Ministry of Finance. The better a district performs, the larger its general portion will be. MSS and related benchmarks for education include average years of education, net enrolment rates, average school leaving year, percentage of qualified teachers and classroom quality; for health they are life expectancy, attended births, child immunisation rates and child stunting; and for infrastructure they comprise household access to improved water and sanitation, road condition, electrification rates, and quality of phone and internet signals. Districts will have complete discretion over spending the general component funds. The amount of the specific component is determined as a residual—that is, total district DAU allocations minus the general funds portion of the transfer. Ministry of Finance officials have indicated that the specific component of the DAU comprises about 30% of total allocations in 2023. These revenues are earmarked for spending to support non-permanent civil servants and on education, health and infrastructure activities, all with a view to improving performance against minimum service (and related) standards.
Finally, it is important to note that the law introduces a ‘hold-harmless’ provision, which stipulates that district DAU allocations cannot be smaller in the current year than they were in the previous year (in nominal terms). The hold-harmless condition endures for a period of five years. Effectively this means that most of the new pool and allocation procedures outlined above will influence distributions only at the margin, at least until 2028. What matters most in the short term is how much DAU districts received last year. However, the hold-harmless requirement does not impinge on the implementation of government’s policy to separate DAU allocations into general and specific components and the associated earmarking requirements for the latter, which begins implementation this year.
From a public finance perspective, the new DAU policy offers a mixture of positive and less-than-positive changes. The removal of the basic allocation from the main distribution formula is helpful since it eliminates the apparent incentive for districts to unduly expand their wage bills. This constructive change is mitigated, however, by including district personnel spending as an adjustment factor in the formula, which rewards such spending. The move towards a per capita basis for equalising fiscal resources across districts is beneficial as it will help correct the long-standing bias in the distribution of transfers against populous (and urbanised) districts (McLeod and Rosdaniah Citation2018; Lewis and Smoke Citation2017). The new approach should improve the transfer’s ability to address horizontal imbalances. Estimating fiscal capacity based on potential own-source revenues may be helpful in addressing the apparent disincentive to mobilise local own-source revenues, although, in the end, this will depend on the exact methods used by Ministry of Finance technocrats to estimate potentials, and the extent to which district officials understand the embedded incentives and act on them to increase revenues. In this context, it may be useful to note that an earlier attempt by the Ministry of Finance to use potential own-source revenues in the DAU allocation formula (in 2006) in the way advocated in the new law was met with much confusion and derision by district officials and the policy was discontinued the very next year. The inclusion of non-capital specific-purpose grants in the measure of fiscal capacity is positive, as this will provide a fuller picture of district fiscal capacities and thereby moderate horizontal imbalances.
The removal of the 26% fiscal rule for fixing the DAU pool of finance will increase uncertainty about transfer magnitudes year to year, making planning more difficult for districts. It could also be used by government to force decreases in intergovernmental funding for districts in the long run, at least after the holdharmless condition has expired. Such a reduction has many advocates among some anti-decentralisation central officials.
The usual motivation for clustering local governments in an equalisation formula is to allow for a differential application of cost factor adjustments. It is not clear that this is the intent of island-based clustering procedures adopted in the new law. In any case, the main problem with island clusters derives from the weights used to determine pool shares. When both population and area are employed as weights, as the law indicates is the case at least for this year, more populous districts are given short shrift in allocations. This defeats the DAU’s main objective of equalising fiscal capacities on a per capita basis. For example, while districts on Java/Bali make up nearly 60% of the total population, they will receive only 34% of total allocations according to the new procedures. The introduction of other adjustment factors, such as those for tourism, forestry conservation and food security, is not useful. Adjustment factors are meant to indicate cost differentials, and these factors do not do that. The adjustments will provide more funding for targeted districts, of course; yet, if that was the intent, it would be better handled with specific-purpose grants rather than a general grant, which is a rather blunt instrument to achieve this particular objective. These adjustments also make an already complicated distribution formula even more byzantine.
Finally, the new provisions to divide the DAU into general and specific components are quite problematic. The performance criteria used to determine the relative amounts of funding for the two separate grants are, in some cases, poorly chosen. Many of the district performance standards, such as life expectancy, child stunting, access to electricity, and phone and internet strength, are not under the (full) control of districts and are, therefore, improper. Others, such as average years of education of residents, change very slowly over time and offer little indication of improvements in district performance year on year. More broadly, all those performance standards that are measured with Susenas data will be very unreliable year to year because of small survey sample sizes (Lewis, McCulloch and Sacks Citation2016). In addition, the earmarks associated with the specific-grant portion of the DAU do not fare well by the widely accepted efficiency criteria discussed above. They do not satisfy the benefit principle, nor do they avoid problems associated with fungible revenues. One assumes that this new policy may have been motivated by Ministry of Finance officials’ belief that districts do not allocate their general-purpose funds properly in budgets and/or spend them efficiently. This policy assumes that the central government knows better how funds should be allocated and that the earmarks operationalising their preferences will work properly to increase efficiency. It seems unlikely that Jakarta-based bureaucrats could know better how districts across the diverse archipelago should allocate their funds, and, in any case, the earmarks probably will not achieve their stated objectives because they are so poorly designed. Further, the policy assumes that the performance incentives embedded in the new allocation scheme will encourage districts to spend more efficiently. Some districts will make progress against the selected standards and receive relatively larger general grant shares, but it may not have much to do with districts’ actual service delivery performance given their lack of influence over the chosen targets and the difficulty in measuring and monitoring many of the standards.
The overall effect of the above complex changes to law on the DAU’s main objective of equalising district fiscal capacities is uncertain and will have to await further analysis. What is clear, however, is that the equalising effects of adopting a per client norm in the allocation formula will be mitigated to a very large extent by procedures to cap allocations by island groups. In any case, the relative size of distributions across districts will not change much in the short term because of hold-harmless procedures. The final impact of changes to the law on equalisation will have to wait until all provisions are fully implemented, beginning in 2028.
Specific-Purpose Transfers
The special-purpose transfer (DAK) comprises both capital and non-capital grants. Starting this year, the DAK also includes the hibah (grant), which had been classified elsewhere previously. All DAK transfers are intended to improve district efficiency. The capital DAK is meant to increase spending on infrastructure with a view to improving service outcomes and, in particular, meeting minimum standards of service delivery, while at the same time addressing benefit spillovers across districts. The non-capital DAK is intended to improve the efficiency of input use, especially in the education and health sectors—teachers and healthcare workers. The hibah is often employed to on-grant bilateral and multilateral agency ‘outputbased’ transfers and loans to central government. The DAK has grown significantly in importance since government’s decentralisation program was initiated. In 2001, the DAK made up less than 1% of district budgets while its budget share at present is about 13%. Law 1/2022 does not make many substantial changes to the design and distribution of the DAK, at least compared with the changes made to other transfers, as discussed above.
The new law does change the relative emphasis of DAK objectives, however. In this context, the grant is now meant to focus more forcefully on addressing national priorities and performance shortfalls in local service delivery, among others. This is consistent with government’s new attention to strengthening the accountability of districts to central government and on the enhanced use of performance incentives, as seen for other transfers.
A number of concerns have been raised about the capital DAK over the years. Three issues are particularly prominent. First, the DAK has become increasingly fragmented over time. In 2001, the grant covered just three sectors—education, health and infrastructure. In 2023, the DAK is spread across 18 sectors, many of which will be further divided into subsectors. Fragmentation makes district capital planning difficult and results in smaller capital projects on average (Lewis Citation2013). The new law has not dealt with DAK fragmentation. Second, since 2017, DAK allocations have been based on proposals from the districts (at the insistence of President Joko Widodo, based on his experience as mayor of Solo). The concern here is the extent to which government can manage to adequately assess over 10,000 proposals annually. In the run-up to the new law, there was some discussion about returning to top-down distribution methods to overcome this problem, but the idea was eventually rejected, in part because the president still favours the proposal-based approach. Finally, DAK allocations are well known to be subject to manipulation by the DPR. A recent review of the DAK by Indonesia’s Supreme Audit Agency found Rp 31.3 billion in ‘problematic allocations’ over the period 2017–19, an amount that represents about 6% of total allocations across those years. Most of these were either related to DPR budget committee requests for increased distributions to some districts, which were made without clear rationale and/or allocations that exceeded the districts’ proposed amounts (Sumando Citation2022). Of course, a law drafted by government and approved by the DPR would not be expected to confront the latter’s rent seeking. Nevertheless, the DPR’s untoward influence over DAK distributions suggests that Ministry of Finance efforts to allocate the grant to help satisfy national priorities and improve district service delivery may not go as well as planned.
District Finance
Public capital assets are needed to support local service delivery and economic development. Borrowing is both an efficient and equitable means for local governments to invest in capital development. Significant amounts of money are needed for capital projects and the created assets have long, useful lives. It is more economically efficient to borrow money now to satisfy present demand than it is to wait until adequate funds can be accumulated over time. Borrowing for capital development is also equitable, since those who use the generated services can be made to pay for them over the course of a project’s life (Lewis Citation2003b).
Fiscal reserves—the accumulation of annual surplus revenues—are another source of local finance. Although reserves can be employed to finance capital development, their use in this context is typically more limited, since available reserves are usually smaller in magnitude relative to those that can be borrowed. The main purpose to which fiscal reserves are put is to stabilise budgets—that is, to cover unexpected deficits during economic downturns.
Law 1/2022 makes some changes to the rules governing both district borrowing and the accumulation and use of local fiscal reserves. While districts have long been allowed to borrow from various financial institutions and issue (conventional) bonds, they will now also be permitted to issue ‘Islamic bonds’ (sukuk). Sukuk are Islamic-compliant financial certificates that provide investors with partial ownership of assets purchased with invested funds. The Ministry of Finance has made significant use of ‘green sukuk’ to invest in railways and solar power projects, among others, and to help finance the budget deficit. The new law provides few details about how sukuk would work at the local level.
Law 1/2022 stipulates that high service delivery performance districts with significant fiscal reserves should use those reserves under their discretion to develop local ‘sovereign wealth funds’. These wealth funds are intended to generate local ‘cross-generational’ economic and social benefits. However, the Ministry of Finance will specifically direct low performing districts with substantial reserves on how to employ their reserve funds to invest in infrastructure with the objective of stimulating local economic development. The law does not specify how district ‘performance standards’ and ‘substantial reserves’ will be measured.
The problem with district borrowing is that there is not enough of it. Districts have made very limited use of borrowing in any form to finance capital development over the years, preferring instead to rely on capital grants from the central government (Lewis Citation2007a). The vast bulk of district capital spending is financed from recurrent revenues of various kinds, the sum total of which is barely sufficient to keep pace with the depreciation of local fixed assets (Lewis and Oosterman Citation2011). While permission to use Islamic bonds to finance capital development may be appropriate in a Muslim majority country like Indonesia, it seems unlikely that the availability of sukuk will kickstart long-moribund, local-borrowing practices. As such, the depreciation of district public capital assets is likely to continue, with negative consequences for local service delivery and economic development. The latter is especially discouraging given risks associated with sustaining national economic growth in the short to medium term, as mentioned above.
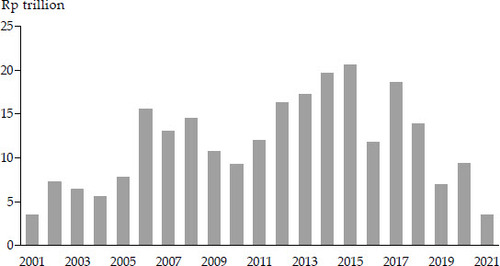
Ministry of Finance officials have long obsessed over subnational fiscal reserves, which they believe are too large (Lewis and Oosterman Citation2009). Nevertheless, an examination of district savings and time deposits—a reasonable and frequently used proxy for fiscal reserves—suggests that reserves are not really excessive. The total magnitude of reserves has fluctuated over the years, as might be expected (). Fiscal reserves started at very low levels in 2001, reached a maximum in 2015 and declined rather steadily afterwards through 2021. However, even at their peak in 2015, fiscal reserves amounted to only 4% of total district revenues. Over the entire period, fiscal reserves averaged just 2.8% of total district budgets, a figure that is well below best practice norms among subnational governments in the US, for example, which typically suggest that states and municipalities should hold at least 5% of their annual revenue or expenditure budgets in fiscal reserves (Tax Policy Center Citation2022). Note that in 2021, when district revenues decreased substantially because of the pandemic, districts drew down on their savings to prop up spending at previous years’ levels, just as the principles of ‘rainy day funds’ would have them do. While district behaviour regarding the accumulation and use of fiscal reserves obviously varies across the country, and some districts probably save too much and/or employ their reserves improperly, this section of the law seems more of a solution to a problem that does not generally exist.
FIGURE 7 District Fiscal Reserves, End of Year, 2001–21 (Rp trillion, constant 2010)
Source: Bank Indonesia.
DISTRICT SPENDING
An important question concerns how districts allocate their fiscal resources in expenditure budgets and how efficiently they spend those resources in the delivery of public services. The Ministry of Finance has long been unhappy with how districts allocate their funds across expenditure items. In recent years, the ministry has attempted to address this issue head-on by employing spending mandates, which insist that districts allocate a certain percentage of their total budgets to identified functions. In this regard, the ministry has obliged districts to spend a minimum of 20% of their budgets on education and a minimum of 10% on health. Law 1/2022 specifies two additional mandates, one for infrastructure spending and another for personnel spending—that is, the district wage bill. The first one requires districts to spend at least 40% of their total revenues (net of transfers to villages within their jurisdictions) on infrastructure activities. With this new provision, the central government now essentially mandates 70% of total district spending. The second mandate instructs districts to spend no more than 30% of their budgets on civil servant wages and allowances. The law stipulates that fiscal sanctions, in the form of delayed or reduced transfer payments (for those transfer amounts not already earmarked), will apply to districts that do not comply. According to the law, the new spending mandate provisions do not take effect until 2028.
There are a number of difficulties with these spending mandates, two of which are most noteworthy. The key problem concerns the way in which mandates are constructed (based on budget shares). Many countries, especially large and decentralised ones, employ spending mandates, but the vast majority of them fix mandates in capitation terms (spending per capita, per student, per patient, etc.). So, for example, spending mandates in education would require that all local governments spend at least a certain amount per student (adjusted for cost differentials, perhaps) where the specified amount is determined as that which assists local governments in attaining some minimum standard of education. Similar approaches apply to other sectors. But, in Indonesia, budget shares are a poor proxy for spending in capitation terms because of the very unequal way that transfer revenue—and thus spending—is allocated across districts. As an example, take two districts, Kutai Barat (Kalimantan Timur ) and Kota Jambi (Jambi). The former spends 9.6% of its budget on health, just missing the target, while the latter spends 10.4% of its budget on health, barely exceeding the mandate. However, because of unequal distribution of transfers, Kutai Barat spends Rp 834,000 per capita on health and Kota Jambi spends Rp 197,000.Footnote9 Still, according to the rules, the former is in breach of the mandate while the latter is not.
The second problem concerns the exact budget shares targeted for minimum or maximum spending. How did the Ministry of Finance arrive at these shares? The rationales are very unclear. Take the new maximum personnel spending share as an example. The current average district personnel spending share is 37%. This is just lower than the global average for local governments (38%) and smaller than the relevant figure for other large comparable developing countries such as Mexico (39%) and Brazil (42%) (World Bank Citation2022a). So, on average, district personnel spending would not seem to be much different from that of other places. Of course, there is significant variation in personnel budget shares across districts. Recent data indicate that such spending shares range from around 10% to 55%. This suggests the possibility, at least, that some districts allocate too much to personnel spending. But districts with higher budget shares are those with larger populations and lower spending per capita, a result that derives from perverse transfer allocations. Those districts that exceed the target actually have fewer civil servants and lower personnel spending in per capita terms than their counterparts that satisfy the target (World Bank Citation2022a). The new rule would force the former places to cut staff and spending while leaving the latter alone.
Districts may adhere to the new spending mandates, especially in the face of sanctions for not doing so. But, given their perverse design, mandates are not likely to lead to the desired improvements in service access and quality. Recent research shows, for example, that the government’s education spending mandate—the so-called 20% rule—has indeed induced some districts to spend more on education than they otherwise might have, thereby meeting the official target. But the evidence also indicates that the spending mandate has had no significant effect on improving school participation or learning outcomes (Lewis Citation2022a). There is little reason to believe that the results will be different for other mandates.
SUMMARY AND CONCLUSIONS
With the issuance of Law 1/2022, the Ministry of Finance has made a number of technical adjustments to the intergovernmental fiscal framework. In this context, there are several good points in the new law: the increase in the property tax rate, the elimination of the basic allocation in the DAU distribution formula and the adoption of client-based methods for deriving DAU fiscal gap allocations. However, the usefulness of the first in increasing own-source revenues may be constrained by the introduction of a new assessment ratio, which could lead some districts to narrow their effective tax bases, resulting in lower property taxes. The efficacy of the second in reducing incentives for districts to overspend on civil servant wages will be mitigated by the inclusion of personnel spending as an adjustment factor in the DAU allocation formula, which rewards such spending. Most importantly, the effectiveness of the third in equalising per capita transfers across districts will be severely restricted by island-based clustering procedures for determining DAU funding pools.
The broader, more implicit intent of the law is clearly to facilitate more central government control over districts’ fiscal affairs. The increased control is operationalised through a variety of standard public finance tools, with a particular emphasis on performance incentives, revenue earmarks and spending mandates.
Based on the available information, it seems that many of the service standards employed in the incentive schemes’ designs are not fully under the control of districts and, therefore, should not be used to assess their performance. Also, many of the standards will be extremely difficult to reliably measure, causing additional problems. Incentive programs will obviously not operate well when performance is improperly evaluated (Lewis and Smoke Citation2017). While much apparently remains to be worked out regarding the performance-based approaches, the existing evidence does not bode well for satisfactory future design.
Earmarks for district own-source revenues, shared national revenues and DAU allocations do not, in general, satisfy the benefit principle. Neither do those earmarked revenues appear sufficient in magnitude to fully fund the services to which they are linked, implying that they will fall prey to the fungibility of (other) general revenues. As a result, the intended district spending efficiency gains are not liable to be obtained.
Finally, new (and existing) spending mandates are improperly constructed as a function of district expenditure budget shares. What matters for service delivery is per capita spending, and budget shares are a poor proxy for spending in per capita terms, given the very unequal distribution of fiscal resources. While the new spending mandates for personnel and infrastructure may induce districts to spend their budgets according to the wishes of the Ministry of Finance, it is not likely they will lead to improved services (Lewis Citation2022b).
It is well recognised that local government accountability to the central government is indeed important for successful fiscal decentralisation policy. Upward accountability mechanisms can advance compliance with budgeting and financial management systems, promote national development priorities and minimum service standards, and provide an additional layer of checks and balances (Yilmaz, Beris and Serrano-Berthet Citation2010; Smoke Citation2019). But the main problem with decentralised governance in Indonesia is districts’ lack of accountability to their citizens (Lewis Citation2010). Many districts are simply not responsive to the service needs and priorities of their constituents. Strengthened accountability to central government is a poor substitute for the necessary downward accountability (Bahl and Martínez-Vázquez Citation2013).
A significant amount of research suggests that the main underlying causes of weak downward accountability in Indonesia are corruption (Olken Citation2006; von Luebke Citation2009; Mietzner Citation2015; Lewis Citation2017; Lewis and Hendrawan Citation2019) and clientelism (Aspinall and Sukmajati Citation2016; Aspinall and Berenschot Citation2019; Dong and Lewis Citation2023). Corruption diverts fiscal resources away from their intended purpose of delivering public services to meet residents’ demands, and clientelism perversely replaces the usual ‘fiscal contract’ based on an exchange of taxes paid for services rendered with a system grounded in political and financial support for local politicians in return for favours bestowed. Weakened horizontal accountability has negative effects on local fiscal and service outcomes (Yilmaz, Beris and Serrano-Berthet Citation2010). There is not much the Ministry of Finance can do about these complications, at least in a law on intergovernmental fiscal relations. This highlights the inherent difficulty government faces in designing public finance solutions to problems that are essentially political economy in kind.
In summary, most of the law’s interventions are rather inadequately designed. Perhaps this is all that could be expected of a process that involves so many powerful central government ministries and the national parliament, all with significantly different agendas, along with an apparent lack of genuine input from provinces and districts. In any case, given its flawed design, it seems doubtful that the law will lead to a satisfactory achievement of intended objectives: improving the distributional equity of intergovernmental fiscal transfers across districts and enhancing district tax mobilisation, spending efficiency and service delivery performance. The country’s decentralisation program will no doubt muddle through, as it always has done, but the subnational public sector will likely continue to underperform.
Supplemental Material
Download MS Word (23.9 KB)ACKNOWLEDGMENTS
I thank Lina Ghaida for her diligent and expert research assistance and Anne Booth, Howard Dick, Adrianus Hendrawan, Hefrizal Handra, Hal Hill, Sana Jaffrey, Raksaka Mahi, Chris Manning, Ross McLeod, Marcus Mietzner, Arianto Patunru and Riatu Mariatul Qibthiyyah for their inputs on an earlier draft and presentation.
Notes
1 In this paper, district refers to both regencies (kabupaten) and municipalities (kota).
2 Service quality is also distributed unequally across regions, but data are too limited to provide a precise accounting of the differences in this case.
3 These are not the only problems with decentralisation that have been raised, of course. Some authors have emphasised that many districts have faced difficulties in hiring welltrained civil servants, while others have stressed the constraints imposed by district splitting (pemekaran) (for example, Booth Citation2011; Lewis Citation2017).
4 Given recent rising inflation, the figures imply a decline in total transfers of nearly 7% in real terms ().
5 The decrease is a function of reduced funding for Aceh, which now comprises 1% of DAU instead of the previous 2% of DAU, as stipulated in Law 11/2006.
6 For a discussion of Indonesia’s accounting system, see McLeod and Harun (Citation2014).
7 This year’s budget will not affect the recent relative importance of transfers as discussed here to any substantial degree ().
8 For example, air pollution caused by forest fires in one district may spill over into neighbouring districts while river water pollution in an upstream district may negatively affect downstream districts. As a result, air and water pollution in some districts will have been caused by the activities of other districts. In such cases, it becomes difficult to evaluate districts’ ‘environmental preservation’ performance.
9 These figures are based on 2018 data in constant (2010) terms.
REFERENCES
- Anas, Titik, Hal Hill, Dionisius Narjoko and Chandra Tri Putra. 2022. ‘Survey of Recent Developments: The Indonesian Economy in Turbulent Times’. Bulletin of Indonesian Economic Studies 5 (3): 241–71. doi: 10.1080/00074918.2022.2133344
- Aspinall, Edward and Mada Sukmajati, eds. 2016. Electoral Dynamics in Indonesia: Money Politics, Patronage and Clientelism at the Grassroots. Singapore: NUS Press.
- Aspinall, Edward and Ward Berenschot. 2019. Democracy for Sale: Elections, Clientelism, and the State in Indonesia. Ithaca, NY: Cornell University Press.
- Bahl, Roy and Jorge Martínez-Vázquez. 2013. ‘Sequencing Fiscal Decentralization’. Annals of Economics and Finance 14 (2) (B): 623–70.
- Bird, Richard M. and Joosung Jun. 2005. ‘Earmarking in Theory and Korean Practice’. ITP Paper 513. Georgia State University.
- Boadway, Robin W. and Anwar Shah, eds. 2007. Intergovernmental Fiscal Transfers: Principles and Practices. Washington, DC: World Bank.
- Booth, Anne. 2011. ‘Splitting, Splitting and Splitting Again: A Brief History of the Development of Regional Government in Indonesia since Independence’. Journal of the Humanities and Social Sciences of Southeast Asia 167 (1): 31–59.
- Dong, Sarah and Blane D. Lewis. 2023. ‘Mayor Selection, Clientelism, and Fiscal and Service Outcomes in Indonesia’. Working Papers in Trade and Development 2023/15, Australian National University, Canberra.
- Khadan, Jeetendra and Sam Hill. 2023. ‘The Global Economic Outlook in Five Charts’. World Bank Blogs, 10 January 2023. https://blogs.worldbank.org/developmenttalk/global-economic-outlook-five-charts-0
- Lewis, Blane D. 2003a. ‘Property Tax in Indonesia: Measuring and Explaining Administrative (Under-) Performance’. Public Administration and Development 23 (3): 227–39. doi: 10.1002/pad.268
- Lewis, Blane D. 2003b. ‘Local Government Borrowing and Repayment in Indonesia: Does Fiscal Capacity Matter?’ World Development 31 (6): 1047–63. doi: 10.1016/S0305-750X(03)00047-0
- Lewis, Blane D. 2007a. ‘On-Lending in Indonesia: Past Performance and Future Prospects’. Bulletin of Indonesian Economic Studies 43 (1): 35–58. doi: 10.1080/00074910701286388
- Lewis, Blane D. 2007b. ‘Revisiting the Price of Residential Land in Jakarta’. Urban Studies 44 (11): 2179–94. doi: 10.1080/00420980701518974
- Lewis, Blane D. 2010. ‘Indonesian Decentralization: Accountability Deferred’. International Journal of Public Administration 33 (12–13): 648–57. doi: 10.1080/01900692.2010.514442
- Lewis, Blane D. 2013. ‘Local Government Capital Spending in Indonesia: Impact of Intergovernmental Fiscal Transfers’. Public Budgeting & Finance 33 (1): 76–94. doi: 10.1111/j.1540-5850.2013.12002.x
- Lewis, Blane D. 2014. ‘Twelve Years of Fiscal Decentralization: A Balance Sheet’. In Regional Dynamics in a Decentralized Indonesia, edited by Hal Hill, 135. Singapore: ISEAS Publishing.
- Lewis, Blane D. 2017. ‘Does Local Government Proliferation Improve Public Service Delivery? Evidence from Indonesia’. Journal of Urban Affairs 39 (8): 1047–65. doi: 10.1080/07352166.2017.1323544
- Lewis, Blane D. 2018. ‘Local Government Spending and Service Delivery in Indonesia: The Perverse Effects of Substantial Fiscal Resources’. Regional Studies 51 (11): 1695–707. doi: 10.1080/00343404.2016.1216957
- Lewis, Blane D. 2021. ‘Key Principles of Fiscal Decentralization’. In The Role of Intergovernmental Fiscal Transfers in Improving Education Outcomes, edited by Samer Al-Samarrai and Blane Lewis, 9–20. Washington, DC: World Bank.
- Lewis, Blane D. 2022a. ‘The Impact of Democratic Elections on Taxation: Quasi-Experimental Evidence from Subnational Indonesia’. Economics Letters 211: 110270. doi: 10.1016/j.econlet.2022.110270
- Lewis, Blane D. 2022b. ‘Local Education Spending Mandates: Indonesia’s 20 Percent Rule’. Education Economics, 1–20. doi: 10.1080/09645292.2022.2095353
- Lewis, Blane D. and Adrianus Hendrawan. 2019. ‘The Impact of Majority Coalitions on Local Government Spending, Service Delivery, and Corruption in Indonesia’. European Journal of Political Economy 58: 178–91. doi: 10.1016/j.ejpoleco.2018.11.002
- Lewis, Blane D. and Andre Oosterman. 2009. ‘The Impact of Decentralization on Subnational Government Fiscal Slack in Indonesia’. Public Budgeting & Finance 29 (2): 27–47. doi: 10.1111/j.1540-5850.2009.00927.x
- Lewis, Blane D. and Andre Oosterman. 2011. ‘Sub-national Government Capital Spending in Indonesia: Level, Structure, and Financing’. Public Administration and Development 31 (3): 149–58. doi: 10.1002/pad.582
- Lewis, Blane D., Neil McCulloch and Audrey Sacks. 2016. ‘Measuring Local Government Service Delivery Performance: Challenges and (Partial) Solutions in Indonesia’. Journal of International Development 28 (5): 808–17. doi: 10.1002/jid.3106
- Lewis, Blane D. and Paul Smoke. 2017. ‘Intergovernmental Fiscal Transfers and Local Incentives and Responses: The Case of Indonesia’. Fiscal Studies 38 (1): 111–39. doi: 10.1111/1475-5890.12080
- LPEM/FEB. 2022. ‘Macroeconomic Analysis Series: BI Board of Governors Meeting’. December 2022. Jakarta, Indonesia.
- Martínez-Vázquez, Jorge, Santiago Lago-Peñas and Agnese Sacchi. 2017. ‘The Impact of Fiscal Decentralization: A Survey’. Journal of Economic Surveys 31 (4): 1095–129. doi: 10.1111/joes.12182
- McLeod, Ross H. and Harun Harun. 2014. ‘Public Sector Accounting Reform at Local Government Level in Indonesia’. Financial Accountability & Management 30 (2): 238–58. doi: 10.1111/faam.12035
- McLeod, Ross H. and Sitta Rosdaniah. 2018. ‘An Evaluation of Some Key Economic Policies’. Bulletin of Indonesian Economic Studies 54 (3): 279–306. doi: 10.1080/00074918.2018.1548245
- Mietzner, Marcus. 2015. ‘Dysfunction by Design: Political Finance and Corruption in Indonesia’. Critical Asian Studies 47 (4): 587–610. doi: 10.1080/14672715.2015.1079991
- Ministry of Finance. 2022. ‘Mengawal Indonesia Melalui Turbulensi Ekonomi Global’ [Guarding Indonesia through Global Economic Turbulence]. Presentation by Suahasil Nazara, vice minister of finance, Bandung, 10 December.
- Olken, Benjamin A. 2006. ‘Corruption and the Costs of Redistribution: Micro Evidence from Indonesia’. Journal of Public Economics 90 (4–5): 853–70. doi: 10.1016/j.jpubeco.2005.05.004
- Resosudarmo, Budy P. and Abdurohman. 2018. ‘Is Being Stuck with a Five Percent Growth Rate a New Normal for Indonesia?’ Bulletin of Indonesian Economic Studies 54 (2): 141–64. doi: 10.1080/00074918.2018.1521776
- Smoke, Paul. 2019. ‘Improving Subnational Government Development Finance in Emerging and Developing Economies: Toward a Strategic Approach’. ADBI Working Paper No. 921, Asian Development Bank Institute.
- Sumando, Eko. 2022. ‘The Impact of Districts’ Presidential Electoral Share on Capital Grant Allocations in Indonesia’. Presentation, Crawford School of Public Policy, The Australian National University.
- Tax Policy Center. 2022. Tax Policy Center Briefing Book. Tax Policy Center.
- von Luebke, Christian. 2009. ‘The Political Economy of Local Governance: Findings from an Indonesian Field Study’. Bulletin of Indonesian Economic Studies 45 (2): 201–30. doi: 10.1080/00074910903040310
- World Bank. 2020. Indonesia Public Expenditure Review 2020: Indonesia: Spending for Better Results. Jakarta: World Bank.
- World Bank. 2022a. ‘Development Policy Review (Draft).’ Jakarta: World Bank.
- World Bank. 2022b. Trade for Growth and Economic Transformation. Indonesia Economic Prospects. Jakarta: World Bank.
- Yilmaz, Serdar, Yakup Beris and Rodrigo Serrano-Berthet. 2010. ‘Linking Local Government Discretion and Accountability in Decentralisation’. Development Policy Review 28 (3): 259–93. doi: 10.1111/j.1467-7679.2010.00484.x
Appendix
Table A1. Tax and Non-Tax Revenue Sharing, Percent of Total Revenue