
Abstract
This article investigates the effects of individual directors for corporate strategies and firm performance over the course of the 20th century for Dutch exchange-listed firms. We apply a multi-method approach on directors with many executive and supervisory roles in multiple firms – so-called big linkers. We first identify exceptional big linkers, board members whose presence is systematically related with firm characteristics. Our approach allows us to identify a number of exceptional individuals who were previously overlooked by business historians. Then we investigate the backgrounds of these exceptional big linkers. We find that their biographies and other archival materials provide explanations for their systematic relation with corporate outcome variables such as performance, debt and investments. Using additional information about these directors, including network centrality, bank relations and family histories, we are able to shed light on the multitude of explanations for the roles of exceptional big linkers.
1. Introduction
Directors of firms play a dominant role in formulating corporate strategy and in determining the direction of the firm. During most of the twentieth century, with assigned legal and statutory powers, these directors had the responsibility to design and execute the strategies of corporations. And because many directors serve on multiple boards, networks or social links between board members, both formal and informal, are seen as important for business transactions (Streeck, Citation2001). Business historians have a long tradition in explaining changes in networks of directors over longer periods of time (see for a collection of countries David & Westerhuis, Citation2014; and recent studies: Lluch, Rinaldi, Salvaj, & Vasta, Citation2017; Wilson, Buchnea, & Tilba, Citation2017). The underlying idea of these studies is that networks improve the transfer of knowledge and expertise among directors (Carpenter, Li, & Jiang, Citation2012; Davis, Citation1991; Westphal, Citation1999). However, it remains difficult to assess claims that directors with multiple board positions have a capacity to shape corporate strategy and performance, or whether their presence is even correlated with firm characteristics.
Carpenter et al. (Citation2012, p. 1335) make a distinction between network possessions, which reflect the availability of actors’ useful ties, versus network utilisations, which indicate actors’ efforts to actually use the ties. Often the focus in network analysis remains on the first, which is network possession, because utilisations are difficult to observe. An assumption in social network analysis is that the position of an actor in the network reflects his influence or power. A central position allows for better access to resources that circulate in the network than a more separate position (Shane & Cable, Citation2002; Uzzi, Citation1996). Director duties – studied by earlier literature – are providing advice (Lorsch & MacIver, Citation1989; Westphal, Citation1999), monitoring (Bainbridge, Citation1993; Fama, Citation1980; Johnson, Daily, & Ellstrand, Citation1996) and strategizing (Kesner & Johnson, Citation1990; Lorsch & MacIver, Citation1989). Studies such as Carpenter and Westphal (Citation2001) find that directors with multiple appointments can provide relevant strategic knowledge and claim that the directors’ social network is an important part in setting corporate strategies.
Our study focuses on network utilisation by investigating the association of big linkers, or directors with multiple board positions, with the strategies and performance of Dutch firms in the twentieth century, i.e. over the period 1908–2003. Our sample includes 6637 firm-year observations with 48,524 board seats. From this data we identify 102 individual directors as big linkers. The goal of our article is first to identify exceptional big linkers, i.e. directors with many board seats and statistically significant correlations with firm characteristics after controlling for firm and board characteristics. Then we investigate the exceptional big linkers in-depth in order to understand the reasons for their significance.
In our approach, we build on two well-established streams of research, which have not been combined in a single analysis so far. The first stream is fixed effect modelling, as pioneered by Abowd, Kramarz, and Margolis (Citation1999), who show that inter-industry wage differentials are largely driven by individual workers’ fixed effects. In short, these models run regressions with indicator or dummy variables explaining some outcome, where the presence of individuals over multiple observations allow the estimation of the effect of these individuals. The method is by now well established and our estimations follow the approach in these studies. Fixed effects models have been used in management studies (Bertrand & Schoar, Citation2003), accounting (Bamber, Jiang, & Wang, Citation2010; DeJong & Ling, Citation2013; Ge, Matsumoto, & Zhang, Citation2011; Richardson, Tuna, & Wysocki, Citation2003) and corporate governance (e.g. Bouwman, Citation2011; Cronqvist & Fahlenbrach, Citation2008; Graham, Li, & Qiu, 2011). The second stream of research is the historical prosopography where biographies are made for a larger group of interesting individuals based on primary and secondary sources.
We apply a two-step method, i.e. a mixed-method approach (Johnson & Onwuegbuzie, Citation2004; Small, Citation2011; Tashakkori and Teddlie, Citation2003). In the first step we run regression models with fixed effects for big linkers, in order to estimate the statistical significance of relations with firm characteristics for each of our 102 big linkers. We list the board members ranked by the strength of their relations with firm characteristics. This ranking features the exceptional big linkers. In the second step we use primary and secondary sources that describe each of our high-ranked (exceptional) big linkers to provide understanding and context. As such in this step we use prosopographical analysis to facilitate a deeper investigation into the systematic correlations exhibited by exceptional big linkers.
Our approach facilitates four distinct objectives. First, for each big linker we can estimate whether this person’s presence exhibits a systematic relation with the characteristics of the firms he or she is associated with. Second, from the list of big linkers we can provide a ranking to identify the exceptional individuals, i.e. those with the strongest relation with a set of firm characteristics. Third, using the strongest relation with a specific firm characteristic, we can identify additional exceptional individuals. Consequently, our analysis does have the advantage that it can identify exceptional big linkers previously overlooked by business historians. Fourth, we can relate our statistical estimations to additional sources, allowing for an in-depth explanation of the estimates for exceptional big linkers. We find this latter element to be crucial, in order to distinguish whether big linkers represent interests of a business or business interests. In particular, ‘biggest’ big linkers are not necessarily exceptional big linkers. That is, those big linkers with the most seats are not per se those individuals who significantly relate to firm characteristics.
We focus on individual directors, which contrasts with the traditional emphasis on interlocking directorates in the business historical and related literatures (David & Westerhuis, Citation2014; Lluch et al., Citation2017; Wilson et al., Citation2017), where interlocks are typically presented as characteristics of firms, or interlocks are presented as ties in a network of directors. Our approach does not apply to firm characteristics determined by the interlock or the present of a big linker, but rather to the directors as unique individuals. In our view, the exceptionality of some directors is determined by a multitude of ties with firms, and thus correlates with firm strategies and performance. This perspective then allows us to discuss that being a big linker as such does not yield effects, but being a big linker with particular unique characteristics does. Consequently, board interlock studies that exclusively investigate whether directors are a big linker and the effects thereof, are incomplete, because the effects are not homogeneous, but instead depend on the characteristics of the exceptional big linker.
Although our analysis adds to the understanding of director effects on firms, we are aware of the limitations of our mixed-method approach. First, the approach cannot measure matching of big linkers with firms versus influence of big linkers; this distinction has to be found in primary and secondary sources. Second, our results only pertain to big linkers (those individuals with sufficient number of board positions over firms and in time for each board member), as such they cannot be used as general conclusions about the effect of board and board member characteristics on firm characteristics.
2. Directors, networks and the effect on corporate strategy
The foundation for the relevance of big linkers through interlocking directorships on corporate strategies is threefold. First, interlocking ties are sources of information, which might increase a director’s cognitive horizon (Pennings, Citation1980). Second, firms depend on their environment for access to essential resources, such as funding and investment opportunities. To cope with this, interlocking directorships reduce transaction costs and are used as an instrument for co-optation (Pfeffer, Citation1972). Third, because strategic decisions are characterised by high uncertainty and risks, directors might rely on accepted rules or norms, an example of isomorphic behaviour (DiMaggio & Powell, Citation1983).
Studies into the effect of board members with multiple directorships on corporate performance show mixed evidence (Andres, Bongard, & Lehmann, Citation2013; Ferris, Jagannathan, & Pritchard, Citation2003; Fich & Shivdasani, Citation2006; Harris & Shimizu, Citation2004). Mizruchi (Citation1996) argues that the ambiguity may be a reflection of a casual ordering problem. Firm performance is both a result of the actions of previous directors and a factor that in itself potentially influences the choices of subsequent directors (Hermalin & Weisbach, Citation2003). In addition to these general arguments, researchers have identified purposes of ties that are specific to institutional arrangements; for example, Khanna and Rivkin (Citation2006) present compelling evidence that in Chilean business groups boundaries of the group are largely delineated by director ties, which are at least as important as equity and family ties. Recent studies have used quantitative approaches to deal with this endogeneity (Martin, Gozubuyuk, & Becerra, Citation2015) and have shown a downside of interlocking directorships, i.e that too many board positions might lead to inefficiency of directors that become too busy to do their job (Ferris et al., Citation2003).
Generally it is assumed that firms or directors that are most centrally located in the corporate network have potential to wield power (e.g. Heemskerk & Fennema, Citation2009; Helmers, Mokken, Plijter, & Stokman, Citation1975). Useem (Citation1979) defines business people with multiple board or ownership positions as the inner circle. Because of these multiple positions, he reasons, they occupy also board positions at other institutions, including board positions in different types of public and non-profit private institutions, such as government agencies, schools, and foundations. It is what Useem calls institutional governance. This can largely be seen as symbolic but as much it might be an indication of capitalist control of private as well as public life (Useem, Citation1979, p. 554). The inner circle often possess a high degree of cohesion, with common interests and common goals. Useem goes on by arguing that members of the inner circle, sitting on several boards, have a unique position compared with members of the elite who have a board position on just a single firm. They thus have significant connections with at least several major firms. Significant connections Useem defines as ‘those which involve the capacity to shape corporate policy, and include substantial ownership in a firm, service as a director or officer, and close kinship with those holding the former connections’. In this way ‘interlocking directors are in a position to recognise and help reconcile the problems of several firms, often operating in very different environments’ (Useem, Citation1979, 555). Haunschild (Citation1993), for example, investigates inter-organisational imitation by analysing the relation between interlocks and the acquisition activities of firms. She finds that directors transfer information on the efficiency of certain policies by observing the consequences of management decisions. Davis (Citation1991) finds that firms were more likely to adopt ‘poison pill’ takeover defences when they were centrally located in the network and were interlocked with firms that had already adopted that sort of defence.
3. Dutch firms in the twentieth century
We study big linkers in Dutch listed firms during the 20th century. Dutch business can be characterised by a long tradition of entrepreneurship, family business and large multinationals. Over the century, periods of stability were followed by disruption. Crises, world wars, and globalisation are examples of exogenous factors that challenged Dutch business (Sluyterman, Citation2005). Following the Varieties of Capitalism literature (Hall & Soskice, Citation2003), one could say that the Netherlands swung from a liberal market economy in the beginning of the twentieth century, towards a coordinated market economy after the Second World War, and reverted back again to a more liberal one from the 1980s (De Jong, Röell, & Westerhuis, Citation2014; for more details on Dutch capitalism see Sluyterman, Citation2014).
The Dutch corporate network emerged at the end of the 19th century when industrialisation began to take hold and the economy grew rapidly. Firms were created and many of them were listed on the Amsterdam Stock Exchange. A temporarily decline of the network in the 1930s was followed by a period of consolidation in the 1950s–1970s. Since the 1980s the network gradually declined, and more significantly at the turn of the century, when the number of board positions held by directors declined substantially (Westerhuis, Citation2014). This general trend from emergence, to consolidation, and then to decline of the network is very similar to other national networks, such as in the US, Germany, and Switzerland although the pace of the decline and the explaining factors differed across countries (David & Westerhuis, Citation2014).
In the 20th century, both in the liberal and coordinated market economy regimes, directors of companies have been powerful, compared to shareholders, banks, workers, and other stakeholders. In the earlier years the directors were appointed by financiers and in particular representing the interests of shareholders and banks (De Jong et al., Citation2014). Eventhough the official appointments were made at the shareholders’ meetings, banks were requiring board representation when providing significant loans to firms (Colvin, De Jong, & Fliers, Citation2015). From the 1950s onwards, the direct influence of shareholders over board appointments gradually reduced. In the so-called structured regime – legally obliged for firms with over 100 workers – the right to appoint executive directors was given to a supervisory board member, while they were appointing new members via co-optation. Since the 1990s and in particular in the early 21th century the relative power of shareholders in board appointments has increased with the adoption of Anglo-Saxon ideas about shareholder governance (Westerhuis, Citation2014; Westerhuis & De Jong, Citation2015). Unfortunately ownership data is only available for The Netherlands from 1992 and the average share ownership of board members is relatively low (4.9% on average per firms for the management board and 1.8% for the supervisory board; see De Jong, Kabir, Marra, & Röell, Citation2001).
4. Mixed-method approach
We apply a mixed-method research design in which we combine quantitative with qualitative research, as we complement statistical modelling with analysis of biographical descriptions from secondary sources. Using these approaches we are able to provide a historical context to the empirical findings, taking advantage of the strengths and mitigating the weaknesses of either methodology (Tashakkori & Teddlie, Citation2010). The strength of the statistical method is that magnitudes of the correlations of individual big linkers with firm characteristics can be estimated, while the weakness is that the effects are merely correlations and no inferences about causality are possible. However, because of the historical method we can infer some degree of causality from detailed historical context and rich descriptions (Morck & Yeung, Citation2011).
In the quantitative part of the mixed method we identify big linkers in our sample by using data on board members of Dutch exchange-listed corporations over the period 1903–2003, with 5-year intervals. In the literature it is common to define big linkers as directors that have three or more board positions (David & Westerhuis, Citation2014) and we follow this convention. Given our objective to assess whether big linkers have a systematic contribution to corporate strategies and performance we define a big linker as that board member who at any point in time has at least three board positions (i.e. three seats at the same time) and over the course of his entire career has a minimum of 10 board seats (i.e. 10 seats from the first till the last time he is observed in our data). The first component requires at least three seats in a single year, which ensures that we identify a linker. The second component of 10 sets over the career ensures that we do not select a linker with little potential to influence firms and also guarantees the validity of the inclusion of big linker fixed effects in our models.Footnote1
We match our big linkers to a dataset containing financial statements and governance information and estimate linear regressions with multiple variables to examine the impact of big linker presence in a board on corporate outcomes. We investigate 12 outcome variables, which proxy corporate strategy and performance. As performance metrics we use return on equity, return on assets, dividends, and the market-to-book value. These four measures span a wide array of performance measures based on accounting conventions, cash payouts to shareholders and stock market valuation. For financing choice we use leverage, the interest coverage ratio, liquid assets, net working capital, and the current ratio. These ratios cover both the choices in long term financing between debt and equity, as well as short term considerations such a liquidity and working capital. Finally, we measure investments in fixed assets, firm growth, and tangibility of assets as proxies of the real sphere for investment and asset structure.
Models (1) through (3) highlight our regression equations, where Outcomei,t are firm-specific outcome variables, Fi,t is a set of variables containing explanatory firm characteristics,Footnote2 ωt is a set dummy variables for each year to capture unobserved macroeconomic shocks, θi,t is a set of dummy variable for each industry present in our data, this in order to capture unobserved industry-specific variation. We subsequently add a set of variables Bi,t capturing firm-specific board characteristics (board size, total number of firm interlocks, total number of bank interlocks). To allow for time variation in the firm and industry determinants we interact these vectors with τt which is a vector of five period effects, in order to correct for temporal shifts in corporate characteristics and hence our data composition.Footnote3 Finally in Model (3) we add vector Mi,t capturing 102 big linker fixed effects.Footnote4
Outcomei,t = α + β1Fi,tτt + β2ωt + β3θi,tτt + εi,t (1)
Outcomei,t = α+ β1Fi,tτt + β2ωt + β3θi,tτt + β4Bi,tτt + εi,t (2)
Outcomei,t = α + β1Fi,tτt + β2ωt + β3θi,tτt + β4Bi,tτt + β5Mi,t + εi,t (3)
We use base-line OLS regressions for 12 firm outcome variable and for 19 benchmark years. Our modelling involves a large number of explanatory variables, which serve in our view the purpose of carefully controlling for firm and board characteristics, when estimating the big linker fixed effects. Using this conservative approach we prevent finding fixed effects that are the result of omitted variables (see Green (Citation1991) for rules on the minimum number of observations per regressor and Bertrand and Schoar (Citation2003), DeJong and Ling (Citation2013) for similar fixed effects studies).Footnote5 Because we run the risk of overfitting the data, we conduct robustness analysis using ‘leave-one-out cross-validation’ (LOOCV, see Geisser, Citation1975) and ‘least absolute shrinkage and selection operator’ (LASSO, see Tibshirani, Citation1996) estimations.Footnote6
We calculate the coefficient of determination (R2) per cross section, which measures the explained variance relative to total variance. The larger the increase of the R2 in a cross section when big linker fixed effects are added, the larger the importance of these fixed effects. Although we estimate our model as a single panel, we calculate the R2 for each of the twenty cross sections. This is particularly relevant, because it allows us to show the importance of big linkers over the century.
Using Model (3) we obtain regression coefficients and standard errors for each of the 12 outcome variables for each big linker, after controlling for characteristics of the firm and the board. In other words, we estimate for each big linker and each outcome variable what the individual board member’s presence adds and we can assess the statistical significance of the value-added. We use the ratio of the coefficient and standard error to obtain our measure for the effect of the big linker, because this measure – the t-value – incorporates the magnitude of the effect, controlling for the error in the estimate. We rank individual directors using the t-statistics pertaining to the individual big linker coefficients.
The rankings of big linkers by t-values allows us to distinguish the exceptional big linkers with significant estimates from the complete set of big linkers. Of course, this statistical approach allows us to identify exceptional people in a large set of board members, but it cannot inform us about the reasons for their exceptionality, and therefore we combine the statistical approach with a prosopography.
In the qualitative part of the mixed-method approach we use a prosopographical approach providing biographical descriptions to better understand who the big linkers are that contribute to firm performance and strategies. For the 10 big linkers who had the highest contribution we focus on individual characteristics of the big linkers and on features of the network in which they operate. We do this in the following way. We analyse the position in the network in which a big linker operates by looking at the number of board positions and his centrality in the corporate network. Additionally we see whether they have positions in cultural, educational, and political institutions, such as foundations, schools and universities, and government agencies. Big linkers that have many board positions and/or are more centrally located in the networks can use their position to wield power because the exposure and access to social capital – the resources gained through membership in the networks – is higher (‘institutional governance’, according to Useem, Citation1979). Thus directors might reap social capital benefits from these networks and so increase their influence in corporate performance, in their access to resources and/or in lowering transactions costs. A dense network would imply that big linkers can take better advantage of social capital hidden in the network.
However, directors do not become influential only because of their place in the network. Other features of the big linkers might be important as well. Thus we investigate whether big linkers from elite families are better able to reap social capital benefits by inherited capital and whether big linkers with a university degree are better able to reap social capital benefits through educational capital accumulation (Bertrand & Schoar, Citation2003). We also describe big linkers that are as prominent business owners able to reap social capital benefits (Windolf, Citation1998). Also, big linkers with positions in banks may have the ability to increase the access to financing and reduce transaction costs. According to the literature there are three main reasons why bankers would sit on corporate boards. First, interlocking boards of directors can increase access to capital for firms and reduce monitoring costs for banks (Lamoreaux, Citation1991; Musacchio & Read, Citation2007; Rajan & Zingales, Citation2003). Second, bankers on corporate board might function as a legitimising mechanism. Bankers on board give a kind of guarantee to investors that the firm will pay dividends on time. This was for example common in the Netherlands in the early 20th century when bankers sitting on a corporate board were representing the holders of preferred shares of that specific firm (Westerhuis & De Jong, Citation2015). It might also be an indication to other lenders that a firm is creditworthy. Finally, firms might want to have bankers on their boards because of their financial expertise and network. However, this also gives reason why bankers on the board might not be so beneficial, because they might have other interests than the corporate owners.
5. Data
We investigate the effect of big linkers on a sample of Dutch non-financial corporations that are listed on the stock exchange of Amsterdam. Our data covers the period 1908–2003. Dutch firms have a two-tier system, consisting of a management or executive board and a supervisory board. For the set of non-financial firms we collect the names of the directors of both boards between 1908 and 2003 with 5-year intervals, but excluding 1943 (we omit 1943, because of the Second World War; the data is incomplete and the strategy and performance variables are highly influenced by the war). And we do the same for the largest financial firms, both listed and non-listed. In the period 1903–1958 we use the 50 largest banks based on equity and from 1958 to 1968 based on total assets, while from 1973 onwards we select the banks that jointly have a 95% market share based on total assets. By then the number of banks is less than fifty due to concentration in the Dutch financial sector from the 1960s onwards. For the period 1978–2003 we also include insurance companies that jointly have an 80% market share based on gross premiums. We collect board information from various sources. From 1903 until 1978 Van Oss Effectenboek provides board information, and after 1978 we collect individual board information from annual reports. Next we included listed and non-listed banks. We used Financieel Adresboek (1908–1958), annual reports (1963 and 1969), FD Omzetcijfers (1978–1993), and FD Compendium Nederlands Bedrijfsleven (1998–2003).
Next, we have collected annual report information of all Dutch listed non-financial firms between 1903 and 2003 with 5-year intervals. We exclude the financial firms due to differences in accounting principles. With this dataset we calculate firm size, performance (return on assets, return on equity, and market-to-book value) and nine firm strategies. The data comes from different sources. First, the Gids bij de Prijscourant contains share and dividend information of all securities listed in Amsterdam. Second, the Van Oss Effectenboek is a contemporary investor manual. The manual was published annually from 1903 until 1978 and includes balance sheets, profit and loss statements, share information, and information on the distribution of profits (see Colvin et al. (Citation2015) and Westerhuis and De Jong (Citation2015) for descriptions of the adjustments to the accounting data). Third, the Tabel – Der laagste en hoogste koersen provides information on stock prices and dividends. Fourth, for the period from 1977 to 2003 firm data is collected from a database with exchange-listed firms of the Centraal Bureau Statistiek (Statistiek Beurs NV’s). We include firms in our sample when in a given year complete information is available for the variables in our analyses.Footnote7 This limits our sample, as in the early part of the twentieth century firms disclosed their financial data on a voluntary basis and some firms provided only a limited number of items.
Subsequently for the big linkers that we identify we collect qualitative information on their individual background. Our sources pertain to (however, not exclusively) personal archives, obituaries, genealogy reports, The Dutch National Archives, Biografisch Woordenboek van Nederland (BWN) 1880–2000, International Institute of Social History, Rijksbureau voor Kunsthistorische Documentatie (RKD), Persoonlijkheden in het Koninkrijk der Nederlanden, Atlas van de Macht Citation1998, and Delpher, a resource with digitalised texts from newspapers, journals and books from the 15th to the 21st century.
Based on the data sets described above we created three samples. One sample with all Dutch listed non-financial firms for which we have complete annual report data between 1908 and 2003 with 5-year intervals (of 3583 firm-year observations). A second sample with all Dutch listed non-financial and the largest financial firms for which we have complete board data between 1908 and 2003 with 5-year intervals, excluding 1943 (6637 firm-year observations with 48,524 board seats). And, a third sample consists of big linkers including personal background information such as age, belonging to elite families, education, bank involvement, and network statistics.
We identify 102 big linkers in the twentieth century of which the 10 big linkers with the largest number of positions are shown in . K.P. van der Mandele is the big linker with the largest number of positions. He is first observed in a board in 1928 and last in 1963, which implies that he occurs in seven cross-sections (1928, 1933, 1938, 1948, 1953, 1958, and 1963) with 129 positions (18.4 positions on average per year). Because many positions are in banks and some for firms for which we have no complete financial information, we have 22 observations for Van der Mandele in non-financial firms with complete data. shows the development of the number of positions over time.
Figure 1. Number of big linkers over the period 1908–2003.
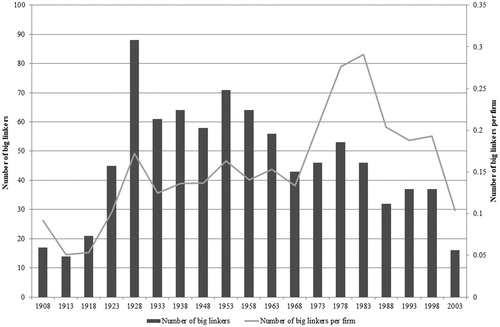
Table 1. Big linkers with largest number of board positions.
As can be seen in , the number of board seats taken by big linkers has followed a similar pattern as the overall corporate network: increase (until 1928), temporarily decline (in the 1930s), consolidation (1950s–1960s), and decline (since 1970s). The diminishing number of firms in our sample accounts for the difference in development between the number of big linkers (declining already since the 1970s) and number of big linkers per firm (declining only since the late 1990s). The relative late decline of big linkers per firm is consistent with the literature, in which it is shown that the Dutch corporate network only declined significantly at the turn of the century (Westerhuis, Citation2014).
In descriptive statistics of the 102 big linkers are provided.
Table 2. Descriptive statistics of the big linkers.
On average the 102 big linkers have 39 board positions. Of our big linkers 78% have served on a board of a bank. On average 11% of the board seats are with a bank and only 3% are management seats with a bank. We find that 13% of all big linker board positions are in the management board. The above statistics demonstrate that most of the board positions of the big linkers are supervisory board seats with non-financial firms. Of the 102 big linkers, 22% belong to an elite family, 16% is or has been political active and 46% has a university degree.
shows descriptive statistics averages for five different periods consisting of 3583 firm-year observations. The table shows that the percentage firms with a big linker on board is 16% in the first period (1908–1923) and fluctuates between 23% and 28% during the rest of the century. Board size increases from around 7 until 1963 to around 8 in the last two periods, whereas the total board interlocks decreases from 11.1 in the period 1903–1923 to 6.5 in the period 1988–2003. The average firm size, measured by total assets, increases a little until 1938, and considerably as of the 1960s, which is consistent with the extant literature (see e.g. Westerhuis & De Jong, Citation2015).
Table 3. Firm descriptive statistics per period.
Next, in order to understand whether big linkers are prevalent in specific firms, we estimate what type of firms – characterised by size, dividends, current ratio, leverage tangibility, performance, and board size – are more likely to have a big linker on board. shows that over the 20th century larger firms and firms with larger boards are more likely to have a big linker on their boards. The board size effect weakens over the course of the century. For the other variables we do not find strong results and the explanatory power of the models is limited. This result is comforting, because there does not seem to be a systematic allocation of big linkers in our sample of firms, except for a firm size effect. Therefore, in our big linker effect estimations we control for firm and board size.
Table 4. Explanation of presence of big linkers in boards.
6. Big linker effects
The purpose of our statistical analysis is to estimate big linker effects, to investigate how much of the variability in a firm’s strategy and performance is explained by these director fixed effects after controlling for other variables, and to identify exceptional big linkers. First we report our estimations for Model (2) and present the results in Panel A of . For example, the presence of our 102 big linkers in a board has a positive effect of 1.6% on return on equity in the 1948–1963 period, which is significantly different from zero at the 5% level. We find that the presence of a big linker (i.e. the general effect of a big linker, irrespective of the individual) has only limited effects, which are very specific to different outcome variables and varies over time. However, given the limited economic magnitude and significance of these effects, we highlight the importance of the contribution that specific individuals have.
Table 5. Big linker effects. Panel A: Overall effect of the presence of a big linker on the board.
Panel B: Example of a big linker fixed effect regression.
Panel C: Joint significance of big linker fixed effects per outcome variable.
We subsequently include 102 dummy variables for the presence of each individual big linker. We do not allow the director fixed effects to vary over time, because the length of the presence of a director in the sample is limited, such that director fixed effects are estimated over the maximum number of cross-sections. The results of the estimations are a set of regression coefficients and t-values measuring the correlations between outcome variables and director presence, controlling for firm, board, industry, and year characteristics. In order to explain our approach, an example of a big linker fixed estimation is shown in Panel B of . In this example we explain leverage (as one of the outcome variables) and include firm characteristics (firm size, return on assets, dividends, liquid assets), board characteristics (board size, total bank interlocks, total firm interlocks), seven industries, all interacted with five period dummies, and 19 year and 102 big linker fixed effects. We thus have 191 coefficients and standard errors, of which we show a set of 15 in Panel B of . In each of the five periods firm size has a positive effect on leverage, which is always significant at the 1% level. The effect of board size is less clear cut, because the effects sizes are smaller and never statistically significant. Most interesting are the estimates for the big linkers. K.P. van der Mandele has a point estimate of 0.059 with a t-value of 1.4. In other words, the presence of Van der Mandele has a positive association with leverage, which is not statistically significant. However, F.R. Hazelhof has a distinct negative effect, with a t-value of −2.9: this big linker is found to have a relatively strong association with corporate leverage. That is, firms where F.R. Hazelhof is a board member are likely to have between 11.1% less leverage compared to firms where he is not a board member.
We calculate the coefficient of determination (R2) per cross section for Models (1)–(3). This coefficient measures the explained variance relative to the total variance. The larger the increase of the R2 in a cross section when big linker fixed effects are added, the larger the importance of these characteristics. The results are in Panel C and in .Footnote8
Figure 2. The effect of big linkers.
Note: The annual percentage of the median explained variance over the 12 outcome variables for three models and the added explained variance of big linker fixed effects.
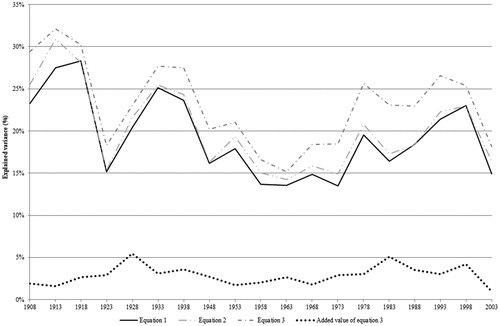
Overall the figure shows that board characteristics do not improve the model substantially, whereas the big linkers fixed effects do improve the model fit. The average percentage of additional explained variance (the dotted line in ) fluctuates around 1–6% and is lower at the beginning and in the end of the twentieth century whereas in 1928 and in the 1980s it reaches a peak. In particular the relatively high explanatory power in the 1980s is interesting, because by then big linkers occupied far less positions (see ). In Panel C of we test the significance of the big linker effect in two ways. First, the adjusted R-squared for our estimations – a measure that accounts for the complexity of our model – does not significantly differ from the standard R-squared reported despite to additional 102 regressors. Across all our models there is a limited difference between the adjusted and regular R-squares. Additionally, we test for each of the estimations whether the big linker fixed effects are jointly significant. This test follows an F-distribution with values between 3.4 and 9.1, which is highly statistically significant (always at 1% level). Because we find that big linker fixed effect does improve the model that explains variances in corporate strategies and performance, we zoom in into the big linker’s fixed effects.
7. Exceptional big linkers
In the previous section we have established that the fixed effects jointly explain part of the variation in the firm characteristics. However, our estimations are correlations, which means that the effects can be driven by selection and matching of the big linker qualities with the firm’s needs, as well as by the influence of big linkers. To better understand big linker effects we investigate our big linkers based on the strength of the effects, because we consider the big linkers with the strongest effects to be interesting individuals for further exploration. Moreover, we can now identify exceptional big linkers as the board members with systematic correlations with firm decisions and performance. Hopefully, our approach identifies interesting big linkers that have been previously overlooked by business historians.
7.1. Are the biggest linkers also exceptional board members?
We first investigate whether the board members with the largest number of positions also have the strongest associations. shows two important groups of big linkers: first, in Panel A, the big linkers with the most board positions (the same individuals as in ) and second, in Panel B, the directors with the largest fixed effects from our regressions. The effects are measured as the average of the absolute value of the t-statistics.
Table 6. Big linker effects for individuals with the most board positions and highest contributions. Panel A: Big linkers with the most board positions.
Panel B: Big linkers with the highest contribution.
We find that the big linkers with the most board positions are highly educated (seven have university degrees) and obviously centrally located in the Dutch corporate network. We find, however, that those individuals with the most board positions do not necessarily have substantial associations with corporate strategies. We find only two directors with average absolute t-values of at least 1.4 – F.H. Fentener van Vlissingen jr. (1.59) and J.P. van Tienhoven (1.50). The general finding that the biggest big linker exhibits little systematic effects is consistent with the literature on busy directors, which highlights that the directors with the most commitments are not per se the ones that have the highest contribution to corporate strategies and performance (Ferris et al., Citation2003). The finding is in contrast to the literature that assumes that the most central directors also have the most power to influence corporate strategies (e.g. Useem, Citation1979).
7.2. Who are the exceptional big linkers?
Our next question concerns the identity of the board members with the largest effects, which we identify as exceptional big linkers. Panel B of shows that several directors did exhibit strong effects for the 12 variables in our tests. Our first important finding arises thus when we compare Panel A and Panel B. The most central directors are not the most important ones. This finding also underlines the relevance of our study: apparently directors who are big linkers but not the most visible individuals are found to be very interesting to be studied in depth.
Half of the most exceptional big linkers were active before Second World War: Van Hoboken van Cortgene (1908–1918), Taudin Chabot (1933–1953), Koning (1918–1963), Van Delden (1908–1918), and Van Tienhoven (1923–1948). The other half of the big linkers were mostly active after Second World War: Martin (1973–1993), Wakkie (1973–1983), Van Beek (1953–1983), Fentener van Vlissingen jr. (1968–2003), and Tieleman (1948–1968) of whom only Fentener van Vlissingen jr. was active in the more recent period. Their total number of board positions range from 15 to 71, which is substantially lower than the number of positions the biggest linker in our sample has. Two of the persons are from elite families: Fentener van Vlissingen and Van Beek. Four of them have graduated from a university, of whom only one person in the early twentieth century. Centrality in the network ranges from 14 to 56, but it is hard to make any generalisations here. Four of the 10 persons have a management position at a bank; two before and two after the Second World War. Hoboken van Cortgene, who contributes most, has only supervisory board positions and no management positions at all. The same goes for Van Delden. This is in contrast to the notion that executive directors have greater possibilities to exert influence in their management positions than in supervisory board positions. Interestingly in the period before the war, four of five exceptional big linkers have corporate relations with the former colony of the Dutch Indies.
Although the above description is interesting, no clear pattern emerges from this set of 10 most influential big linkers. This implies we need to further study effects of individuals. In we present the big linkers with largest effects on five different metrics separately: return on assets, market value, dividends, investments, and leverage. For each metric we present the five directors with the largest positive and the five with the largest negative effect.
Table 7. Highest and lowest effect of big linkers for specific outcome variables.
In the remainder of this section we aim to understand the big linkers that have an effect on strategies and performance and zoom in on individual directors by analysing their effects vis-à-vis the biographical backgrounds.
7.3. Two exceptional individuals: Fentener van Vlissingen and Van Tienhoven
Fentener van Vlissingen junior (active between 1968 and 2003) and Van Tienhoven (active between 1923 and 1948) appear in both panels. Compared to the other eight persons, they have both a high centrality rate of 48.4 and 56.2, respectively, and the highest number of board positions of 71 and 60, respectively. Both have a university degree. The two big linkers are active in different time periods, which highlights that, although the majority of big linkers are concentrated in the era prior to the Second World War, our analysis does not constrain us from finding important effects in periods during which corporate networks declined.
Fentener van Vlissingen juniorFootnote9 scores high on market performance. He is often referred to as the most all-round founder of Dutch business. At a young age he already became one of the five board members of SHV, a non-listed family firm; the majority of the shares are in the hands of one family, the Fentener van Vlissingen family, which is also one of the richest families in the Netherlands. SHV was created in 1896 when eight coal merchants in Amsterdam decided to merge. One of them was Frederik Hendrik Fentener van Vlissingen, the grandfather of Fentener van Vlissingen junior. Grandfather Fentener van Vlissingen (1882–1962) was an entrepreneur and was married to Sophie Schout Velthuys (1882–1976), who came from a wealthy merchant banking family (Bank Vlaer & Kol, which later became part of AMRO Bank). In 1911 he became director of the family business. Also he was one of the creators of Hollandsche Kunstzijde-Industrie (a predecessor of AKZO). He collected capital to finance the start-up of the Koninklijke Luchtvaart Maatschappij (KLM) in 1919. From 1918 till 1933 Fentener van Vlissingen was among the advisors of the Ministry of Economic Affairs. Having taken part in trade negotiations for the Ministry of Foreign Affairs during the 1920s, he quickly gained a reputation as an economic expert and talented diplomat. Den Tex (Citation2013) describes grandfather Fentener van Vlissingen as highly analytical and pragmatic.
Fentener van Vlissingen junior got his degree in Chemistry at Technische Hogeschool Delft in 1964. He saw opportunities in the chemical sector, because there were not so many engineers at that time. At the age of 32, he started working for the family firm SHV. Already after two years, in 1967, he became member of the managing board, of which he became chair in 1975. In an interview in 1972 in De Tijd he stated: ‘it is important in a family firm that board members have first worked in different firms or sectors’, which indicates that his management position was based on merit. He felt a responsibility for the 27,000 employees of SHV and towards his own share ownership or family capital. After retirement in 1984, Fentener van Vlissingen became a gladly seen supervisory director in Dutch business, such as at AKZO Nobel, ABN Amro, CSM, Pon Holdings and Gist-Brocades. Also he became advisor to the managing board of Unilever.
Fentener van Vlissingen has high social capital, being a big linker connected to other important directors and firms, among them multinationals, from an elite family and being a prominent business owner. Coming from a large merchant family Fentener van Vlissingen junior quickly increased his influence throughout the Netherlands. Driven by ambition and his entrepreneurial spirit he always recognised good business opportunities, with his social status he was able to maximise on these opportunities. We find that he significantly contributed to market performance of the companies in his portfolio. Overall, we classify Fentener van Vlissingen junior as a highly skilled big linker with no particular management style, as he is much more driven by case by case opportunities with his broad experience and coming from a family of reputable merchants.
The other big linker that has many board positions and contributes to firm strategies and performance is Van Tienhoven.Footnote10 He scores particularly high on leverage, which we explain by his background in banking. He was born in Amsterdam and his father was a director at the De Nederlandsche Bank (which later became the Dutch Central Bank). After finishing Gymnasium in Amsterdam he studied law and wrote in 1904 a PhD dissertation on the Paris stock exchange at Utrecht University. In 1905 he became director of a small bank in Utrecht and continued his career in 1910 at Rotterdamsche Bank, one of the largest banks in the Netherlands at that time. Whereas often directors held positions in firms in the same city at that time, Van Tienhoven held board positions at firms in various cities such as Amsterdam, Utrecht, Rotterdam, and The Hague. Although he was not from an elite family, he married into the elites by marrying a baroness. Also he was active in cultural life as director of Hollandsche Maatschappij van Wetenschappen, chairman of the Wagnervereniging, and member of the board of the cultural charity Holland Festival. He resigned in 1924 from the Rotterdamsche Bank, but became chairman of the supervisory board of Hollandsche Bank voor Zuid-Amerika. Clearly Van Tienhoven had a strong background in banking. This can explain both the strong effect in general as well as the specific effect on leverage. Typically, bankers were placed in the boards of borrowers in order to monitor the firms; the positive effect of leverage is evidence that Van Tienhoven was active in highly levered firms, most likely to oversee bank interests. But there are more bankers among these 10 big linkers, to whom we will turn now.
7.4. Bankers
Our set of 10 exceptional big linkers include four bankers; two before the Second World War (Taudin Chabot and Van Tienhoven) and two afterwards (Wakkie and Tieleman), which implies that bankers play an important role in shaping corporate strategies during the whole twentieth century. Apart from Van Tienhoven also Wakkie scores high on leverage.
Wakkie is from a family well established in Rotterdam; they lived and worked in this city over various generations.Footnote11 Both his father and grandfather were security brokers, and Wakkie himself made career at Rotterdamsche Bank where among other things he became head of the credit department. After he finished Gymnasium, he obtained a degree in law at Utrecht University and then returned to Rotterdam to make a career at Rotterdamsche Bank. Because of his roots, he felt committed to the city and had many additional positions in the boards of cultural and health institutions (e.g. the Harbor Hospital). After graduation in 1935 he started working as a volunteer at Rotterdamsche bank, where he became a director in 1944 at the Coolsingel office. In 1946 he was promoted to secretary of the board and in 1959 became a member of the board itself. After the merger with Amsterdamsche Bank in 1964 he became member of the board of the newly-formed AMRO bank.
Wakkie was head of the credit department in Rotterdam and was known for keeping people at a distance. Interesting, and an example of his influence on leverage of firms, is the case of the firm Rademakers, where he was member of the supervisory board in 1973–1983 (in our sample). In 1983, when he is chairman of the supervisory board, the firm got a loan of 2.5 million guilders from the Dutch government, under the condition that they would restructure the firm. It also implied that the banks would increase their loans by 1.2 million guilders and another loan of 1.4 million guilders of the Nederlandse Investerings Bank (NIB) would become effective. Most likely Wakkie as chairman of the supervisory board, with his expertise and established relations in banking, had helped this defaulted firm Rademakers (Het Vrije Volk, 8 January 1983), and this may explain the high leverage in the firms where he is a board member.
Another interesting and relatively unknown banker is Taudin Chabot.Footnote12 We do not observe a high effect for leverage, but strong positive effects for investments, ROA and market value. We explain this by his high social capital and long-time experience in the banking sector combined with an educational background in trade and economics. Various generations of the Taudin Chabot family, a protestant merchant lineage, followed the motto: ‘Ich dien’ (I am serving), which reflects a law-abiding attitude and compliance. Doing business was seen as a religious task and family members were not supposed to be entrepreneurs for their own profits, but for a higher cause. Taudin Chabot was already the fifth generation in the family business. In 1908, at 24 years of age, he joined the merchant bank firm Chabot Brothers, founded by his grandfather in 1840 in Rotterdam. Only 1 year later he became partner.
Chabot Brothers was the successor of David Chabot & Sons, established in the eighteenth century, which had to close in 1836 due to a bank run. The brothers establishing its successor in 1840 succeeded to win back all previous clients (with the exception of only one). It is argued that the cautious and conservative conduct with which they were able to recover trust in Rotterdam would remain characteristic for the entrepreneurial and protestant spirit of the Chabot family for many generations. His two older brothers (13 and 16 years older) were not interested in a career at Chabot, leaving Marius predestined to have a career at his father’s firm. His school career was clearly adjusted to this purpose. After primary school he attended three years of HBS and Handelsschool in Rotterdam followed by five years at the Handelsschool in Amsterdam. After graduation in 1903 he became an intern at banks in Stuttgart, London and Hamburg, between 1904 and 1907. Here he studied the trade in bills of exchange in particular. A more specialised study in economics did not exist at that time in the Netherlands. When Marius became partner of Chabot in 1909, the firm had a weak position compared to other Rotterdam banking houses. This had to do with the closed family character of the firm, as it was very difficult for ambitious non-family members to be promoted to the top. Although the continuity of the family involvement was secured, this led to inertia. Among others, Chabot had a paternalistic and thrifty staff policy: low salaries, long working hours, and no career development. Taudin Chabot tried to change the firm into a more dynamic bank. His influence becomes visible by the increasing trade in international bills of exchange and profits increased rapidly since 1910.
In 1921, when Chabot was taken over by Nederlandsche Handel-Maatschappij (NHM) in Amsterdam, Taudin Chabot was appointed agent in Amsterdam and in 1929 he became board member of NHM. This is the moment Chabot appears in our sample. Interestingly, when he returned to Amsterdam as banker he met many of his fellow students but now in high board positions at various firms. He is described by W.F. Dutilh, someone who knew him personally, as a person with an eye for details and known for being very conscientious, and an infallible memory for numbers and names, combined with the required curiosity (Economisch-Historisch Jaarboek Volume 31). He knew very well how to make a firm more profitable. This is consistent with the strong effects we measure for return on assets, market value and investments.
7.5. Management experience and specialised expertise
Although many of the big linkers have the majority of their positions in supervisory boards, the positions and experience in executive management roles allow them with a larger potential impact. Moreover, specialisation in specific industries may allow for a larger contribution to firms. Below we discuss three individuals with relevant managerial experience and specific expertise.
Koning scores high on ROA as well as on market value.Footnote13 At age 16, he started at the training institute for the navy, Koninklijke Instituut der Marine, in Den Helder in 1889. In 1905 at his own request he got an honorary discharge to join the Koninklijke Paketvaart Maatschappij (KPM) in the largest Dutch colony (typically referred to as the Dutch East-Indies), which is now Indonesia, as an inspector and quickly made career within the firm: in 1912 board member and in 1916 chairman of the board. He was appointed in the Volksraad of the Dutch Indies around 1918. In 1919 he resigned to become board member of the Stoomvaart Maatschappij Nederland. He stayed as a member and between 1937 and 1948 as chairman of the supervisory board of KPM. Koning had many board positions in firms related to shipping and the Dutch Indies, such as Nederlandsche Scheepvaart Unie, Droogdokmaatschappij Soerabaja, Nederlandsche Scheepsbouw-Maatschappij, Nederlandsch Indische Steenkolen Handel-Maatschappij, Zeehaven en Kolenstation Sabang, and Werkspoor. We classify Koning as a big linker with specific expertise and knowledge of a sector. Because of his knowledge and expertise, instead of general management knowledge, he was able to contribute to return on assets and market value of these firms.
Even more interesting is Van Delden, who like Koning has specific management knowledge of a particular sector.Footnote14 However in contrast to Koning, Van Delden has relatively few board positions (only 19 compared to 49 by Koning) and no management board positions. During his career he was supervisory director at four tram companies and two banks; all six firms were strongly directed towards the Dutch Indies: Semarang Joana Stoomtrammaatschappij, Serajoedal Stoomtrammaatschappij, Oost Java Stoomtram Maatschappij, semarang Cheribon Stoomtrammaatschappij, Nederlandsch Indische Escompto Maatschappij, the Nederlandsch Indische Handelsbank. In the Dutch East Indies the four tram rail companies were independent companies. However, in the Netherlands there was one joint management. Also the firms were managed in the same way, the four firms had one joint general agent in the Dutch East Indies, and the personnel could be transferred from one company to another. We argue that Van Delden’s high score on investments – after controlling for industry effects – is driven by the relatively high investments in rails and trams in the firms in his portfolio, which increases fixed assets. The high effect on dividends is probably caused by the homogeneity of his portfolio and a life cycle effect, as many transport companies were benefitting from the investments and able to pay relatively high dividends.
In contrast, Hoboken van Cortgene scores in particular low on investments and high on leverage.Footnote15 This means that he favours an investment strategy of using debt, whereas the amount of fixed assets grows relatively slowly when he is sitting on the board. He makes the highest contribution to Dutch businesses in general but has only 15 board positions, which is the lowest number of the top-10 big linkers. Also his centrality with 13.7% is the lowest. Thus, comparable to Van Delden he has few board positions of which none are on a management board. Like Van Delden he was able to build up management expertise in a certain sector. However, his management style was much more risk seeking.
Hoboken van Cortgene was partner in Hoboken & Co, a trading company and private bank, and in distiller Hoboken, De Bie & Co. He was head of Hoboken & Co for 58 years during which the firm got worldwide fame, and in particular had strong relations with the Dutch Indies. Hoboken & Co was created already in 1775 as a trading house. Hoboken van Cortgene was incorporated in the firm in 1863. With him being from the third generation, we can define Hoboken & Co a true family firm. From the end of the nineteenth century the firm started to pursue banking activities as well. This might explain his preference for high leverage. More generally, one could explain his high overall contribution to the fact that he was well known and respected; in other words he had high social capital, that is connections to other persons and firms, owner of a family firm, and member of a trading and banking family. Hoboken van Cortgene was one of the richest persons of his time. He was societally heavily engaged being board member of for example Prins Hendrik Museum, Rotterdam Theatre, and Diergaarde Zoo. He was also politically engaged as member of the regional and departmental authorities (Provinciale Staten) of South Holland. At his funeral in 1922 the interest was overwhelming. The Mayor and a City Council Member, as well as many trade representatives, among them the chair of the Chamber of Commerce, the board of Diergaarde Zoo, the board of Rotterdam Theatre, and many members of the most important Rotterdam families were present.
8. Conclusion
Research on the effects of directors on firms’ strategies has a long tradition, both in management and organisation studies, as well as in business history. In the business studies literature the investigation of characteristics of directors in larger samples or of entire boards is the mainstream approach. On the contrary, in business history, networks are described and individual directors are studied in their historical context. These two streams of literature are reconciled in this study. We argue that the investigation of large samples can be used to trace individuals with exceptional effects on firms’ strategies, in particular when fixed effect estimations are applied. Then, we argue, the business historical approach can be applied on these exceptional individual directors in order to study the heterogeneity of motivations for director effects, aiming to draw causal inferences and make generalisations. In our view, this mixed-method approach combines the strengths of statistical and historical analyses, i.e. quantification of effects in large samples and a perspective on unique cases in their historical context.
We demonstrate that being a big linker as such is not what yields an effect, but being a big linker with particular characteristics. This implies that board interlock studies that just look at directors that are big linker or not are incomplete. In other words, we find that the presence of big linkers on the board of Dutch corporations are not necessarily in and of itself valuable for corporate decisions. Rather we find that individual big linkers show systematic correlations with various corporate decisions and policy variables. That is, understanding the role of big linkers and their networks depend on individual characteristic and big linkers cannot be treated as a homogeneous group. This is why our statistical approach identifies exceptional big linkers. Overall our contribution to the business history literature is that quantitative methods such as fixed effects models allow for the identification of exceptional individuals that have shaped businesses, affected corporate policies and have been left unstudied.
We show that the directors with the highest systematic relevance for corporate strategies are not those who are most central in the Dutch network, nor are they the ones with the most connections. Rather we argue that they are well-connected and have substantial management experience or industry expertise. Their social capital is high, characterised by many connections with other firms as well as with cultural and political institutions. We show that the individuals with systematic relevance are not only descendants from nobility, rather they come from merchant and banking families. Also, we find that inherited capital built up by generations of families is important, and maybe even more important than capital built up by education. Additionally we find that throughout the twentieth century bankers have played an important role in shaping corporate strategies. In addition to these patterns we find many effects specific to firms and individual directors, which underlines the importance of our mixed-method approach. This line of research opens new avenues for research that combines historical or archival sources in combination with empirical analysis. Further research is needed to investigate the characteristics of exceptional big linkers.
Acknowledgements
We thank the editor Stephanie Decker, two anonymous reviewers, Joost Jonker, Oscar Gelderblom, Chris Colvin, John Turner and workshop and seminar participants at European Group for Organizational Studies (Rotterdam, 2014), Queen’s University Belfast, Erasmus University Rotterdam, Radboud University Nijmegen, and King’s College for helpful comments. The data that supports the findings of this study are available from the corresponding author, Gerarda Westerhuis, upon reasonable request.
Disclosure statement
No potential conflict of interest was reported by the authors.
Additional information
Funding
Notes
1. Our analysis shows that there are no female big linkers in de Dutch corporate network during the twentieth century. Please note the ten occurrences for at least three firms involve board presence in many firm-years. For example, a director is a big linker with presence in 1908, 1913, and 1918 in two firms and 1908, 1913, 1918, and 1923 in one more firm. Assuming that the presence is uninterrupted, the minimum number of firm-years is eleven in the two firms and sixteen in the other, i.e. 38 years in total.
2. We explain the following firm strategies (i.e. outcome variables); return on equity, return on assets, dividends, leverage, interest coverage, investment, growth, liquid assets, net working capital, current ratio, tangibility, and market-to-book. In Models (1)–(3), Fi,t is a vector of firm specific variable different for every outcome variable. For return on equity and return on assets we use; liquid assets, leverage, firm size and tangibility. For dividends, we use liquid assets, leverage, firm size, tangibility, return on assets, retained profits, and a dummy variable for firms that report losses. For leverage and interest coverage we use; liquid assets, firm size, tangibility, return on assets and dividends. For investments and growth we use; liquid assets, leverage, firm size, tangibility, return on assets and dividends. For liquid assets we use; firm size, leverage, return on assets and dividends. For net working capital, current ratio, tangibility and market to book we use leverage, firm size, return on assets and dividends. All estimations contain a dummy for conservatism (i.e. rapid depreciation).
3. The five periods are 1908–1923, 1928–1938, 1948–1963, 1968–1983, and 1988–2003.
4. Models (1) through (3) are estimated using ordinary least squares with robust standard errors, clustered at the firm level.
5. We make two important assumptions. Big linker effects are constant over all firm-year-positions and the effects are measured with other board members as benchmark. As a result, the estimations are sophisticated correlations that are constant for directors over all seats they occupy. Thus, an effect might be called a ‘style’ a director has (see also Bertrand & Schoar, Citation2003). Also important to bear in mind is that our estimates are correlations because all inputs are measured contemporaneously. The correlation could be driven by selection (matching directors with the goals of a firm) or by influence (directors indeed influence outcomes) (for a discussion, see Cronqvist & Fahlenbrach, Citation2009). For future research we propose out-of-sample tests for the robustness of the director fixed effects. We thank an anonymous reviewer for this suggestion. Unfortunately it is not feasible given our data.
6. We thank an anonymous reviewer for these suggestions. The results are available upon request from the corresponding author. Please see footnote 9.
7. An exception is the market price of the shares (2888 observations) due to missing share price information. Two other, exceptions are investments (2636 observations) and growth (2725 observations, for which we require fixed assets and total assets, respectively 5 years earlier.
8. As mentioned in footnote 7, we have conducted robustness analyses using LOOCV and LASSO estimations. The LOOCV show that our models preform reasonably well when we estimate Equation (3) for N − 1 companies N times. We find that the explanatory power across all our models is on average 22%. This number increases when we exclude our investments equation. Due to the limited sample size for this variable and hence the low explanatory power of the equation, the out-of-sample predictive power is also rather low. This is also the reason why we exclude our investment equation from the LASSO estimation. We conclude that all our models are valid. However, the results for the investment equation need to be interpreted with caution. Secondly, the LASSO estimations show that our models are of decent quality. We find that explained variance of our model is always close to the explained variance reported in .
9. For Fentener van Vlissingen we used the following sources: Atlas van de Macht Citation1998; Nieuwsblad van het Noorden 16-10-1964; an interview in De Tijd 26-02-1972; NRC Handelsblad 30-09-1975; NRC Handelsblad 27-03-2006; Charles den Tex, Ik ben koopman. Kroniek van de familie Fentener van Vlissingen (De Geus 2013).
10. For Van Tienhoven we used the following sources: Persoonlijkheden in het Koninkrijk der Nederlanden, see http://www.iisg.nl/ondernemers/pdf/pers-1469-01.pdf; De Telegraaf 10-06-1924; Algemeen Handelsblad 26-03-1936; Algemeen Handelsblad 27-11-1950.
11. For Wakkie we used the following sources: P.E.E. Kleyn van Willigen, ‘Mr. H.N. Wakkie, 1911–1989’, in: Rotterdams Jaarboekje 1990: 161–164; NRC Handelsblad 29-07-1977; Het Vrije Volk 11-01-1980; Het Vrije Volk 08-01-1983; De Telegraaf 11-04-1989; NRC Handelsblad 10-04-1989; NRC Handelsblad 12-04-1989.
12 .For Taudin Chabot we used the following sources: Persoonlijkheden in het Koninkrijk der Nederlanden; C. Helderman, ‘Marius Taudin Chabot 1884–1966’, in: J. Visser et al., Nederlandse Ondernemers. Rotterdam 1850-1950 (Zutphen 2014): 68-73; W.F. Dutilh, ‘M. Taudin Chabot’, in: Economisch-historisch jaarboek Volume 31: 205–208; NEHA, http://www.iisg.nl/ondernemers/pdf/ehjb31-taudin.pdf.
13. For Koning we used the following sources: Persoonlijkheden in het Koninkrijk der Nederlanden; De Sumatra Post 19-06-1908; Het nieuws van den dag voor Nederlandsch-Indië 10-07-1909; De Sumatra post 19-11-1915; Bataviaasch Nieuwsblad 03-05-1916; Het nieuws van de dag voor Nederlandsch-Indië 15-04-1919; Het Nieuws van den dag voor Nederlandsch-Indië 17-05-1926; De Indische Courant 16-05-1930; Nieuwsblad van het Noorden 14-06-1963; Uitlaat, Magazine KPM 01-02-1950.
14. For Van Delden we used the following sources: Het Nieuws van de dag voor Nederlandsch-Indië 09-01-1902; Het nieuws van den dag: kleine courant 16-06-1903.
15 .For Hoboken van Cortgene we used the following sources: Visser et al. (eds.), Rotterdamse ondernemers 1850-1950 (Rotterdam 2002): 102–108; A. Hoynck van Papendrecht, Gedenkboek A. van Hoboken & Co, 1774-1924 (NA, 1924); Rotterdamsch Nieuwsblad 06-02-1907; Algemeen Handelsblad 25-06-1907; Algemeen Handelsblad 01-01-1913; De Tijd 07-02-1922; Rotterdamsch Nieuwsblad, 08-02-1922.
References
- Abowd, J. M., Kramarz, F., & Margolis, D. N. (1999). High wage workers and high wage firms. Econometrica, 67(2), 251–333. doi:https://doi.org/10.1111/1468-0262.00020
- Andres, C., Bongard, I., & Lehmann, M. (2013). Is busy really busy? Board governance revisited. Journal of Business Finance & Accounting, 40(9–10), 1221–1246. doi:https://doi.org/10.1111/jbfa.12051
- Bainbridge, S. M. (1993). In defense of the shareholder wealth maximization norm: A reply to Professor Green. Washington and Lee Law Review, 50, 1423.
- Bamber, L. S., Jiang, J., & Wang, I. Y. (2010). What’s my style? The influence of top managers on voluntary corporate financial disclosure. The Accounting Review, 85(4), 1131–1162. doi:https://doi.org/10.2308/accr.2010.85.4.1131
- Bertrand, M., & Schoar, A. (2003). Managing with style: The effect of managers on firm policies. The Quarterly Journal of Economics, 118(4), 1169–1208. doi:https://doi.org/10.1162/003355303322552775
- Bouwman, C. H. (2011). Corporate governance propagation through overlapping directors. Review of Financial Studies, 24(7), 2358–2394. doi:https://doi.org/10.1093/rfs/hhr034
- Carpenter, M. A., Li, M., & Jiang, H. (2012). Social network research in organizational contexts: A systematic review of methodological issues and choices. Journal of Management, 38(4), 1328–1361. doi:https://doi.org/10.1177/0149206312440119
- Carpenter, M. A., & Westphal, J. D. (2001). The strategic context of external network ties: Examining the impact of director appointments on board involvement in strategic decision making. Academy of Management Journal, 44(4), 639–660. doi:https://doi.org/10.2307/3069408
- Colvin, C. L., De Jong, A., & Fliers, P. T. (2015). Predicting the past: Understanding the causes of bank distress in the Netherlands in the 1920s. Explorations in Economic History, 55, 97–121. doi:https://doi.org/10.1016/j.eeh.2014.09.001
- Cronqvist, H., & Fahlenbrach, R. (2008). Large shareholders and corporate policies. Review of Financial Studies, 22(10), 3941–3976. doi:https://doi.org/10.1093/rfs/hhn093
- David, T., & Westerhuis, G. (2014). The power of corporate networks: A comparative and historical perspective. London: Routledge.
- Davis, G. F. (1991). Agents without principles? The spread of the poison pill through the intercorporate network. Administrative Science Quarterly, 36(4), 583–613. doi:https://doi.org/10.2307/2393275
- DeJong, D., & Ling, Z. (2013). Managers: Their effects on accruals and firm policies. Journal of Business Finance & Accounting, 40(1–2), 82–114. doi:https://doi.org/10.1111/jbfa.12012
- De Jong, A., Kabir, R., Marra, T., & Röell, A. (2001). Ownership and control in the Netherlands. In F. Barca & M. Becht (Eds.), The control of corporate Europe (pp. 188–206). New York: Oxford University Press.
- De Jong, A., Röell, A., & Westerhuis, G. (2014). The evolving role of shareholders in Dutch corporate governance. In K. E. Sluyterman (Eds.), Varieties of capitalism and business history: The Dutch case (pp. 28–50). New York: Routledge.
- DiMaggio, P., & Powell, W. W. (1983). The iron cage revisited: Collective rationality and institutional isomorphism in organizational fields. American Sociological Review, 48(2), 147–160. doi:https://doi.org/10.2307/2095101
- Fama, E. F. (1980). Agency problems and the theory of the firm. Journal of Political Economy, 88(2), 288–307. doi:https://doi.org/10.1086/260866
- Ferris, S. P., Jagannathan, M., & Pritchard, A. C. (2003). Too busy to mind the business? Monitoring by directors with multiple board appointments. The Journal of Finance, 58(3), 1087–1111. doi:https://doi.org/10.1111/1540-6261.00559
- Fich, E. M., & Shivdasani, A. (2006). Are busy boards effective monitors? The Journal of Finance, 61(2), 689–724. doi:https://doi.org/10.1111/j.1540-6261.2006.00852.x
- Ge, W., Matsumoto, D., & Zhang, J. L. (2011). Do CFOs have style? An empirical investigation of the effect of individual CFOs on accounting practices. Contemporary Accounting Research, 28(4), 1141–1179. doi:https://doi.org/10.1111/j.1911-3846.2011.01097.x
- Geisser, S. (1975). The predictive sample reuse method with applications. Journal of the American Statistical Association, 70(350), 320–328. doi:https://doi.org/10.2307/2285815
- Graham, J. R., Li, S., & Qiu, J. (2012). Managerial attributes and executive compensation. Review of Financial Studies, 25(1), 144–186. doi:https://doi.org/10.1093/rfs/hhr076
- Green, S. B. (1991). How many subjects does it take to do a regression analysis? Multivariate Behavioral Research, 26(3), 499–510. doi:https://doi.org/10.1207/s15327906mbr2603_7
- Hall, P. A., & Soskice, D. (2003). Varieties of capitalism and institutional change: A response to three critics. Comparative European Politics, 1(2), 241–250. doi:https://doi.org/10.1057/palgrave.cep.6110010
- Harris, I. C., & Shimizu, K. (2004). Too busy to serve? An examination of the influence of overboarded directors. Journal of Management Studies, 41(5), 775–798. doi:https://doi.org/10.1111/j.1467-6486.2004.00453.x
- Haunschild, P. R. (1993). Interorganizational imitation: The impact of interlocks on corporate acquisition activity. Administrative Science Quarterly, 38(4), 564–592. doi:https://doi.org/10.2307/2393337
- Heemskerk, E., & Fennema, M. (2009). Network dynamics of the Dutch business elite. International Sociology , 24(6), 807–832. doi:https://doi.org/10.1177/0268580909343496
- Helmers, M. H., Mokken, R. J., Plijter, R. C., & Stokman, F. N. (1975). Graven naar Macht: Op Zoek naar de Kern van de Nederlandse Economie. Amsterdam: Van Gennep.
- Hermalin, B. E., & Weisbach, M. S. (2003). Boards of directors as an endogenously determined institution: A survey of the economic literature. FBRNY Economic Policy Review, 9(1), 7–26.
- Johnson, J. L., Daily, C. M., & Ellstrand, A. E. (1996). Boards of directors: A review and research agenda. Journal of Management, 22(3), 409–438. doi:https://doi.org/10.1177/014920639602200303
- Johnson, R. B., & Onwuegbuzie, A. J. (2004). Mixed methods research: A research paradigm whose time has come. Educational Researcher, 33(7), 14–26. doi:https://doi.org/10.3102/0013189X033007014
- Kesner, I. F., & Johnson, R. B. (1990). An investigation of the relationship between board composition and stockholder suits. Strategic Management Journal, 11(4), 327–336. doi:https://doi.org/10.1002/smj.4250110408
- Khanna, T., & Rivkin, J. W. (2006). Interorganizational ties and business groups boundaries: Evidence from an emerging economy. Organization Science, 17(3), 333–352. doi:https://doi.org/10.1287/orsc.1060.0188
- Lamoreaux, N. R. (1991). ‘No arbitrary discretion’: Specialisation in short-term commercial lending by banks in late nineteenth-century New England. Business History, 33(3), 93–118. doi:https://doi.org/10.1080/00076799100000103
- Lluch, A., Rinaldi, A., Salvaj, E., & Vasta, M. (2017). Directors and syndics in corporate networks: Argentina and Italy compared (1913-1990). Business History, 61, 603–628. doi:https://doi.org/10.1080/00076791.2017.1382474
- Lorsch, J., & MacIver, E. (1989). The reality of America’s corporate boards. Cambridge, MA: Harvard Business School Press.
- Martin, G., Gozubuyuk, R., & Becerra, M. (2015). Interlocks and firm performance: The role of uncertainty in the directorate interlock performance relationship. Strategic Management Journal, 36(2), 235–253. doi:https://doi.org/10.1002/smj.2216
- Mizruchi, M. (1996). What do interlocks do? An analysis, critique, and assessment of research on interlocking directorates. Annual Review of Sociology, 22(1), 271–298. doi:https://doi.org/10.1146/annurev.soc.22.1.271
- Morck, R., & Yeung, B. (2011). Economics, history, and causation. Business History Review, 85(1), 39–63. doi:https://doi.org/10.1017/S000768051100002X
- Musacchio, A., & Read, I. (2007). Bankers, industrialists, and their cliques: Elite networks in Mexico and Brazil during early industrialization. Enterprise and Society, 8(4), 842–880. doi:https://doi.org/10.1093/es/khm079
- Pfeffer, J. (1972). Size and composition of corporate boards of directors: The organization and its environment. Administrative Science Quarterly, 17(2), 218–228. doi:https://doi.org/10.2307/2393956
- Pennings, J. M. (1980). Interlocking directorates. San Francisco: Jossey-Bass Inc Pub.
- Rajan, R. G., & Zingales, L. G. (2003). Saving capitalism from the capitalists: Unleashing the power of financial markets to create wealth and spread opportunity. New York: Chicago Booth Papers.
- Richardson, S. A., Tuna, A., & Wysocki, P. D. (2003). Accounting for taste: Board member preferences and corporate policy choices. MIT Sloan Working Paper No. 4307-03. Retrieved from https://ssrn.com/abstract=405101 or http://dx.doi.org/10.2139/ssrn.405101
- Schouten, N., Glastra van Loon, K., Kox, T., & de Ridder, P. (1998). Atlas van de Macht. Rotterdam: Ketch-Up Press.
- Shane, S., & Cable, D. (2002). Network ties, reputation, and the financing of new ventures. Management Science, 48(3), 364–381. doi:https://doi.org/10.1287/mnsc.48.3.364.7731
- Sluyterman, K. E. (2005). Dutch enterprise in the twentieth century: Business strategies in a small open economy. London: Routledge.
- Sluyterman, K. E. (2014). Varieties of capitalism and business history: The Dutch case. London: Routledge.
- Small, M. L. (2011). How to conduct a mixed methods study: Recent trends in a rapidly growing literature. Annual Review of Sociology, 37(1), 57. doi:https://doi.org/10.1146/annurev.soc.012809.102657
- Streeck, W. (2001). Introduction: Explorations into the origins of nonliberal capitalism in Germany and Japan. In The origins of nonliberal capitalism: Germany and Japan in comparison (pp. 1–38). New York: Cornell University Press.
- Tashakkori, A., & Teddlie, C. (2003). Handbook of Mixed Methods in Social and Behavorial Research. Thousand Oaks: Sage.
- Tashakkori, A., & Teddlie, C. (2010). Sage handbook of mixed methods in social & behavioral research. New York: Sage.
- Tibshirani, R. (1996). Regression shrinkage and selection via the lasso. Journal of the Royal Statistical Society: Series B (Methodological), 58(1), 267–288. doi:https://doi.org/10.1111/j.2517-6161.1996.tb02080.x
- Useem, M. (1979). The social organization of the American business elite and participation of corporation directors in the governance of American institutions. American Sociological Review, 44(4), 553–572. doi:https://doi.org/10.2307/2094587
- Uzzi, B. (1996). The sources and consequences of embeddedness for the economic performance of organizations: The network effect. American Sociological Review, 61(4), 674. doi:https://doi.org/10.2307/2096399
- Westerhuis, G. (2014). The Dutch corporate network: Considering its persistence. In T. David & G. Westerhuis (Eds.), The power of corporate networks: A comparative and historical perspective. (pp. 107–124). Routledge.
- Westerhuis, G., & De Jong, A. (2015). Over Geld en Macht: Financiering en corporate governance van het Nederlandse Bedrijfsleven. Amsterdam: Boom.
- Westphal, J. D. (1999). Collaboration in the boardroom: Behavioral and performance consequences of CEO-board social ties. Academy of Management Journal, 42(1), 7–24. doi:https://doi.org/10.2307/256871
- Wilson, J. F., Buchnea, E., & Tilba, A. (2017). The British corporate network, 1904-1976: Revisiting the finance-industry relationship. Business History, 60, 779–806. doi:https://doi.org/10.1080/00076791.2017.1333106
- Windolf, P. (1998). Elite networks in Germany and Britain. Sociology, 32(2), 321–351. doi:https://doi.org/10.1177/0038038598032002006
List of references for prosopography
Books
- den Tex, C. (2013). Ik ben een koopman. Kroniek van de familie Fentener van Vlissingen. De Geus.
- Dutilh, W. F., & Taudin Chabot, M. Economisch-Historisch Jaarboek (Vol. 31, pp. 205–208).
- Helderman, C. (2014). Marius Taudin Chabot 1884-1966. In J. Visser (Ed.), Nederlandse Ondernemers. Rotterdam 1850-1950 (pp. 68–73). Zutphen.
- Hoynck van Papendrecht, A. Gedenkboek A. van Hoboken & Co, 1774-1924.
- Kleyn van Willigen, P. (1990). Mr. H.N. Wakkie, 1911-1989. Rotterdams Jaarboekje 1990 (pp. 161–164).
- Uitlaat, Magazine KPM.
- Visser J. et al. eds. (2002). Rotterdamse ondernemers 1850-1950. Rotterdam.
Newspapers, consulted via delpher
- Bataviaasch Nieuwsblad
- Nieuwsblad van het Noorden
- De Indische Courant
- Het Nieuws van den Dag voor Nederlandsch-Indië
- Het Nieuws van den Dag: Kleine Courant
- Rotterdamsch Nieuwsblad
- De Sumatra Post
- De Tijd
- NRC Handelsblad
- De Telegraaf
- Algemeen Handelsblad
- Het Vrije Volk