
The fragility of our environmental, social and economic systems has never been so obvious, from the floods, fires and other crises associated with global climate change in 2019 to the debilitating impacts of COVID-19 this year. These are a stark reminder of the urgent need to address the UN’s Sustainability Development Goals (SDGs), essentially, a ‘call-to-arms’ to reverse the vulnerability inherent in our current systems and in the livelihoods of vast numbers of people, and to build resilience. The 17 goals were adopted by the UN Member States in 2015 to be delivered by 2030 – a very ambitious programme. The goals seek to address world poverty, hunger and a range of other inequalities, while at the same time protecting our environment and nurturing its resources ().
Figure 1. The UN Sustainable Development Goals (https://www.un.org/sustainabledevelopment/).
It is imperative that the global issues addressed by the SDGs are underpinned by clear information that allows decision-makers and the public to think critically and to make informed choices. This is truer now than ever as the UN (Citation2020) recognizes ‘COVID-19 is not only challenging global health systems but testing our common humanity. It affects everyone everywhere. It hits the poorest and most vulnerable communities the hardest, deepening existing inequalities’. Each SDG, and the issues underpinning them, are multi-scalar and their achievement will, therefore, depend on successful interventions at local, national and international scales.
Spatial data hold the key to understanding many of these issues. An essential tool at our disposal is the map – the most immediate and effective communicator of spatial information. Maps are a global medium for tackling global issues; they are not confined to administrative boundaries, languages, ages, racial groups or academic disciplines. Maps also provide a visual stimulus to thinking on issues that are inherently geographical, from habitat destruction to the migration of environmental refugees. Their form and function, however, need to be understood, both in terms of design and use, because maps can also mislead (as their use in news coverage of COVID-19 has shown recently).
Building on visual theory, user studies and design principles, cartography – which may be defined as the art, science and technology of map-making – is concerned with the effective communication of spatial information. Cartographers have long developed innovative and creative solutions for analysing, visualizing and presenting this information. Cartographic research, therefore, plays a crucial role, both in addressing the SDGs as a whole and in supporting the international response to each goal. From building sustainable infrastructure and investigating epidemiology to increasing climate awareness and promoting quality education, cartographers have a significant part to play in improving our understanding of the spatial dimensions of each of the 17 goals and their interactions with one another.
First issued in June 1964, The Cartographic Journal has showcased international peer-reviewed research in the field for almost 60 years. Subtitled ‘The World of Mapping’, its remit encompasses the full range of principles, techniques and applications of cartography and supports the core mission of the British Cartographic Society to promote best practice in map-making. As an official journal of the International Cartographic Association (ICA), which launched a series of posters in 2015 to demonstrate how the SDG indicators could be mapped (see ICA, Citation2017), The Cartographic Journal is connected to the global cartographic community and is committed to advancing the subject on the world stage.
Research published in The Cartographic Journal, therefore, highlights the important role that cartography plays in meeting the SDGs. Several papers have been published in recent years on topics that have direct relevance to the goals and their indicators. These include mapping poverty and inequality in London (Donnelly, Citation2002; Green, Citation2012), community mapping initiatives to alleviate hunger (Robinson et al., Citation2017), creating an atlas for supporting cancer-control activities (MacEachren et al., Citation2008), providing free topographic maps to 11-year-olds to improve geographical education (Owen, Citation2007), implementing cartography and GIS in the classroom (Dunn and Smith, Citation2013), using maps and location-based games in interdisciplinary education (Pánek et al. Citation2018), mapping water quality (Ruas and Pham, Citation2015), developing symbols for demining and crisis mapping for humanitarian organizations (Kostelnick et al., Citation2008; Kostelnick and Hoeniges, Citation2019), mapping urban spaces for wheelchair users (Beale et al., Citation2006), mapping urban expansion in Nepal (Haack, Citation2009), developing topographic map symbols for urban areas in Brazil (Sluter et al., Citation2018), environmental mapping in Poland (Ławniczak and Kubiak, Citation2013) and in Denmark (Svenningsen, Citation2016), improving effective communication of climate change (Johannsen et al., Citation2018) and weather-driven hazards (Pappenberger et al., Citation2019) through maps and cartograms (), using automated methods to extract natural drainage density patterns (Stanislawski et al., Citation2015), developing digital methods for mapping indigenous knowledge and rights (Olson et al., Citation2016), investigating the geopolitics of natural resources (Vujakovic, Citation2014), understanding the use and misuse of maps (Kent, Citation2017) and promoting the responsible mapping of political boundaries (Kent, Citation2019; Headland, Citation2020).
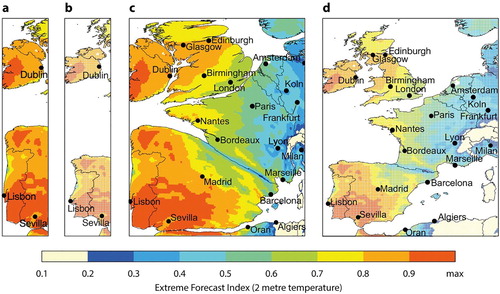
Figure 2. Extreme forecast Index (2 m temperature) for heatwaves in Western Europe, from Pappenberger et al. (Citation2019). Lead time displayed: 3–10 days; (a, b) geographical area restricted to extreme western part of the continent; (c, d) Western Europe; (b, c) undistorted maps.
Additionally, a Special Issue of The Cartographic Journal, on the past, present and future of participatory GIS (geographical information systems) and public participation GIS, was published in November 2016 during International Map Year. This brought together several papers which explored a range of ethical and practical issues surrounding their implementation and examined the empowerment of communities from multiple perspectives (see Kar et al., Citation2016; Kent, Citation2016). A critical approach to mapping, i.e. one that recognizes the role of power-relations in cartographic processes and the capacity of maps to mislead, is crucial to the advancement of sustainability education.
The diversity of themes, scales, audiences and aims of research published in The Cartographic Journal outlined above, therefore, illustrates the versatility of the discipline and how it continues to play an important role in addressing the complex and multifaceted issues underpinning each SDG. Without maps, we are unable to understand the spatial dimensions of global inequality and without the discipline of cartography, we will not discover how best to apply our geographical knowledge in achieving them.
Notes on the cover
The cover image is an illustration of the universe based on a logarithmic scale by Argentinean artist Pablo Carlos Budassi. It was created from logarithmic maps made by astronomers at Princeton University using data acquired by NASA. The image is discussed in this Issue by Rasmus Winther, who explores its map-like form as a visual analogy of scientific theory about the nature, structure and history of the universe.
Disclosure statement
No potential conflict of interest was reported by the author(s).
Notes on the contributors
 Alexander J. Kent (Editor) is Reader in Cartography and Geographic Information Science at Canterbury Christ Church University in the UK, where he lectures on map design, GIS, remote sensing and on European and political geography. His research explores the relationship between maps and society, particularly the intercultural aspects of topographic map design and the aesthetics of cartography. He is also Chair of the ICA Commission on Topographic Mapping and Immediate Past President of the British Cartographic Society.
 Peter Vujakovic (Associate Editor) is Professor of Geography at Canterbury Christ Church University. His research focuses on social, cultural and political aspects of mapping, from children's sense of place (Meaningful Maps - http://meaningfulmaps.org) to maps in journalism, with a specific interest in geopolitics and natural resource conflicts. He made and commissioned maps for the World Development Movement (WDM) on development issues in the 1980s, just as the concept of sustainable development began to gather momentum.
 Gwilym Eades (Associate Editor) is Lecturer in Human and Environmental Geography in the Department of Geography at Royal Holloway University of London, where he is director of the GeoVisual Methods Lab (GVML). His research is currently focused on mapping and counter-mapping in areas of historic and ongoing cultural conflict in tourist and non-tourist areas of Scotland and Canada.
 Martin Davis (Editorial Assistant and Editor, Book Reviews) is based in the Research and Higher Education Division of the Royal Geographical Society (with IBG) in London. After receiving the British Cartographic Society's Ian Mumford Award in 2015, Martin completed his PhD thesis in Geography at Canterbury Christ Church University in 2018. Martin has been Editorial Assistant and Book Reviews Editor of The Cartographic Journal since 2014. In 2019, Martin was appointed Executive Secretary of the ICA Commission on Topographic Mapping.
References
- Beale, L., Field, K., Briggs, D., Picton, P., and Matthews, H. (2006) “Mapping for Wheelchair Users: Route Navigation in Urban Spaces” The Cartographic Journal 43 (1) pp.68–81 DOI: 10.1179/000870406X93517.
- Donnelly, S. (2002) “Mapping Rich and Poor: Putting Charles Booth's Enquiry into London Life and Labour Online” The Cartographic Journal 39 (1) pp.81–85 DOI: 10.1179/caj.2002.39.1.81 doi: 10.1179/000870402787288018
- Dunn, S., and Smith, M. (2013) “Teaching the Next Generation of Cartographers” The Cartographic Journal 50 (2) pp.144–147 DOI:10.1179/0008704113Z.00000000090.
- Green, M.A. (2012) “Mapping Inequality in London: A Different Approach” The Cartographic Journal 49 (3) pp.247–255 DOI:10.1179/1743277412Y.0000000018.
- Haack, B. (2009) “A History and Analysis of Mapping Urban Expansion in the Kathmandu Valley, Nepal” The Cartographic Journal 46 (3) pp.233–241 DOI:10.1179/000870409X12488753453417.
- Headland, R.K. (2020) “Territory and Claims in the Antarctic Treaty Region: A Disquisition on Historical and Recent Developments” The Cartographic Journal 57 (2) pp.160–174 doi: 10.1080/00087041.2019.1677035
- International Cartographic Association (2017) “Maps and Sustainable Development Goals” Available at: https://icaci.org/maps-and-sustainable-development-goals/ (Accessed: 7th May 2020).
- Johannsen, I.M., Lassonde, K.A., Wilkerson, F., and Schaab, G. (2018) “Communicating Climate Change: Reinforcing Comprehension and Personal Ties to Climate Change Through Maps” The Cartographic Journal 55 (1) pp.85–100 DOI:10.1080/00087041.2017.1386834.
- Kar, B., Renee, S., Haklay, M., and Ghose, R. (2016) “Public Participation GIS and Participatory GIS in the Era of GeoWeb” The Cartographic Journal 53 (4) pp.296–299 DOI:10.1080/00087041.2016.1256963.
- Kent, A.J. (2016) “Editorial Preface” The Cartographic Journal 53 (4) p.295 DOI:10.1080/00087041.2016.1258775.
- Kent, A.J. (2017) “Trust Me, I’m a Cartographer: Post-Truth and the Problem of Acritical Cartography” The Cartographic Journal 54 (3) pp.193–195 DOI:10.1080/00087041.2017.1376489.
- Kent, A.J. (2019) “A Picture and an Argument: Mapping for Peace with a Cartography of Hope” The Cartographic Journal 56 (4) pp.275–279 DOI:10.1080/00087041.2019.1694804.
- Kostelnick, J.C., and Hoeniges, L.C. (2019) “Map Symbols for Crisis Mapping: Challenges and Prospects” The Cartographic Journal 56 (1) pp.59–72 DOI:10.1080/00087041.2017.1413810.
- Kostelnick, J.C., Dobson, J.E., Egbert, S.L., and Dunbar, M.D. (2008) “Cartographic Symbols for Humanitarian Demining” The Cartographic Journal 45 (1) pp.18–31 DOI:10.1179/000870408X276585.
- Ławniczak, R., and Kubiak, J. (2013) “Implementation of the 1∶10 000 Scale for Visualisation of Environmental Changes” The Cartographic Journal 50 (1) pp.82–90 DOI:10.1179/1743277412Y.0000000009.
- MacEachren, A.M., Crawford, S., Akella, M., and Lengerich, G. (2008) “Design and Implementation of a Model, Web-based, GIS-Enabled Cancer Atlas” The Cartographic Journal 45 (4) pp.246–260 DOI:10.1179/174327708X347755.
- Olson, R., Hackett, J., and DeRoy, S. (2016) “Mapping the Digital Terrain: Towards Indigenous Geographic Information and Spatial Data Quality Indicators for Indigenous Knowledge and Traditional Land-Use Data Collection” The Cartographic Journal 53 (4) pp.348–355 DOI:10.1080/00087041.2016.1190146.
- Owen, E. (2007) “Ordnance Survey's Free Maps for 11 Year Olds Scheme” The Cartographic Journal 44 (2) pp.101–110 DOI:10.1179/000870407X213422.
- Pánek, J., Gekker, A., Hind, S., Wendler, J., Perkins, C., and Lammes, S. (2018) “Encountering Place: Mapping and Location-Based Games in Interdisciplinary Education” The Cartographic Journal 55 (3) pp.285–297 DOI:10.1080/00087041.2017.1386342.
- Pappenberger, F., Cloke, H.L., and Baugh, C.A. (2019) “Cartograms for Use in Forecasting Weather-Driven Natural Hazards” The Cartographic Journal 56 (2) pp.134–145 DOI:10.1080/00087041.2018.1534358.
- Robinson, J.A., Block, D., and Rees, A. (2017) “Community Geography: Addressing Barriers in Public Participation GIS” The Cartographic Journal 54 (1) pp.5–13 DOI:10.1080/00087041.2016.1244322.
- Ruas, A., and Pham, H. (2015) “Symbolization and Generalization to Map Water Pipe Data Flow and Water Quality at Different Scales” The Cartographic Journal 52 (2) pp.149–158 DOI:10.1080/00087041.2015.1119465.
- Sluter, C.R., Camboim, S.P., Iescheck, A.L., Pereira, L.B., Castro, M.C., Yamada, M.M., and Araújo, V.S. (2018) “A Proposal for Topographic Map Symbols for Large-Scale Maps of Urban Areas in Brazil” The Cartographic Journal 55 (4) pp.362–377 DOI:10.1080/00087041.2018.1549307.
- Stanislawski, L.V., Falgout, J., and Buttenfield, B.P. (2015) “Automated Extraction of Natural Drainage Density Patterns for the Conterminous United States through High-Performance Computing” The Cartographic Journal 52 (2) pp.185–192 DOI:10.1080/00087041.2015.1119466.
- Svenningsen, S.R. (2016) “The Emergence of an Environmental Cartography in Denmark” The Cartographic Journal 53 (2) pp.101–113 DOI:10.1080/00087041.2016.1148300.
- United Nations (2020) Available at: https://www.un.org/sustainabledevelopment/ (Accessed: 5th May 2020).
- Vujakovic, P. (2014) “The State as a ‘Power Container’: The Role of News Media Cartography in Contemporary Geopolitical Discourse” The Cartographic Journal 51 (1) pp.11–24. doi: 10.1179/1743277413Y.0000000043