ABSTRACT
For designing qualitative interfaces for Public Participatory Geographic Information Systems (PPGIS), the user and use case should be clearly defined. However, PPGIS users may differ significantly, e.g. regarding their cultural background, IT-literacy, or interests. Studies examining varying user types and their impact on PPGIS usability are, however, lacking. In this paper, we analyse the user spectrum through conducting a usability study with 73 participants located in Colombia, Uganda and Austria. We combined a qualitative survey (conducted in all three countries) with an eye-tracking based survey (conducted only in Austria). Most of the usability issues arose due to inexperience in using interactive maps or applications other than social media. Based on the findings, we explored which user context information had an impact on which usability problem. With this, we designed an adaptation gradient that can be used for future research on developing adaptive PPGIS interfaces.
Introduction
Information Technologies (IT) play an important role in the advancement and development of today's society (Sey and Fellows, Citation2011). In particular, mobile technology has rapidly become ubiquitous (Evans-Cowley, Citation2010; McNaughton and Light, Citation2013), having penetrated 70% of the global population (World Bank, Citation2016). This ubiquity has sped up the consumption of information by individuals (Evans-Cowley, Citation2010). These individuals are now able to interact faster with other individuals. This has laid the foundation for the development of new participatory approaches and communication processes for analysis and decision-making over the internet (Evans-Cowley, Citation2010; Campbell and Kwak, Citation2011).
King et al. (Citation1998) state that through these participatory approaches, actors have the opportunity to involve themselves in decision-making processes. They receive responsibilities for improving conditions in their environment (Arnstein, Citation1969; Fiorino, Citation1990). Participatory methods create a ‘citizen-near’ decision-making process (Irvin and Stansbury, Citation2004; Corbett and Keller, Citation2005; Stivers, Citation2016) through engaging citizens to communicate their needs and preferences (Irvin and Stansbury, Citation2004). Through the combination of participatory approaches and IT, Public Participatory Geographic Information Systems (PPGIS) have evolved (Sieber, Citation2006).
As for any application, usability plays an important role for the user’s acceptance of the application. In case a product is not usable, problems arise. Usability problems lead to unsuccessful participation since frustration might arise (Meng and Malczewski, Citation2009b). Jones and Weber (Citation2012) underline that the better the users are able to use the application intuitively, the more effective and efficient the performance is. They state that the cognitive load of the application has an indirectly proportional impact on user performance. The ISO 9241-11 standard defines usability as the ‘Extent to which a product can be used by specified users to achieve specified goals with effectiveness, efficiency, and satisfaction in a specified context of use’ (International Organization for Standardization, Citation1992). These mentioned aspects generally refer to the ease, pleasure, comfort, trust and likeability of carrying out tasks with an application (Nayebi et al., Citation2012). The norm further states that usability may be affected by the context and circumstances of using the system, which includes the type of user, the task, equipment, and physical and organizational environment (Bevan, Citation1995).
Summarizing the ISO definition, an ideal application design should respond to (the requirements of) specified users and leverage context characteristics. For example, providing an interface for both elderly people and young adults would potentially diminish usability since the requirements of both user types might differ significantly. We argue that the above-depicted scenario is common for the use of PPGIS. As an example, tools like Maptionnaire, Social Pinpoint, or OpenStreetMap are used in multiple countries with a large variance of users. These users might differ in their demographic characteristics, their roles (e.g. citizens, urban planners, city or municipality staff, scientists), their education, their interests, and so on. Prior usability studies in GIScience and related fields (such as Haklay and Tobón Citation2003, Meng and Malczewski Citation2009a, Bugs et al. Citation2010, Newman et al. Citation2010, Bugs Citation2012, Poplin Citation2015, Atzmanstorfer et al. Citation2016, Gottwald et al. Citation2016) have not investigated how to deal with multiple user types while maintaining a high level of usability. Some studies include facilitators who can intervene and help users who may need assistance in using a PPGIS through capacity building or one-on-one support (Aditya, Citation2010; Eitzinger et al., Citation2019). Although this is one potential way for introducing PPGIS to diverse groups of citizens, it is also time and capital intensive in the long run and does not solve the underlying problem (Eitzinger et al., Citation2019).
Consequently, a gap exists between theory and practice when it comes to PPGIS usability: even though we have observed PPGIS being used by varying user types, it is still not clear how to merge the preferences and requirements of these different user types into the PPGIS design (Bugs, Citation2012) without accepting usability deficiencies. A logical consequence would be to design multiple PPGIS interfaces that respond to the requirements of each user type to concur with the ISO usability norm. One approach is to include adaptive functionalities into the interface (Dey and Abowd, Citation1999), i.e. to optimize the interface to each user type with a suitable interface. Among others, adaptive map interfaces have been discussed in studies like Ballatore and Bertolotto (Citation2015) and Kiefer et al. (Citation2017). For exploring new opportunities for the inclusion of adaptive interfaces into the PPGIS design, this paper sets distinct objectives and non-objectives ().
Table 1. Objectives and non-objectives of this paper.
In support of these objectives, we conducted a usability study by carrying out a qualitative survey with a PPGIS used in three countries: Colombia, Uganda and Austria. We selected these countries expecting a difference in user characteristics based on their differing development level, and sub-divided the participants into groups according to their level of digital literacy and age. In Austria, we further combined the survey methodology with eye-tracking to expand our understanding of potential usability problems (Çöltekin et al., Citation2009).
Our study aims to understand the differences in usability and user preferences of a broad range of users in three different study areas. For this, we raise the following research questions:
Which are the main usability problems of a PPGIS for novice users?
To what degree does the usability vary between participants and is there a connection to the interface preferences?
What additional insights does the combined approach, using a qualitative survey and eye-tracking statistics, offer?
What conclusions can we draw from these insights for creating an adaptation gradient?
Methodology
The study at hand analyses how intuitive the GeoCitizen application is for novice users. We selected this PPGIS since the tool is used in multiple countries, serving as an example for a globally used PPGIS. The GeoCitizen application () asks for citizens’ ideas and preferences – based on their unique local knowledge – to be included in urban or spatial planning processes. The aim of the PPGIS is to enable dynamic communications and discussions among citizens of cities, towns, or municipalities (Atzmanstorfer et al., Citation2014). For this, citizens can respond to surveys and upload or discuss georeferenced proposals.
Figure 1. GeoCitizen application.
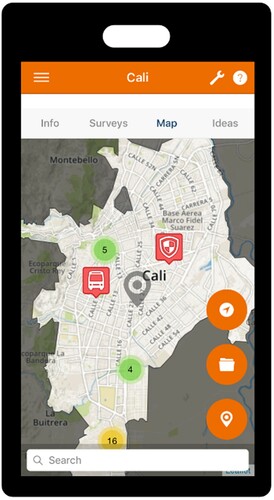
In 2015, Atzmanstorfer et al. (Citation2016) conducted a usability study with GeoCitizen with participants from marginalized communities from Cali, Colombia. Since then, GeoCitizen developed into a tool that is used in multiple countries with a large variance of user groups. In this paper, we want to take into account this development by not only testing the usability of the tool with one user group but with multiple. In correspondence with the ISO 9241-11 usability standard, we measured the effectiveness, efficiency and satisfaction of using GeoCitizen.
Survey design
The study consisted of two parts (). In the first part (based on Atzmanstorfer et al. (Citation2016)), we asked the participants to carry out six tasks with the application. We measured three usability metrics (Nielsen, Citation2001): first, the effectiveness was assessed through the error rate in the completion of these tasks – completion without errors, with light non-critical errors, with moderate non-critical errors and with critical errors. Light non-critical errors refer to slight usability problems, such as short confusions that were easily and quickly overcome. Moderate non-critical errors, on the other hand, are confusions that took a longer time to overcome. Critical errors refer to confusions that were not overcome. Second, the efficiency of the application was measured by analysing the time that the participants needed to complete an activity. Third, through a questionnaire, we asked how satisfied the participants were with the usability.
Table 2. Survey design.
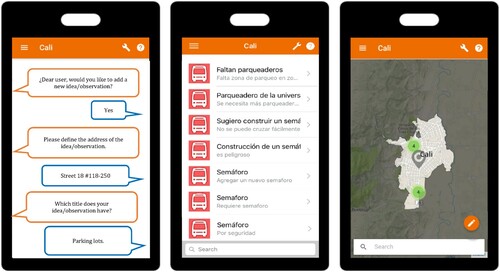
In the second part of the survey, we provided three interface sketches, serving as alternative interface designs to the interfaces the participants were using in the first part of the survey (). We provided (1) a simple interface with a text-based wizard, which guides the user through the functionalities of the application, (2) a simple interface without a wizard, presenting the content as text elements and (3) a simple map with a highly reduced range of functionalities ().
Figure 2. Interface alternatives.
In accordance with Atzmanstorfer et al. (Citation2016), we asked the participants to express their thoughts, feelings and opinions throughout the survey to protocolling them. This gave additional insights for contextualizing the results of the survey parts.
Eye-tracking analysis
In the first part of the study, participants carried out different tasks with the application and provided us with information about their cognitive process in a think-aloud fashion. As Çöltekin et al. (Citation2009) state, this activity might be erroneous since participants may not be fully able to verbally express their cognitive process in a precise way. For overcoming this, we used eye-tracking technology to more precisely and objectively measure the cognitive process of the participant (Poole and Ball, Citation2005). Eye-tracking data may also indicate which areas on the interface are complex and therefore give feedback about the usability of the interface (Poole and Ball, Citation2005; Çöltekin et al., Citation2009). With eye-tracking data, it is possible to understand when, how long, and how many times the participant looked at specific areas on the interface. These areas are commonly named Areas of Interest (AOI).
For this study, we opted to include an eye-tracking device for the first part of the study (completing different tasks) with the participants in Austria. The following metrics were used:
| – | Time to first glance; | ||||
| – | Number of fixations; and | ||||
| – | Duration of fixations. | ||||
The comparison between the time to first glance on the target AOI (the AOI that had to be used for completing a task) and the time spent on each task indicates whether the participant understood how to carry out the task. The faster the participant looked at the target AOI, the better its visibility (Poole and Ball, Citation2005; Çöltekin et al., Citation2009). The number of fixations on the target AOI compared to the overall number of fixations on the screen indicated how much the participant had to search in other areas to understand how to carry out a task. The higher the overall number of fixations, the less efficient the search for the right functionality to carry out a task may be (Poole and Ball, Citation2005; Çöltekin et al., Citation2009). Last, the duration of fixations on the target AOI can have different meanings: longer durations can indicate that the AOI is engaging, or it implies that the participant did not understand the meaning of the representation at the AOI (Poole and Ball, Citation2005). Additional context is required to interpret fixation duration for these reasons (see Section 4). For the eye-tracking device, we used the Dikablis professional eye-tracker with an accuracy of the glance direction of up to 0.1°−0.3°. We used the software D-Lab 3 for processing the eye-tracking data.
Participants
We carried out the survey with 73 participants: 28 from Colombia, 20 from Uganda and 20 from Austria. The participants from Colombia were students from the Camacho University in Cali (6), and fieldworker (7) and scientific staff (15) from the International Center for Tropical Agriculture (CIAT) in Palmira. In Uganda, participants were coffee farmers from the Luweero district (8), students from Makerere University in Kampala (7), and administrative (1) and scientific staff (4) from the International Institute of Tropical Agriculture (IITA) in Kampala. In Austria, students from the University of Salzburg (2), administrative or technical (8) and scientific (10) employees of the University of Salzburg participated. The participants were invited by email and assigned a scheduled time slot.
To understand the characteristics of our participants, we asked for different profile information as a basis for analysing and defining user groups (). The factors age and digital literacy were most relevant to this study. Therefore, we based the user grouping mainly on these categories. Firstly, for coherence, the same age ranges were selected as in the previous usability study by Atzmanstorfer et al. (Citation2016). Secondly, digital literacy was defined based on a combination of these factors:
Survey questions about the educational level, the self-rated computer skills and the self-rated smartphone skills.
Observations by the leader of this study regarding the smartphone use experience of each participant defined based on the confidence and velocity of using the smartphone.
Since underrating or overrating digital literacy in self-reports is common (Warner, Citation1965), we combined the self-rated variables with observations of the participants by the study leader. Subsequently, the participants were divided into two digital literacy levels: low-medium and medium-high. A low-medium digital literacy level refers to participants that were not as confident and experienced using smartphone applications as other participants of the respective study area.
Table 3. User profile and number of participants.
shows the number of participants for each user group. In the Results section, we base the visualization of the study results on these user groups.
Table 4. User groups and number of participants.
Test procedure
We conducted the survey in a quiet atmosphere at a desk. The smartphone (Samsung Galaxy A3 (2017) with a 4.7″ display, Android version 7) was lying on the desk without being moved or held in the hand by the participant. In Austria, for the first survey part, the participants were attached to the eye-tracking device, which was installed on a desk.
We welcomed each participant and explained the procedure of the survey. We gave oral instructions to the participants about each task and survey part and assured the participants that they themselves were not being evaluated by their performance. During the survey (in between tasks), we allowed the participants to ask questions in case clarification was needed. Each survey took between 20 and 30 minutes.
Results
Application interaction tasks
For understanding how usable the application is for the four user groups of the three study areas, we measured the effectiveness (error rate), the efficiency (time spent on each task), and satisfaction (evaluation by the participant).
shows the effectiveness of the application by the user groups and study areas. The four plots correspond to each user group and present the error metrics (no error, light non-critical error, moderate non-critical error, critical error). The coloured columns represent the study areas.
Figure 3. Error rate (effectiveness).
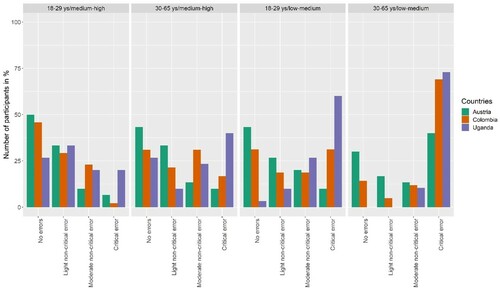
Most of the participants of the user group 18–29 years and medium-high IT skills of all study areas completed the tasks without errors or with light non-critical errors. The same trend is evident for the Austrian participants of the user group 30–65 years and medium-high IT skills and 18–29 years and low-medium IT skills. Colombian and Austrian participants, however, showed a higher number of moderate non-critical or critical errors. The trend towards moderate non-critical errors is also noticeable for Austrian participants. Last, most of the participants of the user group 30–65 years and low-medium IT skills from Colombia and Uganda completed the tasks with critical errors.
To summarize, the error rate of all user groups and all study areas show a similar trend. The higher the IT-literacy, the fewer moderate non-critical or critical errors were committed when completing the tasks. For the user groups of low-medium IT skills, we detect a difference between the study areas. Austrian participants committed fewer critical errors than participants from Uganda and Colombia.
For understanding the efficiency and satisfaction of the application, we further measured the duration of task completion and asked the participants to evaluate the application after each task (Appendix 1 and 2). As for these measurements, they show similar results with similar trends as shown in .
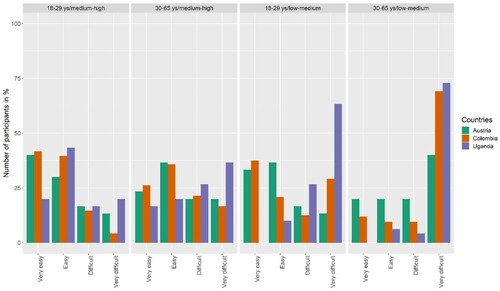
Interface design preferences
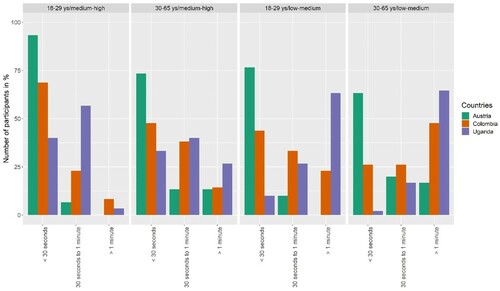
In a second step, we asked each participant about their preferences regarding the interface (). The four plots represent the user groups, each column showing the results of each study area. The colours of the stacked columns indicate the interface choice: three alternative interfaces (guided interface, simple interface and simple map interface) and the current interface version. The darker the colour, the more advanced the interface.
Figure 4. Interface preference by user group and country.
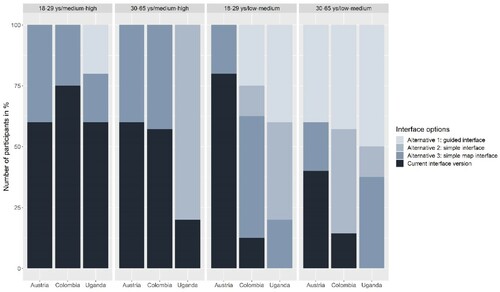
For the user groups of medium-high IT skills, the study areas Austria and Colombia show a similar trend, where all participants opted for an interface with a map, and most of the participants preferred the current interface version (60% and 75%, respectively). 60% of Ugandan participants of the user group 18–29 years with medium-high IT skills also opted for the current interface. In contrast to the other study areas, 20% of the participants of this user group opted for a guided interface. For the older age group and same IT level of Ugandan participants, only 20% opted for the current interface and 80% for a simple interface.
Further, there is a striking difference between the study areas of the user groups of low-medium IT skills. Austrian participants of the user group 18–29 years and low-medium IT skills mostly opted for the current interface (80%); 20% of these participants voted for a simple map interface. Colombian participants of the same user group mostly voted for a simple map (50%), and 37.5% of the participants opted for a simple interface without a map. Only 12.5% opted for the current interface. The majority of the Ugandan participants of this user group opted for a simple interface (40%) or guided interface (40%). For the user group 30–65 years and low-medium IT skills we observe a mixed response, with a trend to a simpler interface. Most of the Austrian participants (60%) opted for an interface with a map (40% voted for the current interface), and 40% preferred a simple or guided interface. A vast majority of Colombian participants (86%) preferred a simple interface, while only 14% opted for the current interface. In contrast, 62.5% of the Ugandan participants preferred a simple interface. 50% of the participants opted for a guided interface and 37.5% voted for a simple map interface.
To summarize, most of the Austrian participants of all user groups opted for a map interface, mostly for the current version. The only participants that opted for a guided interface were users of the group 30–64 years with low-medium IT skills (40%). For the Colombian and Ugandan participants, we detected a decreasing tendency in choosing the current interface (reading the plots from left to right), meaning from higher to lower IT-literacy. Comparing the results for the interface preferences to the error rate of the participants, demonstrated in the previous section, the error rates, in majority, correspond to the interface choice of the participants. Generally, the more participants that committed moderate non-critical or critical errors, the more participants voted for a simpler interface version.
User remarks
User remarks were noted throughout the survey. Most comments were shared regardless of the study area. In , we list the most stated aspects and some participants’ quotes. The last-listed remark of the table, contextualized with the findings from the previous section, particularly caught our attention. While 88% of all participants stated a map is a useful way to visualize information, only 53% of the participants (39) actually opted for an interface with a map element (see the previous section). Subsetting this, 79% of Ugandan and Colombian participants of low-medium digital literacy (22 out of 28 participants) commented on the usefulness of a map element; while only 46% of these same participants (13 out of 28 participants) preferred an interface with a map as displayed in the previous section. This is a contradiction that we think can be explained by the fact that these user groups indicated having general problems with the map element but are motivated to learn how to use it since they saw the usefulness of a map.
Table 5. Category of remark and participants' quotes.
Eye-tracking statistics
shows the median and variance of the time to first glance on the target AOI (green) and the duration of task completion (red) by user groups (only Austrian participants). The user group with the lowest median time to first glance is the group 18–29 years with low-medium IT skills (2.9 s). While the user group with the lowest median duration of task completion is the group 18–29 years with medium-high IT skills (8.5 s). The user group 30–65 years with low-medium IT skills had the highest median duration of task completion (12.6 s) and the biggest variance of results. The user groups of low-medium IT skills had a higher median duration of task completion than the user groups of medium-high IT skills.
Figure 5. Time to first glance and duration of task completion.
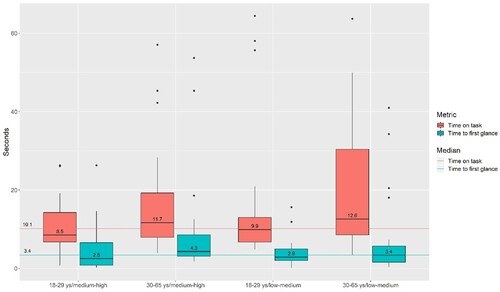
To carry out each task, the time to first glance and the duration of task completion would ideally be short. The short time to first glance would indicate that the participant detected the target AOI early, meaning the AOI draws sufficient attention to it for carrying out a task (better search efficiency). A short duration of task completion would indicate that the target AOI was not only visible enough but also clear enough for the participants to complete and understand the task. Ideally, task completion time and time to first glance should correspond. The younger user groups of both IT skill levels spent almost 30% of the task completion time looking for the target AOI. 70% of the time they used for understanding how to carry out the tasks. In contrast, the older user groups differed in their behaviour. Participants of the user group 30–65 years with medium-high IT skills spent 37% of the task duration on searching for the target AOI, while the same age group with low-medium IT skills spent 27% for the search. In general, it took the participants between 2.5 and 4.3 s to have a first glance on the target AOI. However, the longer task completion duration indicates that participants were not sure of the meaning of the target AOI for completing the task.
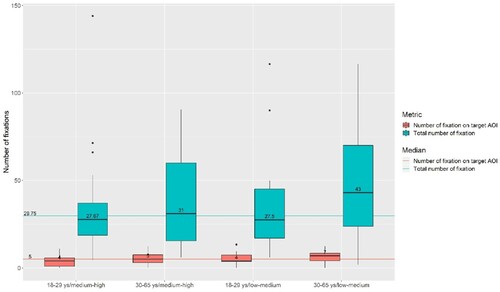
shows the median and the variance of the number of fixations on the target AOI and of the total number of fixations on the whole screen. The lowest median number of fixations on the target AOI (4 fixations) showed participants of the user group 18–29 years of both IT skill levels. In contrast, the highest median number of fixations (total and on the target AOI) had participants of the user group 30–65 years and low-medium IT skills (43 and 7 fixations). As we have seen before comparing the age groups, it is noticeable that the older age groups had a higher number of fixations (in total and on the target AOI). Also, the older age groups exhibited a greater variance of the total number of fixations than the younger age groups, regardless of the IT skill level.
Figure 6. Number of fixations.
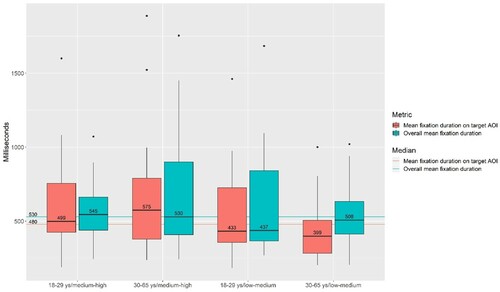
shows the overall mean fixation duration and the mean fixation duration of the target AOI. Here, the longer the fixation, the more difficulties the participant had to extract relevant information. In general, the participants had longer overall fixation durations compared to the fixation duration on the target AOI, except for participants of the user group 30–65 years with medium-high IT skills. The same user group also had the highest median of the fixation duration on the target AOI (575 ms). The lowest median of the mean fixation duration on the target AOI had participants of the user group 30–65 years with low-medium IT skills (399 ms). For the overall mean fixation duration, the lowest median had participants of the user group 18–29 years with low-medium IT skills (437 ms). Comparing the user groups by their IT-literacy, the user groups of low-medium IT skills had a lower median value for the mean fixation duration overall and on the target AOI than user groups of medium-high IT skills. Furthermore, user groups of low-medium IT skills had a median below the average median of all user groups, whereas the user groups of medium-high IT skills had a median situated above or equal to the average median. We further observe a higher variance of the user groups 30–65 years with medium-high IT skills and 18–29 years with low-medium IT skills compared to the remaining user groups.
Figure 7. Mean fixation duration.
Discussion
Results
For the usability analysis, we divided the participants into two age groups and two IT-literacy levels, resulting in four user groups of three study areas. The map interaction functionalities, which we used in this study, required either a higher cognitive load or previous experience or knowledge for using an interactive map and its functionalities. This was particularly challenging for Ugandan participants. These participants were, in majority, not used to working with interactive maps. We observed striking usability problems by these participants, especially of low IT-literacy. Therefore, most of the Ugandan participants preferred a guided or simple interface. The study detected the same trend in usability and design preferences for low IT-literate participants from Colombia. Through observations, these Colombian participants generally seemed to be more experienced in using an interactive map. The problem for these participants in this instance was their lack of experience in using a mobile application. In contrast, high IT-literate participants from Colombia had the same trend in usability and in their interface design choice as Austrian participants. This indicates that high IT-literate Colombian participants have a similar set of knowledge and experience as Austrians and opted for advanced interface functionalities. Austrian participants were generally confident and experienced in using an interface with advanced functionalities. This is also reflected by the analysis of the usability aspects.
The survey results showed that the user group 18–29 years with medium-high IT skills were facing the fewest usability problems of all user groups. We see these results supported by the eye-tracking statistics (only Austrian participants). The short task completion duration, the short time to first glance on the target AOIs, and the low number of fixations indicate, compared to the other user groups, a better on-screen orientation (search efficiency). The eye-tracking statistics also reflect the usability problems that were faced by the user group 30–65 years with low-medium IT skills. The duration for task completion and the number of fixations were much higher than that of the other user groups and indicate less efficiency for completing the tasks. The task duration, the time to first glance, and the number of fixations further depict a difference between the user groups. The younger user groups seem to have better task completion efficiency than the older user groups. Based on these insights, we assume that a longer mean fixation duration indicates that these participants better understood the AOIs. Hence, the higher the mean fixation duration, the more engaging the AOI and the better the task completion efficiency. However, apart from observing the user groups of low-medium IT skills having a shorter mean duration of fixation, we are not able to detect the same trend between the age groups as we have seen with the previously mentioned eye-tracking metrics. This might be explained by the number of participants in the study. Increasing the number of participants may help in understanding trends in a better way and determine outliers. Therefore, and for overcoming this, it was necessary to contextualize the findings of the eye-tracking statistics with the qualitative survey to make statements and interpret the eye-tracking statistics.
Interestingly, even though a high number of low-medium IT-literate participants of all study areas opted for an interface without a map, several participants of these user groups commented on the usefulness of a map, which facilitates locating POIs. These participants stated that they would need to use a simple or guided interface since they were, at the time of the survey, not able to confidently use a map interface. However, they further stated they would be motivated to learn how to use advanced functionalities. This is interesting since the lack of experience on how to use interactive maps, and the interest and motivation to learn how to use these, should be seen independently. The statement not only depicts a general curiosity and motivation of the participants, it also indicates the usefulness for implementing mechanisms to adjust the interface to the users’ learning curve and the users’ needs.
Based on our research, we see a strong variance in usability between user groups and, hence, see a divide within a multi-user audience. As Gottwald et al. (Citation2016) state, this can even be seen as social exclusion (e.g. certain citizens not being able to participate, even though they would like to). This also confirms previous research results from Eitzinger et al. (Citation2019), where some PPGIS users needed the help of trained facilitators to be able to use the application.
In this study, we want to point out the challenge of designing a PPGIS that corresponds to the needs of its user audience. An important question to raise is how to deal with a large spectrum of user types. We suggest overcoming this problem by implementing adaptive interfaces into the PPGIS design. Adaptive interfaces detect the context of the users and adapt to it. Context is seen as information that can be used to characterize the environment and situation of a user and includes relevant information about users' location, time, activities, people and objects or resources that surround the user (e.g. noise level, network connectivity) (Schilit et al., Citation1994; Dey and Abowd, Citation1999). Creating interfaces that address the users' context (e.g. preferences, IT-literacy, age) may improve the usability of the application (Reichenbacher, Citation2001; Wang et al., Citation2001; Reichenbacher, Citation2005) by reducing the cognitive load of the application design and information through tailoring to the context of the user (Wang et al., Citation2001; Gartner et al., Citation2007).
With the findings of this study, we were able to design a prototype of an adaptation gradient that may be used for the implementation of adaptive interfaces into a PPGIS (). We see the gradient on three axes: the amount of GIS features, degree of user interactivity, and guidance. The context of the user determines the degree of the gradient of each axis. Based on the study’s findings, the way to visualize geospatial information depends on the map reading and interaction experience of each user. For example, map applications simply did not play a role in the daily life of Ugandan participants. Hence, we deduce that the non-use of interactive maps in Uganda is a phenomenon of that particular study area. Therefore, the degree and the way to visualize GIS features (e.g. on a map, as text) should correspond to the map reading/interacting skills of the user (e.g. the less the map-use skills of the participant, the less a map will play a role in the interface; and vice versa).
Figure 8. Adaptation gradient.
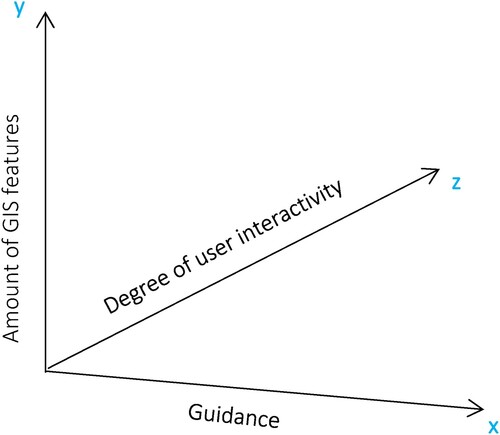
Second, the digital literacy should define the degree of interactivity with the application. For example, the less confident the participants, the more difficult it is to use the application. Last, the degree of guidance can be defined by different factors, such as the digital and map-using literacy and the individual’s motivation to learn the use of the application. The more confident and experienced the participant to use the application, the less the need for guidance; and vice versa.
Even though the factors defining this adaptation gradient may not be exclusive, this gradient lies a foundation for translating usability issues and user preferences into adaptive PPGIS interfaces. With this, it may be possible to overcome the usability problems that some participants faced in this study. This way, the application adapts the interface design to the users and provides elements that are suited to their current IT-literacy, ranging from simple to advanced elements. With this, it is possible to enhance long-term participation since the content, functionalities and interface elements can be provided in a way that is comprehensible to the users.
Methodology
We observed that participants from Uganda and Colombia were hesitant when asked for their opinion or criticism regarding the application design. Austrian participants were in majority much more critical. Hence, the results are subjective and depend on the study area and the culture of criticism. We further observed that especially low IT-literate participants felt as if they were being judged when they were interacting with the application (same phenomena as Gottwald et al. (Citation2016) describe). To mitigate these insecurities, we assured the participants that we were only assessing the application and not the participant performance. However, this might have increased their stress level and potentially biased the survey outcome. A higher stress level might have also been triggered through the test setting, the unfamiliarity with the situation and time constraints of the participants. We further detected disturbances generated by the periodic slow performance of the smartphone or internet connection and the unfamiliarity of the participants using another person’s smartphone that may have differed from their personal ones. Deduced from observations, another factor to be considered is the level of frustration and stress that may differ between participants. Participants that were easily stressed might have behaved differently than more relaxed participants. And participants that got frustrated easier may have had more difficulties in the task completion of the task scenario section than other participants or may have criticized the application more than other participants.
A major problem for most of the participants of all study areas was the last task of the task scenario, where the participants had to change the profile configurations. For carrying out the task, the participants had to tap on the account name in the menu to access the profile configurations. However, since we provided an account for the participants, it did not reflect the participant’s name. We hypothesize that the high number of critical errors was due to this problem. In other applications, the user profile is typically located in the same place and participants should be familiar with how to access it. Therefore, we assume that participants were distracted by the profile name since they did not relate to it.
In total, we included 73 participants in the study. We divided these participants into four user groups ranging from 5 to 8 participants per study area and group. The creation of the user groups was based on the self-rated IT skills of the participants and observing factors (confidence and experience of the participants). The type of user groups and the separation of the participants based on this may have biased the outcome of the study results. Other user groups could have been selected, such as user groups based on gender, educational level, or other user characteristics that were not considered at all. Also, the age groups and IT skill levels used for the user groups could have been selected in another way. For example, the age groups could have been separated in different ranges; the same applies to the IT skill level. Further, an increased sample size could have quantitively helped with revealing alternative trends or could have helped to underpin the trends detected in the results.
Combining the results of the eye-tracking statistics with the survey results, we were able to detect patterns in the eye-tracking statistics that supported the results from the survey. However, the eye-tracking device was sensitive towards eye-wear, eye-lids that may hide the pupil, and body movements (Poole and Ball, Citation2005). Through these factors, the eye-tracking data had to be re-calibrated to eliminate a generated offset. This potentially biased the results and reduced the accuracy of the data. Defining the AOIs was only possible after recording the eye-tracking data. The AOI boundaries were defined at the beginning of the recording, however, through movements of the participants throughout the recording, the AOI boundaries also moved. Through post-calibration, we corrected the boundaries. Yet, this may also have impacted the accuracy of the statistics. We further detected that some participants had a more global sight on the interface. Some participants did not look directly at the AOIs (peripheral gaze), even though they paid attention to these areas. We assume this problem was intensified by the small screen of the mobile device where most of the elements are close together. Nevertheless, we observed a high precision of the eye-tracking data. The generated statistics provided interesting details of the cognitive process of the participants. However, the results had to be contextualized with the qualitative survey since the number of participants was not high enough to make quantitative statements about patterns.
In all study areas, the participants carried out the surveys while sitting at a desk, either in a quiet environment outside or in an office. In Austria, participants were attached to the eye-tracking device. Therefore, participants were not in a position they would usually be in when using a smartphone, which may have additionally affected their stress level. This may have impacted the outcome of this study since ‘real-life conditions’ were excluded by the survey environment.
Conclusion
With this study, we were able to explore the spectrum of user types of three study areas: Colombia, Uganda and Austria. Through a task scenario, questions regarding the interface design preferences, and general remarks of the participants, we were able to identify usability problems and user preferences of the participants and contextualized these accordingly.
The study results indicated which and how user context information can be used to create an adaptation gradient on which further efforts to create adaptive interface could be based. We assume that adapting the degree of complexity of the interface design to the IT-literacy of the users helps mitigating usability problems. Adaptive interfaces would then adapt to the user’s context (Dey and Abowd, Citation1999) and would respond to it by offering adequate functionalities and elements. For future work, we are planning to prototype a PPGIS that adapts with its interface to the user’s context. A comparison of the usability of this kind of PPGIS with the results of the study at hand would give crucial insights for the usefulness of this kind of interface. Further, we want to emphasize that research in cross-culturally and globally used PPGIS is relevant to further the knowledge about regional conventions and user-type differences that impact the use of applications. Additionally, we would like to highlight that the insights of this study may not be exclusive to PPGIS research but could potentially be used for usability research in map applications in general.
The eye-tracking statistics of the Austrian participants supported the trend detected in the usability aspects of the task scenario. However useful, eye-tracking data provided several challenges in post-calibration and interpretation. For further work, it would be interesting to use an eye-tracking device that does not have to be attached to a computer while recording the application interaction of the participants (e.g. as in Kiefer et al. (Citation2014)). This way, we would be able to avoid the ‘lab environment’-setting and could create a more natural atmosphere for the participants.
Acknowledgements
This work was supported by the Federal Ministry for Economic Cooperation and Development, Germany under Grant 81206685 by the Austrian Science Fund (FWF), and the Doctoral College – GIScience, University of Salzburg, Austria under Grant W1237. We would further like to thank Martin Sudmanns and Anthony Robinson for their feedback.
Disclosure statement
No potential conflict of interest was reported by the author(s).
Additional information
Funding
Notes on contributors

Mona Bartling
Mona Bartling received a MSc in Applied Geoinformatics at the University of Salzburg, Austria and has been a PhD candidate since October 2017. Since April 2015 she is a visiting researcher at the International Center for Tropical Agriculture (CIAT) in Colombia where she is part of the developer team of the participatory tool GeoCitizen. Her PhD focuses on improving user experience of participatory tools and she has a particular interest in understanding user context for the design of map applications.
References
- Aditya, T. (2010) “Usability Issues in Applying Participatory Mapping for Neighborhood Infrastructure Planning” Transactions in GIS 14 (3) pp.119–147 DOI:https://doi.org/10.1111/j.1467-9671.2010.01206.x.
- Arnstein, S.R. (1969) “A Ladder of Citizen Participation” Journal of the American Institute of Planners 35 (4) pp.216–224 DOI:https://doi.org/10.1080/01944366908977225.
- Atzmanstorfer, K., Eitzinger, A., Marin, B.E., Parra Arteaga, A., Gonzalez Quintero, B. and Resl, R. (2016) “HCI-Evaluation of the GeoCitizen-reporting App for Citizen Participation in Spatial Planning and Community Management Among Members of Marginalized Communities in Cali, Colombia” GI_Forum 1 pp.117–132 DOI:https://doi.org/10.1553/giscience2016_01_s117.
- Atzmanstorfer, K., Resl, R., Eitzinger, A. and Izurieta, X. (2014) “The GeoCitizen-approach: Community-based Spatial planning – an Ecuadorian Case Study” Cartography and Geographic Information Science 41 (3) pp.248–259 DOI:https://doi.org/10.1080/15230406.2014.890546.
- Ballatore, A. and Bertolotto, M. (2015) “Personalizing Maps” Communications of the ACM 58 (12) pp.68–74 DOI:https://doi.org/10.1145/2756546.
- Bevan, N. (1995) “Human-Computer Interaction Standards” In Anzai, Y., Ogawa, K. and Mori, H. (Eds) Advances in Human Factors/Ergonomics: Symbiosis of Human and Artifact Elsevier, pp.885–890.
- Bugs, G. (2012) “Assessment of Online PPGIS Study Cases in Urban Planning” In Lecture Notes in Computer Science. Computational Science and Its Applications – ICCSA 2012 (Vol. 7333) Berlin, Heidelberg: Springer, pp.477–490 DOI:https://doi.org/10.1007/978-3-642-31125-3_36.
- Bugs, G., Granell, C., Fonts, O., Huerta, J. and Painho, M. (2010) “An Assessment of Public Participation GIS and Web 2.0 Technologies in Urban Planning Practice in Canela, Brazil” Cities 27 (3) pp.172–181 DOI:https://doi.org/10.1016/j.cities.2009.11.008.
- Campbell, S.W. and Kwak, N. (2011) “Mobile Communication and Civil Society: Linking Patterns and Places of Use to Engagement with Others in Public” Human Communication Research 37 (2) pp.207–222 DOI:https://doi.org/10.1111/j.1468-2958.2010.01399.x.
- Çöltekin, A., Heil, B., Garlandini, S. and Fabrikant, S.I. (2009) “Evaluating the Effectiveness of Interactive Map Interface Designs: A Case Study Integrating Usability Metrics with Eye-Movement Analysis” Cartography and Geographic Information Science 36 (1) pp.5–17 DOI:https://doi.org/10.1559/152304009787340197.
- Corbett, J.M. and Keller, C.P. (2005) “An Analytical Framework to Examine Empowerment Associated with Participatory Geographic Information Systems (PGIS)” Cartographica: The International Journal for Geographic Information and Geovisualization 40 (4) pp.91–102 DOI:https://doi.org/10.3138/J590-6354-P38V-4269.
- Dey, A.K. and Abowd, G.D. (1999) “Towards a Better Understanding of Context and Context-Awareness” HUC ‘99: Proceedings of the 1st International Symposium on Handheld and Ubiquitous Computing Berlin: Springer-Verlag, pp.304–307. Available at: https://link.springer.com/chapter/https://doi.org/10.1007/3-540-48157-5_29 (Accessed: February 2021).
- Eitzinger, A., Cock, J., Atzmanstorfer, K., Binder, C.R., Läderach, P., Bonilla-Findji, O., Bartling, M., Mwongera, C., Zurita, L. and Jarvis, A. (2019) “Geofarmer: A Monitoring and Feedback System for Agricultural Development Projects” Computers and Electronics in Agriculture 158 pp.109–121 DOI:https://doi.org/10.1016/j.compag.2019.01.049.
- Evans-Cowley, J. (2010) “Planning in the Real-Time City: The Future of Mobile Technology” Journal of Planning Literature 25 (2) pp.136–149 DOI:https://doi.org/10.1177/0885412210394100.
- Fiorino, D.J. (1990) “Citizen Participation and Environmental Risk: A Survey of Institutional Mechanisms” Science, Technology, & Human Values 15 (2) pp.226–243 DOI:https://doi.org/10.1177/016224399001500204.
- Gartner, G., Bennett, D.A. and Morita, T. (2007) “Towards Ubiquitous Cartography” Cartography and Geographic Information Science 34 (4) pp.247–257 DOI:https://doi.org/10.1559/152304007782382963.
- Gottwald, S., Laatikainen, T.E. and Kyttä, M. (2016) “Exploring the Usability of PPGIS Among Older Adults: Challenges and Opportunities” International Journal of Geographical Information Science 30 (12) pp.2321–2338 DOI:https://doi.org/10.1080/13658816.2016.1170837.
- Haklay, M. and Tobón, C. (2003) “Usability Evaluation and PPGIS: Towards a User-Centred Design Approach” International Journal of Geographical Information Science 17 (6) pp.577–592 DOI:https://doi.org/10.1080/1365881031000114107.
- International Organization for Standardization (1992) ISO 9241 Ergonomic Requirements for Office Work with Visual Display Terminals (VDTs) Geneva, Switzerland: ISO.
- Irvin, R.A. and Stansbury, J. (2004) “Citizen Participation in Decision Making: Is It Worth the Effort?” Public Administration Review 64 (1) pp.55–65 DOI:https://doi.org/10.1111/j.1540-6210.2004.00346.x.
- Jones, C.E. and Weber, P. (2012) “Towards Usability Engineering for Online Editors of Volunteered Geographic Information: A Perspective on Learnability” Transactions in GIS 16 (4) pp.523–544 DOI:https://doi.org/10.1111/j.1467-9671.2012.01319.x.
- Kiefer, P., Giannopoulos, I., Athanasios Anagnostopoulos, V., Schöning, J. and Raubal, M. (2017) “Controllability Matters: The User Experience of Adaptive Maps” Geoinformatica: An International Journal on Advances of Computer Science for Geographic Information Systems 21 pp.619–641 DOI:https://doi.org/10.1007/s10707-016-0282-x.
- Kiefer, P., Giannopoulos, I. and Raubal, M. (2014) “Where Am I? Investigating Map Matching During Self-Localization With Mobile Eye Tracking in an Urban Environment” Transactions in GIS 18 (5) pp.660–686 DOI:https://doi.org/10.1111/tgis.12067.
- King, C.S., Feltey, K.M. and Susel, B.O.N. (1998) “The Question of Participation: Toward Authentic Public Participation in Public Administration” Public Administration Review 58 (4) pp.317 DOI:https://doi.org/10.2307/977561.
- McNaughton, D. and Light, J. (2013) “The iPad and Mobile Technology Revolution: Benefits and Challenges for Individuals Who Require Augmentative and Alternative Communication” Augmentative and Alternative Communication (Baltimore, MD, 1985) 29 (2) pp.107–116 DOI:https://doi.org/10.3109/07434618.2013.784930.
- Meng, L. and Malczewski, J. (2009a) “Usability Evaluation for a Web-based Public Participatory GIS: A Case Study in Canmore, Alberta” Cybergeo: European Journal of Geography, DOI:https://doi.org/10.4000/cybergeo.22849.
- Meng, L. and Malczewski, J. (2009b) “Web-PPGIS Usability and Public Engagement: A Case Study in Canmore, Alberta, Canada” URISA Journal, 22 (1), pp.57–64. Available at: https://www.urisa.org/clientuploads/directory/Documents/Journal/ (Accessed: February 2021).
- Nayebi, F., Desharnais, J.-M. and Abran, A. (2012) “The State of The Art of Mobile Application Usability Evaluation” 2012 25th IEEE Canadian Conference on Electrical and Computer Engineering (CCECE), Montreal, Canada, 29th April-2nd May, IEEE, pp.1–4 Available at: https://ieeexplore.ieee.org/document/6334930 (Accessed: February 2021).
- Newman, G., Zimmerman, D., Crall, A., Laituri, M., Graham, J. and Stapel, L. (2010) “User-friendly Web Mapping: Lessons from a Citizen Science Website” International Journal of Geographical Information Science 24 (12) pp.1851–1869 DOI:https://doi.org/10.1080/13658816.2010.490532.
- Nielsen, J. (2001) “Usability Metrics” Available at: https://www.nngroup.com/articles/usability-metrics/* (Accessed: 21st May 2019).
- Poole, A. and Ball, L.J. (2005) “Eye Tracking in Human-Computer Interaction and Usability Research: Current Status and Future Prospects” In Ghaoui, C. (Ed.) Encyclopedia of Human-Computer Interaction Pennsylvania: Idea Group, Inc., pp.211–219.
- Poplin, A. (2015) “How User-Friendly Are Online Interactive Maps? Survey Based on Experiments with Heterogeneous Users” Cartography and Geographic Information Science 42 (4) pp.358–376 DOI:https://doi.org/10.1080/15230406.2014.991427.
- Reichenbacher, T. (2001) “Adaptive Concepts for a Mobile Cartography” Journal of Geographical Sciences 11 (S1) pp.43–53 DOI:https://doi.org/10.1007/BF02837443.
- Reichenbacher, T. (2005) “Adaptive Egocentric Maps for Mobile Users” In Meng, L. (Ed.) Map-based Mobile Services. Theories, Methods and Implementations Berlin: Springer, pp.141–158.
- Schilit, B., Adams, N. and Want, R. (1994) “Context-Aware Computing Applications” 1994 First Workshop on Mobile Computing Systems and Applications Santa Cruz, CA, 8th-9th December, Berlin: IEEE. pp.189–194. Available at: https://ieeexplore.ieee.org/document/4624429 (Accessed: February 2021).
- Sey, A. and Fellows, M. (2011) “Loose strands: searching for evidence of public access ICT impact on development” Conference '11 Seattle, Washington, USA, 8th–11th February, Grandville, MI: iSchools, pp.189–194. Available at: https://dl.acm.org/doi/https://doi.org/10.1145/1940761.1940787 (Accessed: February 2021).
- Sieber, R. (2006) “Public Participation Geographic Information Systems: A Literature Review and Framework” Annals of the Association of American Geographers 96 (3) pp.491–507 DOI:https://doi.org/10.1111/j.1467-8306.2006.00702.x.
- Stivers, C. (2016) “The Public Agency as Polis” Administration & Society 22 (1) pp.86–105 DOI:https://doi.org/10.1177/009539979002200105.
- Wang, Y., Liu, Y., Chen, X. and Chen, Y. (2001) “Adaptive Geovisualization: An Approach Towards the Design of Intelligent Geovisualization Systems” Journal of Geographical Sciences 11 (5s) p.1 DOI:https://doi.org/10.1007/BF02837439.
- Warner, S.L. (1965) “Randomized Response: A Survey Technique for Eliminating Evasive Answer Bias” Journal of the American Statistical Association 60 (309) pp.63–69 DOI:https://doi.org/10.1080/01621459.1965.10480775.
- World Bank (2016) “World Development Report 2016: Digital Dividends” Main Messages 53 (9) DOI:https://doi.org/10.1596/978-1-4648-0671-1.
Appendices
Appendix 1: Duration of task completion (efficiency)
Appendix 2: Task evaluation (satisfaction)