
Introduction
Maxwell J. Roberts
The year 2023 marks the 90th anniversary of the publication of the first edition of Henry Beck's famous diagram of the London Underground. Ever since 1933, the network has been depicted using its exact same design rules – horizontal, vertical and 45° diagonals – with just one 60° deviation, published in 1940. The network, design priorities, layout, symbology and supplementary information have changed with time, but the basic foundation of permissible angles has remained in place. Worldwide, the majority of schematic maps now conform to Beck's approach.
What exactly was Beck's achievement? He did not invent schematization: the key elements of this had previously been adopted elsewhere, such as for the Berlin S-Bahn network map of 1931. Whether or not Beck was aware of these predecessors, the sources of his inspiration and ideas are nonetheless open to debate. What is noteworthy, then, is not so much what Beck created, but just how much skill exudes from his creation. He produced an image that is timeless, yet of its time (Roberts, Citation2019a) and which magnificently captured the essentials of usability; achieving simplicity, coherence, harmony and balance, all without excessive distortion of London's topography (Roberts et al., Citation2016; Citation2017). Hence, users were presented with a new image of the network with simple straight lines highlighting its structure and connectivity, thus reducing the cognitive load of journey planning. Simultaneously, the image was unlikely to conflict significantly with their mental models of the city, removing a potential barrier to acceptance (). Judging by the sheer number of London Underground schematizations, amateur or otherwise, that are dubious in terms of usability, ineffective schematizations seem to be very easy to create (Roberts, Citation2019b).
Figure 1. Digital reconstructions of Beck's first design and also the previous official version (by F.H. Stingemore) which attempted a more topographically accurate depiction. The Beck diagram has been sized so that the two central areas are similar and it has been rotated and overlaid on top of the earlier map. Beck's distortion of central London is relatively small compared with the suburbs (already compressed, albeit to a lesser extent, by Stingemore). Other than distances, people familiar with central, north and south London would likely not experience too much conflict with their own mental models. The greatest topographical distortions on Beck's diagram are to be found in west London.
Ninety years on from the publication of Beck's creation, research into schematization has become a multidisciplinary pastime, capturing the attention of information designers, cartographers, usability testers, psychologists and computer scientists to name but a few. A recent state-of-the-art review article cited over 130 research publications (Wu et al., Citation2020). The idea for this Special Issue arose from a conversation with the Editor of The Cartographic Journal, whose recent review of the cartographic significance of Beck's design (Kent, Citation2021) led to the suggestion that a fuller appraisal would be timely for its 90th anniversary. The result is a representative cross-section of original research, ranging from the history of schematization through to using computer techniques to automate design. For this editorial, we asked a panel of five researchers and practitioners, all well-acquainted with Beck's work, to talk about its significance and relevance today.
Beck’s Design as Cartography
David Forrest
As a life-long enthusiast for railways and maps, unsurprisingly, like many others, I am a long-term fan of Beck's original representation of the London Underground. In my Presidential address to the British Cartographic Society in 2002, I included it as one of three maps I thought were widely influential as well as being of personal interest. It felt natural to include Beck's design in a later article for The Cartographic Journal, which highlighted ten maps that had a significant impact in the twentieth century (Forrest, Citation2003). The maps in that review were selected based on a mixture of what they depicted (their significance geographically or scientifically) or how they were designed or produced (their significance cartographically), with the Beck map fitting into the latter group.
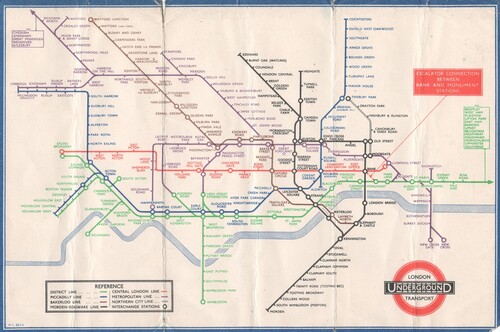
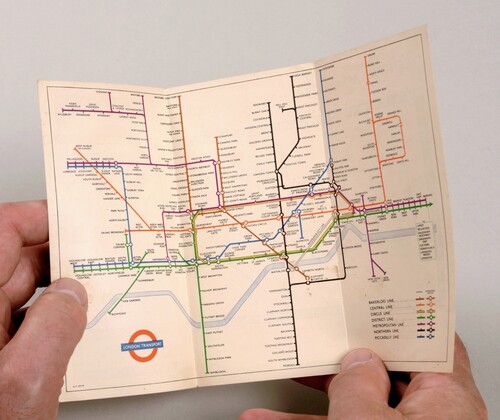
I have a large collection of the pocket folder versions, mostly picked up on business trips to London over the last 40 years, but I also have a few older examples such as the ‘Card Folder version 2’ of 1934 (), which, I suspect, was originally owned by my wife's grandfather. It shows the wear and tear of use, rather than something acquired as a collector's item. The prices now paid for early versions that were freely given away and intended to be ephemeral certainly show that map collectors have a high regard for it. How prices develop over time for more recent incarnations will be interesting to see.
Figure 2. London Transport ‘RAILWAY MAP’. Card folder version No. 2, 1934 (approximately 80% full size).
Is It a Map?
From a cartographic perspective, perhaps the first question to be addressed about Beck's design is ‘is it a map?’. If one adopts a more traditional definition, then one aspect that is normally included in this discussion is that a map is drawn to scale (Andrews, Citation1996). For example, from my lecture notes on cartography in the 1970s, the definition of a map is ‘An orthogonally projected, scaled and symbolized representation of reality’. While Beck's product is clearly symbolic and conforms to the final part of this definition, it is not to scale, and to a significant extent, its not being to scale was what made the approach unusual at the time, but is also what made it effective for its primary purpose.
Thus, we might conclude it is not a map. Certainly, I don't think the late John Keates, well-known for his writing on maps and cartography, and founding editor of this journal, would have considered it to be a map. It would more likely fall into the category of a ‘map like object’, a term coined by some cartographic authors in the 1970s and 1980s to refer (in a somewhat derogatory manner) to the objects used in ‘map’ use and perception studies by geographers and psychologists who seemed to have had little grasp on the realities of professional mapmaking.
More recent definitions of ‘map’ are much more generous in their interpretation. The International Cartographic Association (ICA) updated their definition to: ‘A map is a symbolized representation of geographical reality, representing selected features or characteristics, resulting from the creative effort of its author's execution of choices, and is designed for use when spatial relationships are of primary relevance’ (International Cartographic Association, Citation2003). In 2006, the Open Geospatial Consortium defined a map as ‘A pictorial representation of geographic data’; their current definition is ‘A two-dimensional visual portrayal of geospatial data’ (OGC, Citation2024). None of these later definitions pose any limitation on the viewpoint, or the variability of scale within the map; thus Beck's schematic representation falls clearly within these definitions.
London Transport have grappled with how to define their ‘map’ over time. The first card folder edition of 1933 was entitled ‘A Map of London's Underground Railways’. In 1934 the title was reduced simply to ‘Railway Map’. A later example of the pocket version in my possession — a rather spiky 1962 design by Hutchinson — calls itself a ‘Diagram of Lines’. In the early 1990s it was described as a ‘Journey Planner’; the term ‘Tube Map’ being used from 1995 to the present. Through the years it has had different official descriptions and, perhaps, cartographers avoided using the term ‘map’ when discussing it, but there is no doubt that to most users it is simply the ‘Underground Map’ or ‘Tube Map’.
In a study carried out by this writer in the late 1990s, 300 first-year students in the first week of their degree were asked to look at a series of images for a few seconds and to simply state if they thought it was a map or not (Forrest, Citation1999). One of the images included was of the contemporary London Underground ‘map’. Over 90% of students thought it was a map. There were some unexpected outcomes in this survey, with some images most cartographers would consider to be a map getting relatively low scores and some that were clearly not, such as an oblique aerial photograph, scoring highly, but the outcome for the Underground ‘map’ was not surprising.
In a similar vein, a study by Cartwright (Citation2015), focusing specifically on Beck's method of representation, solicited opinions from experts in cartography and in graphic design. Approximately 2/3 of them preferred to call the design a map, with ‘diagram’ and ‘map and diagram’ each favoured by about 10% of respondents. Seven other options were suggested by single respondents, but four of these used the word ‘map’ along with a qualifying term.
Given both the more contemporary definitions of a map and the popular adoption of the term to describe the pictorial representation of the underground network, it is reasonable to adopt the term ‘map’ for what Beck produced and subsequent versions.
Schematic Mapping
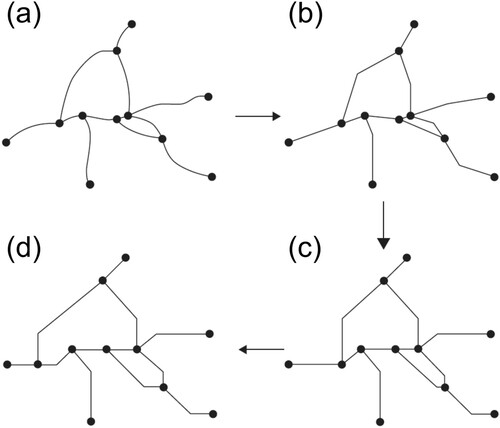
By dispensing with geographic accuracy, Beck aimed to produce a diagram that was more useful to the travelling public than the existing less successful maps of the increasingly complex and growing Underground network. The shift from a geographical representation to a schematic representation can be considered to involve several processes (Anand et al., Citation2006). First, lines are simplified and made of a limited number of straight segments (b). Typically, the orientation of lines is then constrained to a fixed number of directions (c), with one of the most popular being to create an ‘octolinear’ arrangement of lines – using horizontal and vertical lines plus the two 45° angles. Many other arrangements are possible with fewer or more angles or even a curvilinear approach, but these are less common. A final stage that may be applied is to adjust the spacing of lines to reduce congestion in busier areas. For a schematic of something like a metro system, a further refinement is often to space the stations as equally as possible along the lines (d).
Figure 3. Graphic manipulations for producing a schematic. Lines are simplified (b) and re-oriented to conform to a constrained set of angles. Congested areas are expanded at the expense of less dense areas and nodes (stations) are spaced more evenly (d). After Anand et al. (Citation2006).
It is impossible to state if Beck followed this process specifically, or if he started with a different one and came up with his draft design through another route (he explained some of his rationale to Garland, Citation1994), but certainly it is a logical way of moving from geographic reality to the schematic representation he developed. A major consequence of the process is that although topological relationships are retained, scale and geographical reality are distorted. Working in the Signal Engineers office, Beck must have been familiar with signalling diagrams, which distort scale and orientation – typically to a much greater extent than his map.
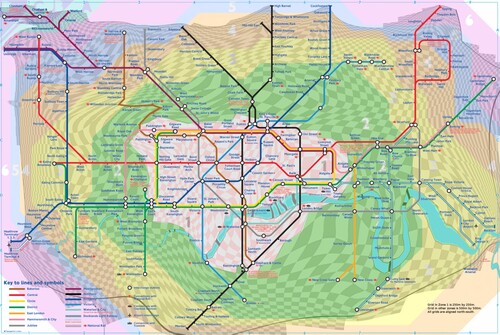
The distortions of scale and geography can more clearly be seen by the effect when a regular grid from geographical reality is plotted on the schematized map (). Whereas the general approach adopted by Beck and later versions is to enlarge the central area, where there is more detail, and to reduce the scale in the outer areas, this is not done in a consistent manner and leads to what can be quite marked local variations in scale, as can be seen in the distorted shape and varying size of the grid cells.
Figure 4. London Underground ‘map’ with distortion grid (Transport for London, 2006).
Usability
While there can be no doubt that Beck's original design struck a chord with contemporary users, largely due to its overall simplicity and elegance, the same cannot be said for some of the later incarnations of the London map. Even some of Beck's experiments were less successful graphically. The major issue with more recent versions, while adhering to many of the principles successfully developed by Beck, is that the network has grown significantly over the years. Beck's original had to contend with only seven different lines. The current map has to cope with significantly more: 12 lines forming the current Underground network; the Docklands lines, two cross-London rail routes, various other mainline rail routes; a tram network; and an aerial cableway. All this goes to create a very cluttered map making it much harder for the user to determine the most appropriate route for many journeys, particularly without additional information such as service frequency. Other additions, such as disabled access, while of importance, do not help this information overload.
The area covered by the map has also grown significantly, putting even more pressure on the space available and increasing the geographical distortion. Beck's original quite cleverly just listed the stations on the extremities of some lines – the Metropolitan line to the north-west and the District line to the east – allowing more space for the core of the network (see ). To include an expanded network, some of whose components are now quite substantial in outer areas, puts greater stress on the available space and limits how much the central area can be expanded to enhance its clarity.
While I would argue strongly in favour of a ‘whole network’ map being available, and even for one that integrated additional modes of transport, it cannot be argued that the current London map represents an integrated transport map as it excludes busses, which are a significant part of the London's public transportation network. While creating a map covering multiple modes may work in a large format, such as could be displayed in stations on large boards, or on a large map that can be folded into a convenient size, it really does represent overload, and creates a confusing image in the smaller format of the pocket folder map. Thus, more thought needs to be given to the purpose of various maps representing public transport information, and it is not a ‘one design fits all’ situation.
In the modern era, for planning a specific journey, users are now likely to use a route-planning application on their mobile phones. This can not only take into consideration the topology of the network, but also the frequency of service on various routes, travel times, predicted interchange times, and even live timetable information, all things that are not depicted on the paper map (versions of the map of been created which try to show travel times, but that adds further complications). What a whole-network map can provide is an overview of the range of services available and locations that can be easily reached. It is very hard to achieve this on the small screen of a mobile device, so there remains a role for the more traditional physical map of larger areas.
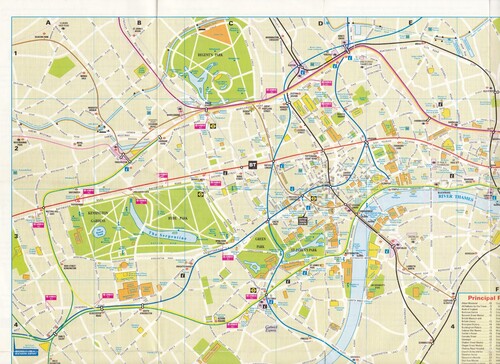
Although various editions of the map over the years have had great value in general travel planning when using the Underground, without doubt, they have created a distorted mental map of London for many users. Indeed, for many, the Underground map is the map of London. For many tourists, and those unfamiliar with London, who are primarily concerned with the central core business and tourist areas, does the schematic representation really help? Personally, while on business trips to London, I tended to make more use of a more geographically correct version such as that in . This often allows more appropriate route choice in the central area, especially if one is willing to walk a short distance rather than change lines. The classic case is someone going from Queensway to Bayswater, which requires the use of the Central and Circle/District lines but, in reality, the station entrances are only a few metres apart. In my own case, arriving at Victoria and going to a meeting near Waterloo, rather than getting the Circle or District line to Embankment (at least these two lines share a platform at Victoria) and then changing to the Northern or Bakerloo line (but which is the best option?) to Waterloo, it was simpler and probably quicker to take the Circle or District to Westminster then walk across Westminster Bridge. In more recent times there is a link from Westminster to Waterloo by the Jubilee line, but the amount of walking necessary underground probably still makes walking across the bridge the better option, unless it is raining heavily!
Figure 5. Geographically correct map of central London showing underground lines. (How to call home from the UK … and your free tourist guide to London. British Telecommunications PLC (1992).
Beck's Cartographic Influence
Beck's initial proposal to the management was unsuccessful (see Garland, Citation1994). His belief, indeed passion, for his attempt eventually led to a trial printing that the travelling public greeted enthusiastically, and have done ever since. So influential is the ‘map’ that the mental image of London of many visitors is that of the Underground map, not of the real distances and relationships between places.
While there are well-known discussions about the originality of Beck's idea (e.g. Dow, Citation2005) and there is also no doubt that schematic diagrams were used for railway lines, even if not extensively, before Beck's map, his contribution was to apply the method to the seemingly disorganized London Underground network of the time and, by his use of schematization and colour, produce something that appeared more organized. Schematic maps in various forms had been used for a long time before Beck. The classic example cited of an early schematic is Minard's map of Napoleon's ill-fated Russian campaign, which pre-dates Beck by 60 years, but there is evidence of non-literate communities using schematic-like drawings to represent places and travel for hundreds of years. Although other urban transport systems appear to have independently developed similar products around the same time, Beck's is the one that is given the most prominence.
Apart from the sheer number of various versions of the map that have been displayed and distributed freely over the last 60 years, its prominence in TV programmes, such as the BBC Design Classics series, has promoted Beck's map and its successors’ position as a design icon. However, it would be hard to find an example of it in a cartographic textbook. Unfortunately, very few cartographic textbooks give any serious space to public transport maps, despite them being one of the most widely used types of maps by the general public. Some books may include a chapter or section on flow maps or on various styles of ‘carto-diagram’, but discussion on creating schematic maps and the representation of routes, stations and interchanges is extremely rare.
In contrast to their widespread availability and use, public transport maps have very rarely been featured in the biennial International Map Exhibition of the ICA, which purports to reflect the best in cartography globally. Equally, papers on public transport mapping in general, or on schematic mapping for public transport or other topics, are rare at ICA conferences. Most academic research papers on schematic maps for public transport are written by those from other domains, who would be unlikely to call themselves cartographers.
Despite this lack of formal influence of Beck, and the kind of map he created, on cartographic teaching and research, there is no doubt that the London Underground map has been a major influence on those creating public transport maps, be they cartographers or graphic designers. Virtually all metro and other rail-based networks use this general style of representation, even if some of the detailed implementation differs.
The genre has also spawned a significant number of artistic attempts to show other things by way of the Underground map, such as film franchises, football teams, ski routes or even medical conditions. Some of these adopt the London Underground map as their basis and try to give appropriate names to lines and stations, others create their own topological network, but based on the Underground map concept. I find most of these rather contrived and unsuccessful and cannot be considered ‘cartography’, although some can be amusing. A fuller discussion of many of these from a cartographic point of view can be found in Field and Cartwright (Citation2014).
The success and longevity of Beck's design has, without doubt, led to attempts to achieve similar results for other public transport networks. While this is often successful for rail-based systems, where there are a limited number of lines and stations are clearly identifiable, its adoption for bus transport systems is generally less successful. The problem with the mapping of many bus networks is that they are much more complex than metro systems, there are many more access points (bus stops), and these access points are much less significant landmarks than metro or railway stations. With today's mobile navigation systems or in-bus information systems, users have a better idea of when they are approaching their required stop, but until recently there had to be a reliance on local knowledge, or tracking location on a map, to know when to get off the bus because stops can be quite anonymous and unseen until the last moment. Thus, the schematic map is a much less useful tool for bus passengers, and their increasingly widespread adoption (where any form of mapping exists) has to be questioned.
Conclusion
There can be no doubt that Beck's concept has had a significant impact on the design of metro maps around the world. Attempts to adopt this for other forms of public transport are perhaps somewhat misguided and don't provide the information users need in the different contexts, but his focus on making something manageable and usable is something all map designers can learn from.
In terms of the current Tube map, mapping the ‘London Underground’ as heads the current edition has somewhat lost its way. Although it retains many of Beck's concepts, by including much beyond the underground network, his main aim of simplifying and clarifying information appears to have been forgotten.
The Tube Map as Information Design
Robert Waller
The London Tube mapFootnote1 is known to anyone who has been to London, and many who have not. Although radical in its day, it was an instant success. It is central to the history of information design, and everyone who practises, teaches or researches this topic sees it as an iconic example of the art.
After the Information Design Journal (IDJ) was launched in 1979Footnote2 as a forum for information design to be theorized, papers in each of the first four issues (and I suspect many since) cited the Tube map, but each for a slightly different purpose. I thought it instructive to use them to demonstrate the map's place within this field.
A Case Study in Design History
It is not surprising to see the Tube map mentioned in issue 1 by Ken Garland, in his ground-clearing discussion of diagrams (Garland, Citation1979). In this context, he mentions it in a discussion of colour-coding – pointing out that the monochrome version is ‘a convincing demonstration of the proposition that colour-coding is, at best, never more than an aid to comprehension, and not a sine qua non’ (p.21).
As Henry Beck's biographer, advocate and friend, Ken was instrumental in bringing him to the attention of the world at large through his 1969 Penrose Annual article (Garland, Citation1969) which in turn led to his book Mr Beck's Underground Map: A History (Garland, Citation1994). There we learn about the inspiration from wiring diagrams, the process of experimentation, the reluctance of the client to publish, the immediate acclaim from the travelling public when they did publish, the designer's struggle to retain control, and various trials and mistakes along the way.
An Information Design Icon
In issue 2, Bruce Brown (Brown, Citation1979) uses the Tube map to represent information design as a category in his wider model of communication, treating it as an icon or symbol that stands for all information design. This works for me. If someone asks, ‘What is information design?’, just mention the Tube map. It is both visual and verbal, it imposes an interpretative system on reality, it is simplified, it is a tool for problem-solving and decision support, it offers multiple readings, and it responds to changing needs over time. In 2006, it came second (behind Concorde) in a public pollFootnote3 to establish the best-loved example of British design, and it appeared in a Royal Mail series of postage stamps celebrating British design, alongside the Mini and the red telephone phone box. So, it is an icon in both senses of the word – an image that stands for a concept, and also an image that is venerated.
An Information Design Exemplar
In issue 3, Susan Marcus (Marcus, Citation1979) uses the Tube map to illustrate a list of visual qualities to be found in a successful diagram: a minimal number of visual elements; colour-coding; a language of symbols; and a typographic hierarchy. This makes the Tube map invaluable for teachers of information design, who can use it to introduce all those topics and others still: legibility; design detailing; usability; gestalt principles; design history; and design methods.
An Evolutionary Step
In issue 4, the Tube map was cited by Clive Richards and Ronald Johnson (Richards and Johnson, Citation1980) in their paper on flow chart design.Footnote4 Specifically, they borrowed the small ticks that protrude from a Tube line to show stations and used them to show stages in a process within a network diagram. So, Henry Beck's diagram, itself inspired by electrical circuit diagrams, added to the evolution of our general vocabulary of diagramming. And, of course, it has influenced transport maps around the world – some more successfully than others.
A Focus for Debating Information Design Ethics
The Tube map perfectly illustrates the fact that information design invariably involves compromise, and that simplification invariably involves a degree of distortion, bias and omission. And that the motives of information design clients might be to influence the habits, choices and decisions of users. So teachers of information design can move on from Susan Marcus's basic points to debate whether it is a map or a diagram; how it privileges network connections over geographical truth; that it has a point of view about what is important or relevant; that long journey times to suburbs are compressed by the need to fit the page format; that it defines perceptions of London geography, and so on.
A Brand and Cultural Meme
The Tube map has become part of London's branding, and it became a cultural meme long before we started to use that term for ideas repeated across the Internet. We find it on t-shirts, mugs, and every kind of London souvenir.Footnote5 Artists and advertisers borrow from it and adapt it in humorous or thought-provoking ways – for example, David Booth's poster for the Tate GalleryFootnote6 in which the map is squeezed from tubes of paint. Tubes, of course, not jars.
A Stress Test
In semiotics, the nature of meaning can be explored by transforming one aspect of a message and seeing the effect. Known as a commutation test, the transformation might be a re-ordering, an addition, an omission or a substitution. It is an effective way to distinguish between essential, inessential and accidental features in a design (Chandler, Citation2022). An example of an inessential feature might be the decorative border that surrounded the Tube map in some older editions – remove it and no meaning is lost. An accidental feature might be the centre page fold that is visible but not part of the diagram.
Every time Transport for London (TfL) alters the Tube map, it amounts to a stress test of the format – when a new route is added, or when new ideas are introduced, such as fare zones.
Aware of its ever-growing complexity, in 2009 TfL removed the River Thames from the map, having assumed that it was inessential. There was an immediate public backlash (see, for example, Barkham, Citation2009), and the Mayor of London intervened to have the river restored. Although TfL had thought it was unnecessary clutter, it turned out to have a purpose in the eyes of its users. As one Guardian reader commented: ‘The river is the equivalent of a “You Are Here” starting point for the zillions of people needing it to get their bearings while they learn London’.
A Constraint on Our Imagination
The ultimate commutation test is Maxwell Roberts’s (Citation2012) remarkable collection of creative re-imaginings, for example, applying different geometric schema (circular, hexagonal, curvy, and more). In a sense these re-imaginings are a reaction to the iconic status of the Tube map. It is so well known, and so embedded in our visual culture that it is hard to imagine a different way to solve the problem of diagramming a transport network. Yet, as Max shows, the Beck system is not a universal solution – it fails in the case of Paris, which it seems to complicate, and it is unnecessarily constrained for a much simpler network. So, what is iconic about the Tube map is not so much its specific visual appearance as its near-perfect exemplification of a design process. Edward Tufte (n.d.), who also admires the Tube map, puts it well on his website bulletin board:Footnote7
The Underground Map and Minard's famous Carte Figurative of the French Army's disaster in Russia in the war of 1812 are alike in important respects: both are brilliant, and neither travels well. The Underground Map and Napoleon's March are perfectly attuned to their particular data, so focused on their data sets. They do not serve, then, as good practical generic architectures for design; indeed, revisions and knock-offs have usually been corruptions or parodies of the originals. Both, however, exemplify the deep principles of information design in operation, as well as the craft and passion behind great information displays. (emphasis added)
The ‘Diagram of Lines’: A Celebratory Reminiscence
Clive Richards
I first encountered the Tube map in 1953 as a child on a family visit from our provincial home to the great metropolis of London. My introduction to the usefulness of this iconic piece of graphic information design happened during the summer of that year. The initial experience of the subterranean world of the famous underground railway was thrilling. My father outlined for me how the system operated from a passenger's perspective using the Tube map, pointing out the meaning of the different symbols for stations and the significance of the coloured lines. The Tube map played a key role in planning excursions from our hotel to London's wonderful museums, to restaurants and to various locations where we viewed the street decorations celebrating Queen Elizabeth the Second's coronation. At that time, what is currently referred to as the ‘Tube Map’, was titled ‘Diagram of Lines’. I still have and treasure that particular folded card ‘Diagram of Lines’ used during my memorable week-long adventure and initiation into Tube travelling – see .
Figure 6. The folded card ‘Diagram of Lines’ of 1953. (Private collection. Photograph by Andrew Patterson.)
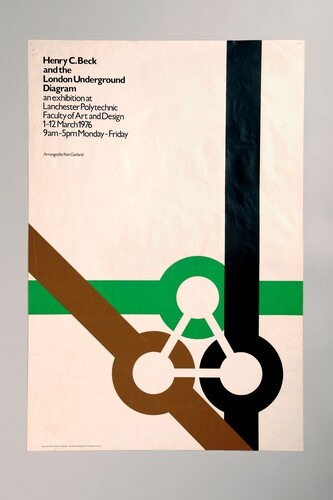
When teaching at Lanchester Polytechnic (later Coventry University), I was fortunate to work with the graphic designer, Ken Garland. I facilitated some of his exhibitions, which included several about the ‘London Underground Diagram’ – see . These exhibitions, together with Garland's writings, raised out of obscurity the name Henry C. Beck, the designer of the original 1933 ‘Diagram of Lines’. It turns out that (like my father) Beck was an engineering draughtsman (Garland, Citation1994: 5). When discussing Beck's subsequent series of refinements to his ‘Diagram of Lines’, Garland suggests that ‘[…] electrical circuit diagrams […] must, surely, have been a major inspiration for his concept […]’ (p.26).
Figure 7. Poster for an exhibition organized by Ken Garland promoting Henry Beck's designs for the London Underground Diagram. (Private collection. Photograph by Andrew Patterson. Published by courtesy of the late Ken Garland.)
Of the several versions of the Tube map that Beck designed, I think the 1953 one is amongst the best, in terms of its clarity and calm elegance – but that view may be somewhat swayed by nostalgia arising from my childhood encounter with that particular variant. To the young me this visual device was fascinating, even magical. Beck's innovative method of representing the Underground railway network was to become influential in my work as an information designer, as it has been for many others. The key features of the Beck layout principles, including simplicity, schematization and consistent angular trajectories of lines, as used in electrical circuit diagrams, have been adopted in the design of metro and other transport system maps across the world, with, it has to be said, varying degrees of success (Weber, Citation1980).
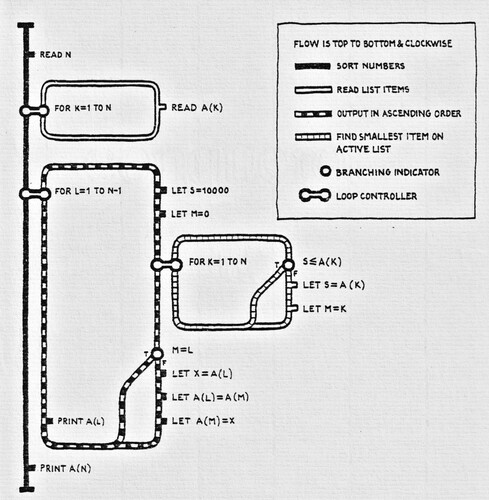
As well as representing transport routeways, the Tube map style has also been applied to other types of network system. While I was a research student at the Royal College of Art, my tutor, Ken Garland, wrote a paper on ‘[…] characteristics present in diagrams […]’ for the then newly launched Information Design Journal and included in it the ‘London Underground Diagram’ as one of the figures (Garland, Citation1979: 21). In that paper Garland observed that ‘There exist a number of accepted conventions for the design of diagrams which are complementary and form a recognizable language’ (p.22). For one of my student seminar papers, I borrowed Beck's ‘recognizable language’ to make a diagram of a computer program – see (Richards, Citation1980). My Beck-inspired design aimed to clarify the sequencing of the processes represented. The overall flow of the program would have been less evident had I followed the conventional flowchart approach which entails interconnected rectangular and diamond-shaped boxes containing program instructions. The argument is that rather than enclosing instructions within boxes, attaching the instructions to ‘stations’, à la Beck, makes clearer the general structure of the computer program (Richards and Johnson, Citation1980).
Figure 8. The Tube map graphic language is used to diagram a computer program. (Drawn by Clive Richards in 1980 for a Royal College of Art research student seminar paper).
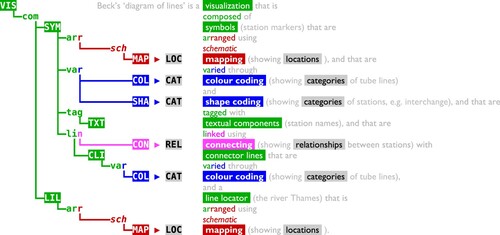
Recently I have been working with my colleague, Yuri Engelhardt of the University of Twente, on the development of an analytical framework that defines the fundamental visualization techniques and other building blocks of visualization – the ‘DNA of visualization’, to use a biological metaphor, or ‘VisDNA’ for short. Following the biological theme, different types of visualizations can be referred to as visualization ‘species’. The VisDNA framework can be used to analyse any existing species of visualization, as well as to generate new species (Richards and Engelhardt, Citation2019). A recent overview diagram we have devised, setting out the principal constituents of the framework, is clearly influenced by Beck's diagramming language – see . The VisDNA method of analysis uses ‘specification trees’ that identify the building blocks of particular visualization species. The species of visualization called a Tube map, or ‘Diagram of Lines’, as shown in , is analysed in terms of its VisDNA in . It may be thought that this specification tree also has a nod in the direction of Beck's layout principles used for his journey planning diagram.
Figure 9. The VisDNA overview diagram is influenced by the diagramming language of Henry Beck used for the London Underground Diagram. (Prepared by Clive Richards and Yuri Engelhardt.)
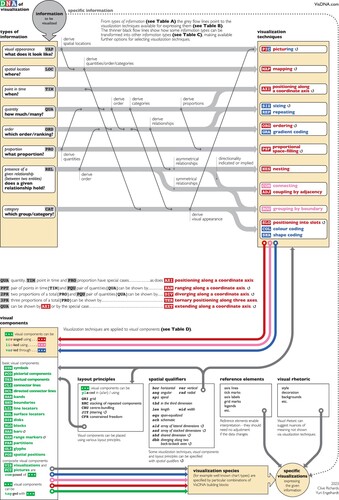
Figure 10. An analysis of the visualization ‘species’ called a Tube map, or ‘Diagram of Lines’, in the form of a VisDNA specification tree with the corresponding explanation in a natural language sentence. (Prepared by Yuri Engelhardt and Clive Richards.)
The Tube map is much more than a journey planner. Soon after its introduction it became an emblematic motif for London. The almost universal familiarity with this and its consequent cultural significance are evidenced by it being the subject of endless pastiches. For example, in the 1992 artwork by Simon Patterson, ‘The Great Bear’, the Tube station names are substituted for the names of scientists, saints, philosophers, footballers, and so on. An Underground map has even been created in LEGO: a version of the 2013 Tube map was made by Lego-builder, Duncan Titmarsh, as part of the celebrations for London Underground's 150th anniversary.Footnote8
Beck's involvement in the design and development of the Tube map ended at the beginning of the 1960s (Garland, Citation1994: 50). Since then, a number of hands have revised and extended the design to accommodate the various expansions of the network, together with the introduction of ticketing zones. Arguably the layouts used in some of these revisions lack the clarity and elegance of the earlier designs by Beck. Nevertheless, since its introduction ninety years ago, the Tube map, or ‘Diagram of Lines’, continues to be much celebrated. The impact on information design practice and the wider cultural influence of Beck's work continues.
The Client is Always Right?
Doug Rose
When I drew my first Underground diagram at the age of ten, little did I know I would become responsible for the real one for several years, some twenty-four years later.
My time working on London Transport's Underground map widened my understanding of the vast complexities of designing geometric network diagrams well, and I honestly have no idea how many I have created for use all over the UK. Beck's short skirmish with 60° angles, instead of his traditional (and now unthinkingly copied) 45°, led me to examine alternatives.
These insights were further enhanced when collaborating with Maxwell Roberts of Essex University in 2007, where we were certain that the TfL Underground map was working poorly, but wanted robust evidence to prove it. We got it. This led to a further collaboration on a project for Dockland Light Railway (Roberts and Rose, Citation2016). Again, irrefutable evidence from usability studies proved our approach to these diagrams was correct, though it did not deter the client from wanting to change it. It is a sad reflection of many professional disciplines that clients routinely think they know better. The architectural trade suffers from this blight as well, and no doubt there are many others. Psychologists Dunning and Kruger identified this phenomenon and have studied it extensively, though, in my sphere of activity, it seems no-one knows about it and would probably dismiss their findings as ‘not applying to me’ anyway.
Another human condition is to copy what has come before because the learned wisdom says that it is good. Good it might well be, but perpetuating the concept without understanding the context leads to failing designs. Yesterday's solution to today's problem? This applies to the design of anything, not just network diagrams. Often the concept is good but ruined by the poor execution of it in different circumstances. I have no idea what was in Henry Beck's mind when he chose to break with the tradition that all maps of the Underground were geographically based, albeit many of them very loosely. Ninety years on only a handful of people question the efficacy of Beck's approach. Actually, very few question his approach, but more and more are questioning its relevance for today's very much bigger network. The real danger to the travelling public now though, is that it has become a bit of a sacred cow – as even has his name.
In the context of the time, in the workplace, colleagues and staff were routinely referred to by their surnames only. In the office, he would simply have been ‘Beck’. The rather fine book Mr. Beck's Underground Map (Garland, Citation1994) sadly introduced the ‘Harry’ myth, when in truth his name was Henry. Nicknames such as this would only have been used by close friends, though the media have latched onto it and it has spread to the point where even TfL, and its Museum, use it. Sometime in the early 2000s a client of mine at Transport for London (TfL) said they wanted to add a credit to Beck's work to the map and could I suggest a brief form of words. The statement I put forward was ‘This diagram is an evolution of the original design conceived in 1931 by Henry Beck’ — it was used, though Henry got changed to Harry. I regard this false familiarity as disrespectful, but it is now widely copied. Familiarity has to be earned.
It is undeniable that Henry Beck's work changed the course of London Underground's maps, mostly for the better, though until Ken Garland's book came out, Beck was largely unknown. The book sought to redress that, and did so very successfully. I recall a meeting with Ken Garland and his to-be-publisher at the time and expressed my pleasure that this book was going to happen.
On the debit side, Beck's elevation from obscurity to god-like status set things off like a runaway train with the handbrake not working, and much mythology and a huge amount of lack of understanding of his legacy has ensued. I have no idea how many times in my professional career I have been asked to produce a ‘Tube-style map, please’, when in the great majority of circumstances this concept was inappropriate for their network and a different option would work better. A serious consequence of this, exacerbated in the hands of designers and enthusiasts, is that we now have a plethora of bad network diagrams.
Maps are communication tools, and bad ones communicate less well than good ones, with the owners of these maps suffering poorer uptake, though this is inestimable and a hard argument to fight. Also inestimable are the millions of poorly planned journeys and wrong trains taken. Another argument frequently stated by clients is ‘We haven't had any complaints’ (Rose, Citation2020). Is lack of complaint a measure of success? How many people complain (about anything) anyway? The vast majority can't be bothered, or know they will get fobbed off with platitudes or, of greater concern, are blissfully unaware there was a problem.
It should also be stated that Henry Beck did not invent transport network diagrams, or indeed any of the other features on it. Straight-line diagrams of individual lines had been around for many years in carriages. Of significance too is that George Dow had designed a network diagram for the London and North Eastern Railway (and others), which first appeared in 1929. This diagram was in the carriages of the trains that served East Finchley. It cannot be a coincidence that Henry Beck lived in this area at the time. It is hard to imagine that at no time did he see George Dow's work (Dow, Citation2005).
AI Generation of Schematic Transport Designs
Peter Rodgers
Beck's pioneering design was first published in 1933 when the Underground network was considerably smaller than it is now. Today, the network is more complex, with more than 250 additional stations. In addition, the success of his map has led to the development of conceptually similar schematics across metro, rail, road and bus networks. Perhaps this ever-increasing demand for a greater number of more complex maps means that it is time to look at computer-generated schematic transport designs.
This contribution reflects on computerized automatic layout methods that have been developed, and looks to the future of deep learning generative Artificial Intelligence (AI) models that have not yet been applied to schematic layout. I conclude that these methods may have their place in schematic cartographic design, but the human public transport map designer will still be needed in the near future.
Drawing public transport schematics has captured the attention of computer scientists over the last 20 years. The appeal of well-defined rules for the layout of such maps has led to the development of various techniques for what has been called automated metro map layout. Design criteria, such as octilinear orientation, regular station spacing, line straightness, label placement and minimizing topographic distortion, first led to force-directed methods that aimed to meet these goals indirectly, and then on to more widely used optimisation methods that directly measure these criteria to improve them in the final map (Nöllenburg, Citation2014). Whilst the methods (and to some extent their goals) vary widely, they share two positive attributes. Firstly, they can be tuned, so that the designer can emphasize different characteristics. For example, if line straightness is more important than minimizing topological distortion, this can be reflected in the layout tool. Secondly, from an AI perspective, these methods are transparent because the reasons for particular design decisions in output schematics can be seen in the algorithm.
An important negative aspect of current automatic metro map layout techniques is the relative simplicity of their design criteria. Whilst it is true that schematic maps do need to emphasize the features in the previous paragraph, there are many other design goals that they do not cover. These include well-known concepts such as balance, consistency, and legibility, alongside numerous other unnamed considerations, both global and local, that map designers may be factoring into their decision-making at any given time. Importantly, criteria may change throughout a map; for example, different criteria are important at the periphery compared to the centre, or at the top compared to the bottom. This is even without considering acceptable rule-breaking, such as the angle between Warren Street and Euston, which is different to others in the current official London Tube map, but is not often noticed due to the occlusion of the Northern line in this area. It seems unlikely that this sort of creative design could be generalized for these computer optimization methods.
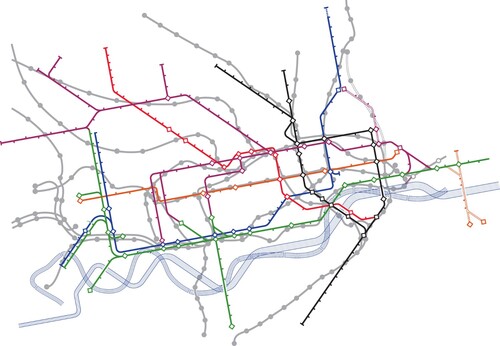
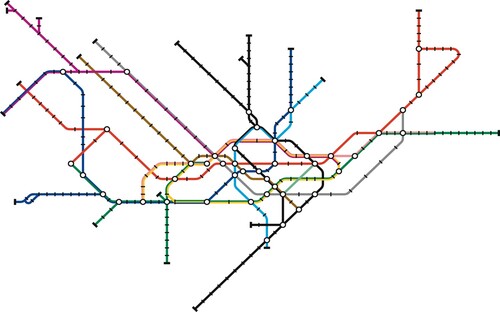
The result is that computer-generated schematic designs may meet some more obvious design criteria, and even at times they can be better than badly designed human maps (of which there are a few notable examples, such as Madrid – Stott et al., Citation2010) but, overall there is no contest currently between AI and human. At present, human metro mapmakers are better at producing readable, engaging schematic maps – shows a recent, fully-automated attempt at London's Underground network using state-of-the-art methods. Computer optimization methods could be improved, but there are diminishing returns possible because the measurement of more subtle design objectives is difficult, and such methods struggle as the number of criteria increases.
Figure 11. A schematic showing the eleven lines of the London Underground network, courtesy of Martin Nöllenburg and Soeren Terziadis. This was generated entirely automatically based on the geographical locations of the stations, a list of stations on each line and a predefined set of optimization criteria. The algorithm, developed by Martin Nöllenburg and Alexander Wolff, which was used to compute the diagram, did not take into account station label placement. Algorithms exist which perform this either while configuring the lines, or as a post-processing step, but these are only practical for smaller networks: This task remains challenging for automated approaches owing to the complexity of the London tube map.
Recent advances in deep learning have produced a flurry of generative AI methods that are being used in the public sphere. Text generation tools such as ChatGPT are becoming widely used, and image generation methods such as Stable Diffusion and DALL·E can generate images from text prompts. These methods are based on variants of neural networks. Despite the notional similarity with brain structure, where both digital and human brains consist of interconnected neurons, the AI techniques have no underlying intelligence. Instead, their capabilities are based on analysis of large amounts of training data. In the case of Stable Diffusion, training was on 12 billion text and image pairs (Baio, Citation2022). This data is fed into the neural network in a training phase before the generation phase is applied. Such systems are controversial (Zhuo et al., Citation2023). An issue is that they are ‘black box’, where the method behind generating the resultant output is unclear. One consequence of this is that there are no guarantees that the output will meet the input requirements. Attribution is a potential problem, as their training uses publicly available data, often without explicit permissions. Further copyright issues can occur because the output is not always completely distinguished from items in the input training set. These and more underlying legal and ethical concerns will be hotly debated over the next few years.
Casting aside the ethical issues with generative neural networks, could they be used to design Tube maps? The current deep learning methods aim at producing text or images, whereas public transport schematics are conceptually different. Hence, the neural net input and output would have to be tuned to this different structure. This is not fundamentally difficult, altering neuron input from sentences or pixels to cartographic data would surely be feasible. However, perhaps the critical problem is training data. Millions of human-produced examples are required for training the current deep learning models. In contrast, the public transport schematics available at present are a handful for each metro system, and even relatively high-volume examples such as bus network London spider diagrams are limited to a few hundred. Hence, there is simply not the amount of data for these schematics to train a neural network and so successfully generate even simple outputs. As a result, without even considering whether such deep learning methods could adequately mimic human design processes, the current state of generative AI technology and its reliance on vast amounts of training data means that, without radical advances in technology, deep learning-based public transport design is not on the horizon.
This is not to say that computer generation of schematic transport diagrams should be completely discarded. In smaller cases, for example, personal route maps or in limited areas of a network, optimization-based automated metro map layout methods are quite capable of generating adequate designs in high volume. Such techniques could also help speed up human design so that tooling could be provided to assist in both initial layout and during the refinement of schematics. However, my view is that human input remains critical to good schematic design and that the skilled designers who followed in Beck's footsteps will be tasked with producing public transport schematics for some years to come.
Notes on the Cover
The cover of this Special Issue shows a concentric circles and spokes map of the London Underground that was created by Jon Hunter, Head of Design at Transport for London, in 2024. Its primary motivation was to market a mobile phone brand. Hence, it was not intended as a potential replacement for the current official design. Schematization comes in many flavours but it is hard to think of a more radical departure from Beck's principles than this (see also Roberts et al., Citation2016). However, the ever-growing number of rail services shown on the official map undoubtedly makes the task of configuring them increasingly difficult for the designer. This has led many people to suggest that fresh approaches might be needed.
Notes on the Contributors
 Maxwell J. Roberts completed a BSc and PhD in psychology at the University of Nottingham, UK, and joined the University of Essex as a lecturer in 1993. Originally researching logical reasoning and intelligence, his focus is now on schematic map usability and aesthetics. He has authored numerous papers and four books on map design. His work has been exhibited in Germany, Austria, the USA, and the UK.
 David Forrest is an Honorary Research Fellow at the University of Glasgow, having retired in 2022 after 40 years of teaching and researching cartography and geospatial science at Glasgow and other universities. He has served as President of the BCS and Vice-President of the International Cartographic Association. He retains research interest in topographic, tourist and public transport map design and use.
 Clive Richards is Emeritus Professor of Information Design at Birmingham City University. Clive completed his PhD in Diagrammatics at the Royal College of Art in 1984. His career has combined professional practice in graphic information design with university lecturing, management and research. He is a past president of the Chartered Society of Designers and the International Institute for Information Design.
Peter Rodgers is a Professor of Visual Computing at the University of Kent. His interests include producing novel automatic metro map layout techniques, the application of search-based artificial intelligence and the development of information visualization methods. He has served as Head of the Computational Intelligence Research Group and Head of the School of Computing at his University.
 Doug Rose trained as a cartographer at Hunting Surveys from 1966. He left to join public transport information specialists FWT in 1979 and started his own company in 2017. He has designed over a thousand maps and diagrams and was commissioned by TfL to design a bespoke range of four Johnston typefaces for about 8,000 bus destination displays, taking two years. He is also a London historian on other subjects.
 Robert Waller is a practitioner, educator and researcher in information design. He founded the Information Design Journal in 1979 and was formerly a Professor of Information Design at the University of Reading, where he established the Simplification Centre. He is a past President of the International Institute for Information Design.
Notes
1 I am aware that this is sometimes regarded as a diagram rather than a map, but I choose to use this familiar phrase.
2 I was the founder and original editor, along with Bryan Smith, who dropped out after the third issue.
3 The Great British Design Quest, organized by the BBC and the Design Museum.
4 Clive and Ron originally suggested that the Tube map as an illustration for their paper. But it was decided that we had already reprinted it three times, and it was sufficiently well known to be simply referred to (although this may be a eurocentric assumption).
5 See: https://www.ltmuseum.co.uk/collections/stories/design/adapting-design-classic-alternative-tube-maps (Accessed: 25th January 2023).
6 See: https://www.ltmuseum.co.uk/collections/collections-online/posters/item/1995-1823 (Accessed: 25th January 2023).
7 See: https://www.edwardtufte.com/bboard/q-and-a-fetch-msg?msg_id=00005W (Accessed: 25th January 2023).
8 More about adaptations of the Tube map can be found at: https://www.ltmuseum.co.uk/collections/stories/design/adapting-design-classic-alternative-tube-maps (Accessed: 26th April 2024).
References
- Anand, S., Ware, J.M. and Taylor, G. (2006) “Generalisation of Large-Scale Digital Geographic Datasets for Mobile GIS Applications” In Drummond, J.D., Billen, R., Joao, E. and Forrest, D. (Eds) Dynamic and Mobile GIS: Investigating Changes in Space and Time Boca Raton, Florida: CRC Press, pp.161–168.
- Andrews, J.H. (1996) “What Was a Map? The Lexicographers Reply” Cartographica 33 (4) pp.1–12 DOI: 10.3138/NJ8V-8514-871T-221K.
- Baio, A. (2022) “Exploring 12 Million of the 2.3 Billion Images Used to Train Stable Diffusion’s Image Generator” Available at: https://waxy.org/2022/08/exploring-12-million-of-the-images-used-to-train-stable-diffusions-image-generator/ (Accessed: 19th March 2024).
- Barkham, P. (2009) “Where Has My Beloved Thames Gone?” The Guardian (17th September) Available at: https://www.theguardian.com/artanddesign/2009/sep/17/london-new-tube-map-thames#:~:text=By%20removing%20the%20blue%20sweep,of%20north%20and%20south%20London (Accessed: 25th January 2023).
- Brown, B. (1979) “The Graphics Triangle” Information Design Journal 1 (2) pp.123–134 DOI: 10.1075/idj.1.2.06bro
- Cartwright, W. (2015) “Rethinking the Definition of the Word ‘Map’: An Evaluation of Beck’s Representation of the London Underground Through a Qualitative Expert Survey” International Journal of Digital Earth 8 (7) pp.522–537 DOI: 10.1080/17538947.2014.923942.
- Chandler, D. (2022) Semiotics: The Basics (4th ed.) London: Routledge.
- Dow, A. (2005) Telling the Passenger Where to Get Off: George Dow and the Evolution of the Railway Diagrammatic Map Harrow Weald: Capital Transport Publishing.
- Field, K. and Cartwright, W. (2014) “Becksploitation: The Over-use of a Cartographic Icon” The Cartographic Journal 51 (4) pp.343–359 DOI: 10.1179/0008704114Z.000000000150.
- Forrest, D. (1999) “What is a Map?” 19th International Cartographic Conference Ottawa, Canada: 14th–21st August Section 14, pp.10–13.
- Forrest, D. (2003) “The Top Ten Maps of the Twentieth Century: A Personal View” The Cartographic Journal 40 (1) pp.5–15 DOI: 10.1179/000870403235002024.
- Garland, K. (1969) “The Design of the London Underground Diagram” Penrose Annual 62 pp.68–82.
- Garland, K. (1979) “Some General Characteristics Present in Diagrams Denoting Activity, Event and Relationship” Information Design Journal 1 (1) pp.15–22 DOI: 10.1075/idj.1.1.03gar.
- Garland, K. (1994) Mr Beck‘s Underground Map: A History Harrow Weald: Capital Transport Publishing.
- International Cartographic Association (2003) “A Strategic Plan for the International Cartographic Association 2003–2011” (Report) Available at: https://icaci.org/files/documents/reference_docs/ICA_Strategic_Plan_2003-2011.pdf (Accessed 25th March 2024).
- Kent, A.J. (2021) “When Topology Trumped Topography: Celebrating 90 Years of Beck’s Underground Map” The Cartographic Journal 58 (1) pp.1–12 DOI: 10.1080/00087041.2021.1953765.
- Marcus, S. (1979) “Diagramming Complex Systems” Information Design Journal 1 (3) pp.167–174 DOI: 10.1075/idj.1.3.03mar.
- Nöllenburg, M. (2014) “A Survey on Automated Metro Map Layout Methods” Schematic Mapping Workshop 2014 University of Essex, UK: 2nd–3rd April.
- Open Geospatial Consortium (2024) “OGC Glossary” Available at: www.ogc.org/resources/ogc-glossary/
- Richards, C.J. (1980) Diagrammatics: A Taxonomy (Research Student Seminar Paper) London: Royal College of Art, Department of Design Research.
- Richards, C.J. and Engelhardt, Y. (2019) “The DNA of Information Design for Charts and Diagrams” Information Design Journal 25 (3) pp.278–293 DOI: 10.1075/idj.25.3.05ric.
- Richards, C.J. and Johnson, R. (1980) “Graphic Codes for Flow Charts” Information Design Journal 1 (4) pp.261–270 DOI: 10.1075/idj.1.4.06ric.
- Roberts, M.J. (2012) Underground Maps Unravelled: Explorations in Information Design Wivenhoe, Essex: M.J. Roberts.
- Roberts, M.J. (2019a) “The Decade of Diagrams” Schematic Mapping Workshop 2019 TU Wien, Vienna, Austria: 11th–12th April.
- Roberts, M.J. (2019b) Tube Map Travels: Imitations, Adaptations, and Explorations Worldwide St Leonards, Kent: Capital Transport Publishing.
- Roberts, M.J., Gray, H. and Lesnik, J. (2017) “Preference versus Performance: Investigating the Dissociation Between Objective Measures and Subjective Ratings of Usability for Schematic Metro Maps and Intuitive Theories of Design” International Journal of Human-Computer Studies 98 pp. 109–128 DOI: 10.1016/j.ijhcs.2016.06.003.
- Roberts, M.J., Newton, E.J. and Canals, M. (2016) “Radi(c)al Departures: Comparing Conventional Octolinear Versus Concentric Circles Schematic Maps for the Berlin U-Bahn/S-Bahn Networks Using Objective and Subjective Measures of Effectiveness” Information Design Journal 22 (2) pp.92–115.
- Roberts, M.J. and Rose, D. (2016) “Map-Induced Journey-Planning Biases for a Simple Network: A Docklands Light Railway Study” Transportation Research Part A: Policy and Practice 94 pp. 446–460 DOI: 10.1016/j.tra.2016.09.023.
- Rose, D. (2020) “Lack of Complaint is No Measure of Success – Not All Network Diagrams are Created Equal” Rail Infrastructure 137 (September/October) pp.63–66.
- Stott, J., Rodgers, P., Martínez-Ovando, J.C. and Walker, S.G. (2011) “Automatic Metro Map Layout Using Multicriteria Optimization” IEEE Transactions on Visualization and Computer Graphics 17 (1) pp.101–114 DOI: 10.1109/TVCG.2010.24.
- Weber, D. (1980) “New York’s New Subway Map: The Passenger Must Come First” Design: London Council (March) p.375.
- Wu, H.Y., Niedermann, B., Takahashi, S., Roberts, M.J. and Nöllenburg, M. (2020) “A Survey on Transit Map Layout – From Design, Machine, and Human Perspectives” Computer Graphics Forum 39 (3) pp.619–646 DOI: 10.1111/cgf.14030.
- Zhuo, T.Y., Huang, Y., Chen, C. and Xing, Z. (2023) “Exploring AI Ethics of ChatGPT: A Diagnostic Analysis” arXiv preprint arXiv:2301.12867.