
Abstract
Alocasia cucullata (Lour.) Schott is an Araceae plant of ornamental and medicinal use grown in many parts of Asia. The cytogenetics of this species have not yet been reported, except for the chromosome number. In this study, sequential combined propidium iodide (PI) and 4′,6-diamidino-2-phenylindole (DAPI) (CPD) staining and dual-color fluorescence in situ hybridization (FISH) with 5S and 45S rDNA probes were employed for the chromosome analysis of this species. A. cucullata has a diploid chromosome number of 2n = 28, and a karyotype length of 108.53 ± 11.29 μm with the chromosome size ranging from 9.19 to 6.19 μm. CPD staining revealed two pairs of red CPD bands at the terminals of the short arms of two submetacentric chromosome pairs and a pair of DAPI+ bands in the interstitial regions of the long arms of a metacentric pair. FISH of the rDNA probes revealed two pairs of 45S rDNA loci corresponding to the CPD bands, and a single 5S rDNA locus located in the interstitial regions of the short arms of the DAPI-banded pair. The chromosome measurements, fluorochrome bands and rDNA FISH signals were used to identify the chromosomes, and the molecular cytogenetic karyotype of this species were established. The karyotype was formulated as 2n = 4x = 28 = 20m + 8sm, and the six asymmetry indices, CI, A1, A2, As K%, AI and the Stebbins’ type were 40.40 ± 6.65, 0.30, 0.13, 59.08, 2.09 and 2A, respectively.
1. Introduction
The genus Alocasia (Schott) G. Don (Araceae) comprises over 113 species of rainforest understory plants in Southeast Asia, the Malesian region, and Australia (Nauheimer et al. Citation2012). Alocasia cucullata (Lour.) Schott is a species of this genus known by the common name Chinese taro (Chinese name “jianweiyu”), and is grown as an ornamental in many parts of Asia, such as China, India, Sri Lanka, and Burma. It also has medicinal value: it is a well-known ethnic medicine of the Zhuang, Dai, and Dong nationalities in China and is traditionally used for detoxification, clearing excessive heat, reducing swelling and easing pain in the body, and is applied internally to treat flu, fever, tuberculosis and stomach troubles, or externally to treat snakebite, abscesses, rheumatism, and arthritis (State Administration of Traditional Chinese Medicine Citation1999). Furthermore, recent reports have verified its immuno-modulating effect and antitumor activity (Peng et al. Citation2013; Wei et al. Citation2015).
Cytogenetic studies in the Alocasia genus were so far restricted to chromosome counts and conventional karyotype descriptions (Hotta Citation1971; Marchant Citation1971; Bhattacharya Citation1974; Ramachandran Citation1978; Ankei Citation1987; Subramanian and Munian Citation1988; Nguyen et al. Citation1998; Ishida Citation2001; Liu et al. Citation2008; Sultana et al. Citation2011; Afroz et al. Citation2013). For A. cucullata, the karyotype has not been established; only the chromosome number was reported (Bhattacharya Citation1974; Ankei Citation1987; Ishida Citation2001).
Karyotype analysis is essential for cytogenetic characterization and subsequent studies in taxonomy, evolution and genomics of a plant species. However, karyotype analysis is usually hampered by the paucity of chromosome markers, which has limited the identification of individual chromosomes. To circumvent this shortcoming, chromosome banding techniques such as C-, N-, and fluorochrome banding, as well as fluorescence in situ hybridization (FISH) with repetitive sequences as probes, were successively applied in karyotyping (Levin Citation2002). Fluorochrome banding using fluorescent dyes preferentially binding to AT- or GC-rich DNA sequences enables us to identify different types of heterochromatin (Sumner Citation1990), and the bands are useful chromosome markers for karyotype analysis in plants (Moscone et al. Citation1996). Among the fluorescent dyes, 4′,6-diamidino-2-phenylindole (DAPI) can be used alone to reveal AT-rich chromosomal regions, and can also be used in combination with chromomycin A3 (CMA) or propidium iodide (PI) to reveal AT- and GC-rich chromosomal regions simultaneously (Schweizer Citation1976; She et al. Citation2006, Citation2015). Of the repetitive DNA probes for FISH, 5S rRNA gene (5S rDNA) and 18S-5.8S-25S rRNA gene (45S rDNA) are most widely applied in plants. Physical mapping of the 5S and 45S rDNAs provides universally applicable markers for chromosome identification, genome characterization and evolutionary analysis in many plants (e.g. Moscone et al. Citation1999; Hasterok et al. Citation2001; She et al. Citation2015).
In the current study, the mitotic chromosomes of A. cucullata were characterized using sequential combined PI and DAPI (CPD) staining and FISH with 5S and 45S rDNA probes. The karyotype was, for the first time, established using chromosome measurements, fluorochrome bands, and rDNA FISH signals, providing a preliminary molecular cytogenetic characterization of this important Alocasia species.
2. Materials and methods
2.1. Plant material and chromosome preparation
Plants of A. cucullata (Lour.) Schott were collected from Yunnan Province, China, and maintained in the botanic garden at Huaihua University. Mitotic chromosomes were prepared from root tips collected from potted plants using the procedure described by She et al. (Citation2006). The root tips were harvested and treated with saturated α-bromonaphthalene for 3.5 h, and then fixed with 3:1 (v/v) methanol/glacial acetic acid overnight. The fixed root tips were washed thoroughly with double distilled water, and then digested for 3.5 h at 28°C with the enzyme solution comprised of 1% cellulase RS (Yakult Pharmaceuticals, Tokyo, Japan), 1% pectolyase Y23 (Yakult Pharmaceuticals), and 1% cytohelicase (Sigma, Steinhem, Germany) in citric buffer (4 mM citric acid, 6 mM sodium citrate, pH 4.5). One or two root tips were transferred to a glass slide with the fixative and dissected thoroughly using fine-pointed forceps. Finally, the slides were dried above a flame.
2.2. CPD staining
The CPD staining followed the procedure described by She et al. (Citation2006). Briefly, chromosome preparations were treated with RNase A and pepsin, and then stained for at least 30 min with a mixture of PI (0.6 μg ml−1) and DAPI (3 μg ml−1) in a 30% solution of Vectashield H100 (Vector Laboratories, Burlingame, CA, USA). Images were acquired with an Olympus BX60 microscope (Olympus, Tokyo, Japan) and a CoolSNAP camera (Photometrics, Tuscon, AZ, USA), using MetaMorph software (Molecular Devices, Sunnyvale, CA, USA). PI and DAPI gray scale images of the same plate were merged to produce a CPD image.
2.3. Probe labeling and FISH
The pTa794 clone containing a 410 bp BamHI fragment of the 5S rDNA from wheat (Gerlach & Dyer Citation1980) and the 45S rDNA clone containing a 9.04-kb 45S rDNA insert from tomato (Perry and Palukaitis Citation1990) were used as probes, and labeled with biotin-16-dUTP and digoxigenin-11-dUTP, respectively, using the Nick Translation Kit (Roche, Mannheim, Germany).
FISH with the 5S and 45S rDNA probes was sequentially carried out on the same slides previously stained with CPD. The slides previously stained were washed twice in 2× SSC for 10 min each, dehydrated through an ethanol series (70, 90, and 100%, 5 min each) and then used for hybridization. The FISH methodology followed that described by She et al. (Citation2015). The 5S probe was detected using Cy3-streptavidin (Amersham Biosciences, Buckinghamshire, UK) and amplified using biotinylated anti-avidin (Vector Laboratories) together with Cy3-streptavidin. The 45S probe was detected by anti-digoxigenin fluorescein (Roche) and amplified with fluorescein anti-sheep (Vector Laboratories). Slides were counterstained with DAPI (3 μg ml−1), and examined with the Olympus BX60 microscope (Olympus, Tokyo, Japan) and CoolSNAP camera (Photometrics, Tuscon, AZ, USA). Green (fluorescein), red (Cy3) signals and blue (DAPI) fluorescence were captured independently and then merged into single images by the MetaMorph software. The final images were adjusted with Adobe Photoshop CS3 (Adobe System Incorporation, California, CA, USA).
2.4. Karyotype analysis
Five metaphase cells subjected to the CPD staining and FISH with the rDNA probes were selected for measurement. The chromosomes were measured using Adobe Photoshop CS3 to obtain the karyotype length (i.e. the total length of the haploid complement, TCL), the chromosome relative lengths (RL; % of haploid complement), arm ratios (AR = long arm/short arm), percentage distance from the centromere to the fluorochrome band or rDNA site (di = d×100/a; d = distance of the center of the band or site from the centromere; a = length of the corresponding chromosome arm). For numerical characterization of the karyotype, the following asymmetric indices were calculated: mean centromeric index (CI), intrachromosomal asymmetry index (A1) and interchromosomal asymmetry index (A2), ratio of the length of all long arms in the chromosome set to the total chromosome length in set (As K%), asymmetry index (AI), and the types of Stebbins (Paszko Citation2006). Chromosomes were arranged according to descending order of length and named according to the system described by Levan et al. (Citation1964).
3. Results and discussion
The chromosome measurements are listed in Table . Representative mitotic chromosomes and the karyotype are shown in Figure . The idiograms displaying the chromosome measurements, fluorochrome bands, and rDNA FISH signals are illustrated in Figure .
Table 1. Chromosome measurements of Alocasia cucullata.
Figure 1. Mitotic chromosomes and interphase nuclei of Alocasia cucullata after sequential CPD staining and FISH with 5S and 45S rDNA probes. (A, C) CPD banded metaphase and interphase cells, respectively. (B, D) The chromosomes and interphase nucleus hybridized with 5S (red) and 45S (green) rDNA probes and counterstained using DAPI (blue). (E) The karyotype showing CPD and DAPI+ bands. (F) The karyotype showing rDNA FISH signals and DAPI+ bands. Chromosome numbers in (A) are designated by means of karyotyping. Red arrowheads in (A) and (C) indicate the CPD bands and CPD-banded blocks, respectively; Blue arrows in (A) and (B) indicate the DAPI+ bands; Green arrowheads in (D) indicate the four strongly fluorescing knobs of the 45S rDNA signals. Scale bars represent 5 μm.
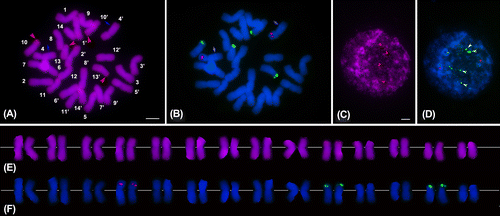
Figure 2. Idiogram of Alocasia cucullata displaying the chromosome measurements, fluorochrome bands and rDNA FISH signals. Light gray, gray and black blocks represent the 5S rDNA site, 45S rDNA site (CPD band) and DAPI+ band, respectively. The ordinate scale on the left indicates the relative length of the chromosomes.
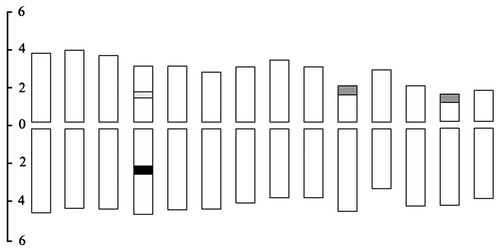
A. cucullata had a diploid chromosome number of 2n = 28, in agreement with the counts reported by other authors (Bhattacharya Citation1974; Ankei Citation1987; Ishida Citation2001). The karyotype length was 108.53 ± 11.29 μm, and the chromosome size ranged from 9.19 to 6.19 μm. The karyotype of A. cucullata comprised 10 metacentric and four submetacentric homologous pairs with arm ratios varying from 1.11 to 2.57, and formulated as 2n = 4x = 28 = 20m + 8sm considering that the Alocasia species studied have a base number of x = 7 (Petersen Citation1989). The six asymmetry indices, CI, A1, A2, As K%, AI and the Stebbins’ type were 40.40 ± 6.65, 0.30, 0.13, 59.08, 2.09 and 2A, respectively. These results demonstrated that the karyotype of A. cucullata is symmetric, similar to the karyotypes of A. odora, A. indica, A. montana, A. fallax and A. fornicata (Ramachandran Citation1978; Nguyen et al. Citation1998; Liu et al. Citation2008; Sultana et al. Citation2011; Afroz et al. Citation2013).
After CPD staining, the chromosomes of A. cucullata exhibited two pairs of red CPD bands and one pair of blue DAPI+ bands (Figure A, E). The CPD bands were located at the terminals of the short arms of chromosome pairs 10 and 13, while the DAPI+ bands were situated in the interstitial regions of the long arms of pair 4 (di = 52.20%). The DAPI+ bands became increasingly contrasted following the FISH procedure (Figure B). In the CPD-banded interphase nuclei, four red heterochromatin blocks were observed (Figure C).
The dual-color FISH analysis with the rDNA probes showed a pair of 5S rDNA signals and two pairs of 45S rDNA signals (Figure B, F). The single 5S locus was distributed in the interstitial regions of the short arms of pair 4 (di = 50.74%), while the 45S loci were co-localized with the terminal CPD bands. In the interphase cells, the rDNA FISH generated a pair of 5S signals and dispersed 45S signals which consisted of four relatively strongly fluorescing knobs and many weakly fluorescing spots that emanated from the knobs (Figure D) (Caperta et al. Citation2002).
Previously, terminal and interstitial GC-rich chromosomal regions were detected using CMA/DAPI staining in other Alocasia species including A. fallax (2n = 28), A. odora (2n = 56) and A. fornicata (2n = 28) (Sultana et al. Citation2011; Afroz et al. Citation2013). Fifteen and 20 GC-rich regions were detected in A. fallax and A. odora, respectively (Sultana et al. Citation2011), more than the GC-rich regions of A. cucullata presented herein. Two morphological forms of A. fornicata were found to have two or six terminal GC-rich regions, showing an intraspecies variation in GC-rich region (Afroz et al. Citation2013). Whether the interspecies and intraspecies differences in GC-rich region represent the variation in 45S rDNA site needs to be validated by the sequential fluorochrome staining and FISH with rDNA probes as used in this study.
Disclosure statement
No potential conflict of interest was reported by the authors.
Funding information
This work was supported by the Bureau of Science and Technology of Hunan Province, China [2013FJ4324].
References
- Afroz M, Sultana SS, Alam SS. 2013. Karyotype and RAPD analysis of three morphological forms of Alocasia fornicata (Roxb.) Schott. Cytologia. 78(3):269–275.
- Ankei T. 1987. Morphology and chromosome numbers of Araceae in Iriomote Island. Okinawa. Biol Mag. 25(1):1–11.
- Bhattacharya GN. 1974. Cytological studies in the genus Alocasia G. Don. In: Kachroo P, editor. Advancing frontiers in cytogenetics. Delhi: Hindustan Publ. Co.; p. 118–122.
- Caperta AD, Neves N, Morais-Cecílio L, Malhó R, Viegas W. 2002. Genome restructuring in rye affects the expression, organization and disposition of homologous rDNA loci. J Cell Sci. 115(14):2839–2846.
- Gerlach WL, Dyer TA. 1980. Sequence organization of the repeated units in the nucleus of wheat which contains 5S rRNA genes. Nucleic Acids Res. 8(21):4851–4865.
- Hasterok R, Jenkins G, Langdon T, Jones RN, Maluszynska J. 2001. Ribosomal DNA is an effective marker of Brassica chromosomes. Theor Appl Genet. 103(4):486–490.
- Hotta M. 1971. Study of the family Araceae: genera remarks. J Japanese Bot. 20(4):269–310.
- Ishida G. 2001. Karyomorphological observations on some aroids cultivated in the Hiroshima Botanical Garden I. Alocasia. Bull. Hiroshima Bot Gard. 20(1):1–33.
- Levan A, Fredga K, Sandberg A. 1964. Nomenclature for centromeric position in chromosomes. Hereditas. 52(2):201–220.
- Levin DA. 2002. The role of chromosomal change in plant evolution. New York, NY: Oxford University Press.
- Liu JM, He ZC, Wu H, Zhang SZ, Li QG. 2008. Observations on the behavior of cytogenetics and pollen development of Alocasia odora (Lindl.) K. Koch. J Wuhan Bot Res. 26(1):12–20.
- Marchant CJ. 1971. Chromosome variation in Araceae: II: Richardieae to Colocasieae. Kew Bull. 25(1):47–56.
- Moscone EA, Lambrou M, Ehrendorfer F. 1996. Fluorescent chromosome banding in the cultivated species of Capsicum (Solanaceae). Plant Syst Evol. 202(1):37–63.
- Moscone EA, Lein F, Lambrou M, Fuchs J, Schweizer D. 1999. Quantitative karyotyping and dual-color FISH mapping of 5S and 18S-25S rDNA probes in the cultivated Phaseolus species (Leguminosae). Genome. 42(6):1224–1233.
- Nauheimer L, Boyce PC, Renner SS. 2012. Giant taro and its relatives: a phylogeny of the large genus Alocasia (Araceae) sheds light on Miocene floristic exchange in the Malesian region. Mol Phylogenet Evol. 63(1):43–51.
- Nguyen VX, Yoshino H, Tahara M. 1998. Karyotype analyses on diploid and tetraploid of Alocasia odora (Roxb.) K. Koch. Aroideana. 21:8–12.
- Paszko B. 2006. A critical review and a new proposal of karyotype asymmetry indices. Plant Syst Evol. 258(1):39–48.
- Peng Q, Cai H, Sun X, Li X, Mo Z, Shi J. 2013. Alocasia cucullata exhibits strong antitumor effect in vivo by activating antitumor immunity. PLoS One. 8(9):e75328.
- Perry KL, Palukaitis P. 1990. Transcription of tomato ribosomal DNA and the organization of the intergenic spacer. Mol Gen Genet. 221(1):102–112.
- Petersen G. 1989. Cytology, systematics and chromosome numbers of Araceae. Nord J Bot. 9(2):19–166.
- Ramachandran K. 1978. Cytological studies on south Indian Araceae. Cytologia. 43(2):289–303.
- Schweizer D. 1976. Reverse fluorescent chromosome banding with chromomycin and DAPI. Chromosoma. 58(4):307–324.
- She CW, Jiang XH, Ou LJ, Liu J, Long KL, Zhang LH, Duan WT, Zhao W, Hu JC. 2015. Molecular cytogenetic characterisation and phylogenetic analysis of the seven cultivated Vigna species (Fabaceae). Plant Biol. 17(1):268–280.
- She CW, Liu JY, Song YC. 2006. CPD staining: an effective technique for detection of NORs and other GC-rich chromosomal regions in plants. Biotech Histochem. 81(1):13–21.
- State Administration of Traditional Chinese Medicine. 1999. Chinese materia medica. Shanghai: Shanghai Scientific and Technical Publishers.
- Subramanian D, Munian M. 1988. Cytotaxonomical studies in South Indian Araceae. Cytologia. 53(1):59–66.
- Sultana SS, Ara H, Alam SS. 2011. Karyotype analysis with orcein and CMA in two species of Alocasia (Schott) G. Don (Araceae). Bangladesh J Bot. 40(1):53–56.
- Sumner AT. 1990. Chromosome banding. London: Unwin Hyman.
- Wei P, Zhiyu C, Xu T, Xiangwei Z. 2015. Antitumor effect and apoptosis induction of Alocasia cucullata (Lour.) G. Don in human gastric cancer cells in vitro and in vivo. BMC Complement Altern Med. 15:33.