
ABSTRACT
Phosphoenolpyruvate carboxylase (PEPC; EC 4.1.1.31) is an enzyme in the family of carboxylyases found in plants and some bacteria, but not in fungi or animals. In this study, bioinformatic characterization of PEPC enzyme was performed in protein sequences of 34 C4 and CAM plants of 14 different families. In protein–protein interactions analysis by STRING 10 tool, 10 functional partners and enriched pathways were identified in Zea mays and other species. The functional and structural analyses were investigated by ProDom, ProtParam, SOPMA, Predotar 1.03, SignalP 4.1, TargetP 1.1, and TMHMM 2.0 tools in ExPASy database. Fifteen ProDom domains were common in selected plants while there was not any transmembrane helix in PEPC proteins. Tertiary structure was predicted by Phyre2 and TM-score servers, then their qualities were verified by SuperPose, PROCHECK, and ProSA-web servers. All the tertiary structure samples were estimated using “c1jqoA” model, with 100% confidence. In MEME and MAST analyses, four common conserved motifs were obtained in all C4 and CAM plants. The protein sequences gwere aligned with ClustalW algorithm by MEGA 6.06 software and phylogenetic tree was constructed using the neighbor-joining (NJ) method and the bootstrap test carried out with 1000 replicates. Based on the phylogenetic relationships, PEPCs were divided into seven groups. According to the results, there is a high identity of PEPC in different species of C4 and CAM plants so that they should be derived from a common ancestor. The results provide background of bioinformatic studies for the function and evolution of PEPC in other plants.
Introduction
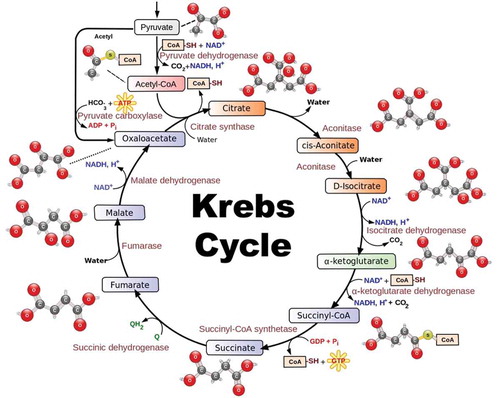
The study of CO2 fixation enzymes in different plants is an important research activity (Papini et al. Citation2010; Stracquadanio et al. Citation2010). Phosphoenolpyruvate carboxylase (PEPC) (EC 4.1.1.31) catalyzes the irreversible b-carboxylation of phosphoenolpyruvate (PEP) by bicarbonate in the presence of HCO3− and Mg2+ as the cofactor, to produce oxaloacetate (OAA) and inorganic phosphate (O’Leary Citation1982; Chollet et al. Citation1996) (). PEPC is a plentiful cytosolic enzyme extensively distributed in most plant tissues, green algae, and microorganisms including many kinds of bacteria and cyanobacteria; but is not present in animals, fungi, and yeast (O’Leary Citation1982; Lepiniec et al. Citation1994; Toh et al. Citation1994; Chollet et al. Citation1996; Gehrig et al. Citation1998a; Kai et al. Citation2003; Izui et al. Citation2004). O’Leary et al. (Citation2011) found that PEPC is under the influence of the circadian clock in a number of plants. In other words, PEPC can play a role in the regulation of CO2 concentration and cytosolic pH by capturing part of the CO2 (in its hydrated form) respired by stems. It is also involved intimately in C4-dicarboxylic acid metabolism in plants. Additionally its fundamental roles in the initial fixation of atmospheric CO2 during C4 photosynthesis and Crassulacean acid metabolism (CAM), PEPC functions anaplerotically in a variety of nonphotosynthetic systems like C/N partitioning in C3 leaves, seed formation and germination, and fruit ripening (Leegood and Osmond Citation1990; Lepiniec et al. Citation1994). Nonphotosynthetic isoforms of PEPC play precise roles in guard-cell C metabolism during stomatal opening (Outlaw Citation1990) and plant host–cell C4-acid formation in N2-fixing legume root nodules (Deroche and Carrayol Citation1988; Vance et al. Citation1994). The first identified PEPC activity was discovered in wood of Robinia pseudoacacia (Höll Citation1973, Citation1974). Recently, PEPC was detected in the bark chlorenchyma of Pinus sylvestris (Ivanov et al. Citation2006). Furthermore a PEPC enzyme has been purified and characterized from the archaeon Methanothermus sociabilis, which is different from plant and bacterial PEPCs (Sako et al. Citation1996).
Figure 1. Diagram of the Krebs cycle, also known as the tricarboxylic acid (TCA) cycle or the citric acid cycle.
Source: https://www.myguruedge.com/our-thinking/mcat-and-the-medical-school-admissions-process/do-i-really-need-to-know-the-krebs-cycle, reproduced with permission.
Higher plants have several isoforms of PEPC with different kinetic and regulatory properties which link with their respective roles in cellular metabolism (Latzko and Kelly Citation1983). In C4 plants like sugarcane and maize and in some other plants like cactus and pineapple which belong to the CAM plant category, one of the PEPC isoforms is expressed plentifully and plays a significant role in photosynthesis. So, extensive attention has been paid to this enzyme in C4 and CAM plants (Hatch Citation1992).
In plants, PEPCs are encoded by small gene families and show variance expression in plant organs that possibly reflect specific functions for each gene, as has been revealed in Zea mays (Kawamura et al. Citation1990; Dong et al. Citation1998), Sorghum bicolor (Lepiniec et al. Citation1993), Flaveria trinervia (Ernst and Westhoff Citation1997), and Vanilla planifolia (Gehrig et al. Citation1998b). Therefore, it may be distinguished from the so-called housekeeping PEPC genes, expressed in tissues with a high metabolic activity.
As PEPC activity is found to be a key factor in limiting the magnitude of CAM, it can be hypothesized that the mechanisms that regulate PEPC activity play a crucial role in determining both genotypic capacity and phenotypic plasticity in CAM expression. A number of studies have confirmed that PEPC activity in CAM plants is regulated at both transcriptional and posttranslational levels. Transcriptional control adjusts the amount of PEPC protein, via changes in the abundance of PEPC mRNA. In the facultative species Mesembryanthemum crystallinum and Kalanchoe blossfeldiana, where CAM can be induced by salinity or dehydration, PEPC transcripts can accumulate within 2–3 h after stress (Schmitt Citation1990; Brulfert et al. Citation1993; Taybi et al. Citation1995).
In C4 plants, like maize and sugarcane, PEPC, with its high affinity for comparatively passive bicarbonate (one of the dissolved forms of CO2), produces C4 compounds, which are then decarboxylated to supply RuBisCO with a high concentration of CO2 (Hatch Citation1987). This CO2 enrichment allows C4 plants to suppress RuBisCO oxygenation more efficiently and to sustain higher rates of photosynthesis than C3 plants. Owing to its high affinity for inert bicarbonate, PEPC has the potential to convert plentiful atmospheric CO2 into more useful compounds. PEPC genes have been introduced into C3 plants, such as Arabidopsis (Chen et al. Citation2004), rice (Ku et al. Citation1999), potato (Rademacher et al. Citation2002) and tobacco (Kogami et al. Citation1994; Häusler et al. Citation2002) to improve the efficiency of CO2 fixation in C3 photosynthesis (Furbank and Taylor Citation1995).
The primary structure of PEPC was first realized from a cloned DNA of Escherichia coli in 1984 (Fujita et al. Citation1984). Since then, more than 20 molecular species of PEPC have been recognized from their primary structures, including the enzymes from maize (Izui et al. Citation1986; Yanagisawa et al. Citation1988), cyanobacteria (Fumiaki et al. Citation1985), and an extreme thermophile (Nakamura et al. Citation1995). The primary structure of E. coli PEPC is very similar to the plant enzyme except for the extra residues at the N terminus in the latter, which comprise a regulatory phosphorylation domain (Chollet et al. Citation1996). The crystal structure of E. coli PEPC has been determined and can be applied directly to plant PEPC (Kai et al. Citation1999). In addition, the three-dimensional structure and the location of residues which are essential for catalysis and regulation of enzyme activity are known for the bacterial enzyme. All PEPC motifs are crucial for enzyme structure and the residues forming the active site are highly conserved in PEPCs in plants and bacteria. The most vital feature distinguishing plant and bacterial PEPCs is the presence of a Ser residue at the N terminus of plant enzymes forming part of the invariant acid-base-XX-SIDAQLR motif, which is absent in PEPCs from bacteria (Vidal and Chollet Citation1997). This is a very significant difference because the plant enzyme, but not the bacterial enzyme, is reversibly phosphorylated at this Ser residue by PEPC kinases, which have been cloned from Kalanchoe fedtschenkoi and Arabidopsis (Hartwell et al. Citation1999).
Genes encoding PEPC in plants display a highly conserved structure. Most plant PEPC genes (from C4, CAM, or C3 plants) are formed by 10 exons interrupted by nine introns located at conserved positions with respect to the coding sequence (Chollet et al. Citation1996). This high degree of conservation, and the fact that this enzyme is involved in primary carbon fixation in C4 and CAM photosynthesis, has made PEPC genes very valuable molecular markers for the phylogenetic analysis of the distinct ways of carbon fixation in plants (Gehrig et al. Citation1998b, Citation2001; Engelmann et al. Citation2002). These analyses have established that bacterial and plant PEPCs, which have a similar primary structure except for the phosphorylation motif, form two different subgroups (Toh et al. Citation1994; Gehrig et al. Citation1998a, Citation2001). Among plant PEPC genes, it has been suggested that C4 PEPCs have evolved from ancestral C3-type PEPCs (Bläsing et al. Citation2002; Engelmann et al. Citation2002) and proceed faster in monocots than in dicots. Moreover, these phylogenetic analyses demonstrate the polyphyletic origin of CAM PEPCs (Gehrig et al. Citation1998a, Citation2001; Cushman and Bohnert Citation1999).
In current research bioinformatic analyses were done on PEPC in C4 and CAM plants for prediction of different structures and functions. The results could provide bioinformatic background for the investigation of PEPCs in these plants.
Material and methods
In this study, a total of 34 PEPC protein sequences of 14 different families in C4 and CAM plants were collected from National Center for Biotechnology Information (NCBI, http://www.ncbi.nlm.nih.gov).
The Search Tool for the Retrieval of Interacting Genes/Proteins (STRING 10) database (http://string-db.org/) was used to foresee the interacting proteins (Szklarczyk et al. Citation2014). The database contains information from numerous sources, including experimental repositories, computational prediction methods and public text collections.
Various online web services and software were used for analyses of PEPC proteins in C4 and CAM plants. Comparative and bioinformatic analyses were carried out online at the website ExPASy (http://expasy.org/tools). Functional domains in PEPC proteins were identified by ProDom server (http://prodom.prabi.fr/prodom/current/html/form.php) (Altschul et al. Citation1997). Physico-chemical parameters of PEPC proteins were analyzed by ProtParam (http://web.expasy.org/protparam) (Gasteiger et al. Citation2005) and the secondary structure prediction was analyzed by SOPMA (http://npsa-pbil.ibcp.fr/cgi-bin/npsa_automat.pl?page=npsa_sopma.html) (Geourjon and Deleage Citation1995).
Prediction of mitochondrial and plastid targeting sequences was accomplished by Predotar 1.03 server (https://urgi.versailles.inra.fr/predotar/predotar.html) while prediction of signal peptide cleavage sites was achieved by SignalP 4.1 server (http://www.cbs.dtu.dk/services/SignalP) (Petersen et al. Citation2011). Identification of subcellular locations and transmembrane helices in proteins was performed by TargetP 1.1 and (www.cbs.dtu.dk/services/TargetP/) (Emanuelsson et al. Citation2000) and TMHMM 2.0 (http://www.cbs.dtu.dk/services/TMHMM-2.0/) (Moller et al. Citation2001) servers, respectively.
The tertiary structure prediction analysis of PEPC proteins was performed by the Phyre2 server using profile–profile matching and secondary structure (http://www.sbg.bio.ic.ac.uk/phyre2/html/page.cgi?id=index) (Kelley and Sternberg Citation2009). Chimera 1.10.1 was used for 3D structure visualization of Zea mays as the model of plants (https://www.cgl.ucsf.edu/chimera/). Backbone similarities and differences of obtained models were estimated by TM-score server (http://zhanglab.ccmb.med.umich.edu/TM-score/) (Zhang and Skolnick Citation2004; Xu and Zhang Citation2010). Additionally, the SuperPose web server was used to find the most and the least similarities of PEPC sequences in C4 and CAM plants (http://wishart.biology.ualberta.ca/SuperPose/) (Maiti et al. Citation2004). Finally, stereochemical quality and accuracy of the model was evaluated with PROCHECK 3.5 (http://www.ebi.ac.uk/thornton-srv/software/PROCHECK) by Ramachandran plot analysis (Laskowski et al. Citation1993). Z-score was calculated using interactive ProSA-web service (https://prosa.services.came.sbg.ac.at/prosa.php) for the recognition of errors in three-dimensional structure which indicated model quality and total energy deviation of the structure with respect to energy distribution derived from random conformations (Wiederstein and Sippl Citation2007).
The motifs of protein sequences were discovered using the program of Multiple Em for Motif Elicitation (MEME; version 4.10.2) (Bailey et al. Citation2009) and Motif Alignment and Search Tool (MAST; version 4.9.1) (Bailey and Gribskov Citation1998) at the website http://meme.nbcr.net/meme. The parameters of MEME analyses were applied as follows: distribution of motif occurrences, zero or one per sequence; number of different motifs, 10; minimum motif width, six and maximum motif width, 50.
The multiple sequence alignment of PEPC proteins was performed with ClustalW algorithm implemented in Molecular Evolutionary Genetic Analysis (MEGA 6.06) (http://www.megasoftware.net) (Tamura et al. Citation2013) with default parameters. The phylogenetic tree was constructed using the neighbor-joining (NJ) method and the bootstrap test carried out with 1000 replicates.
Results
In the present study, 34 PEPC protein sequences of 14 different families in C4 and CAM plants including Aizoaceae, Amaranthaceae, Asteraceae, Bromeliaceae, Clusiaceae, Cyperaceae, Euphorbiaceae, Hydrocharitaceae, Isoetaceae, Orchidaceae, Poaceae, Polypodiaceae, Welwitschiaceae, and Xanthorrhoeaceae were retrieved from NCBI with FASTA format. Their characteristics including scientific names, types, families, abbreviations, accession numbers, and length of amino acid sequences are listed in .
Table 1. The list of 34 C4 and CAM plants of 14 different families in the study.
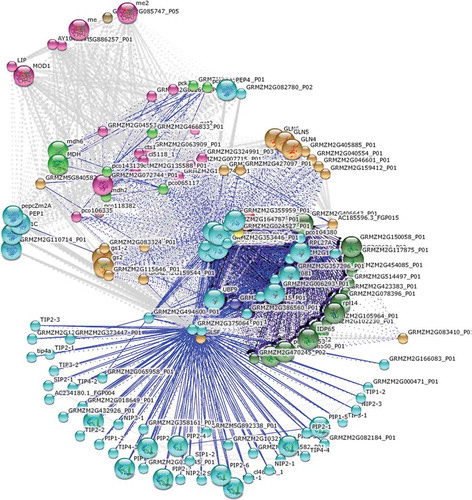
In order to predict the interacting proteins, Zm-PEPC was planned to the STRING 10 tool as a sample of plants. STRING is a database of known and predicted protein interactions. The interactions include direct (physical) and indirect (functional) associations. According to the results, 10 functional partners and 10 enriched pathways of KEGG were identified in the network analysis (, ).
Table 2. Characteristics of input protein (Zm-PEPC), predicted functional partners and KEGG pathways in STRING 10 tool.
Figure 2. Protein–protein interactions using STRING 10 tool. In the interactive network view of predicted proteins, nodes are proteins and the edges represent the predicted functional associations. The K-means algorithm was used to cluster the proteins in 10 different groups. Every color corresponds to a cluster. Inter-cluster edges are represented by dashed-lines. Small nodes: protein of unknown 3D structure; large nodes: some 3D structure is known or predicted; blue lines: gene co-occurrence.
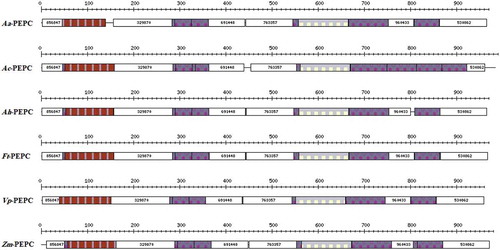
Pattern and profile search was performed by the ProDom (Protein Domain Database) server. ProDom is a comprehensive set of protein domain families automatically generated from the UniProt (Universal Protein Resource) Knowledge Database. According to the results, 15 ProDom domains were common in selected species in C4 and CAM plants; their characteristics are recorded in and .
Table 3. Functional domains of six selected species of C4 and CAM plants by ProDom tool.
Figure 3. Graphical results of functional domains in six selected species of C4 and CAM plants by ProDom server.
In order to investigate the structures and functions of PEPC proteins, Zea Mays (C4) and five other different species including Aloe arborescens (CAM), Ananas comosus (CAM), Amaranthus hypochondriacus (C4), Flaveria trinervia (C4), and Vanilla planifolia (CAM) were selected as the representatives of plants and analyzed by bioinformatics tools. The primary structure of PEPCs was analyzed by ProtParam server. ProtParam computes various physico-chemical properties that can be deduced from a protein sequence including the length, molecular weight, isoelectric point (pI), total number of (Asp+Glu), total number of (Arg+Lys), extinction coefficient, instability index, aliphatic index and grand average of hydropathicity (GRAVY) (). Secondary structure prediction was performed by SOPMA (Self-Optimized Prediction Method with Alignment) server. This server measures the percent of alpha-helix, extended strand, beta-sheet and random coil in protein sequences. Based on the results, the major parts of the PEPCs are alpha helix and random coil ().
Table 4. The results of primary structure analysis and secondary structure prediction in six selected species of C4 and CAM plants.
Post-translational modification predictions were analyzed by Predotar 1.03 and SignalP 4.1 servers. Predotar recognizes the N-terminal targeting sequences of classically targeted precursor proteins. For each protein sequence, Predotar provides a probability estimate as to whether the sequence contains a mitochondrial, plastid or ER targeting sequence. The fourth number (elsewhere) is the estimated probability that no targeting sequence is present. These estimates assume that the sequence in question was randomly chosen from a proteome in which about 10% of proteins are targeted to mitochondria, 10% to plastids and 20% to the ER. Based on the results of Predotar server, all of the PEPC proteins had no targeting sequences (). SignalP 4.1 server predicts the presence and location of signal peptide cleavage sites in protein sequences. The method incorporates a prediction of cleavage sites and a signal peptide/non-signal peptide prediction based on a combination of several artificial neural networks. A signal peptide is a short (5–30 amino acids long) peptide present at the N-terminus of the majority of newly synthesized proteins which are intended towards the secretory pathway. Based on the results of SignalP analysis, there was no signal peptide in PEPC proteins in 34 sample of C4 and CAM plants ().
Table 5. The results of post-translational modification and topology prediction by different tools in six selected species of C4 and CAM plants.
Topology prediction was carried out by TargetP 1.1 and TMHMM 2.0 servers. TargetP 1.1 predicts the subcellular location of eukaryotic proteins. The location assignment is based on the predicted presence of any of the N-terminal presequences: chloroplast transit peptide (cTP), mitochondrial targeting peptide (mTP) or secretory pathway signal peptide (SP). As can be seen in , none of the PEPCs of C4 and CAM plants were predicted to be targeted to chloroplast, mitochondrion or secretory pathway signal peptide. TMHMM 2.0 server has been designated for prediction of transmembrane helices in proteins. Transmembrane helices are to be found in structures of membrane proteins determined by X-ray diffraction. They may also be predicted on the basis of hydrophobicity scales. Because the interior of the bilayer and the interiors of most proteins of studied structure are hydrophobic, it is presumed to be a requirement of the amino acids that span a membrane that they are hydrophobic as well. However, membrane pumps and ion channels also contain numerous charged and polar residues within the generally non-polar transmembrane segments. According to the results of TMHMM 2.0 server, there was not any transmembrane helix in PEPC proteins ().
The tertiary structure prediction of PEPC proteins were conducted by Phyre2 (Protein Homology/analogY Recognition Engine) server, which uses the alignment of hidden Markov models via HHsearch (Söding Citation2005) to significantly evaluate the accuracy of alignment and detection rate. It also incorporates a new ab initio folding simulation called Poing (Jefferys et al. Citation2010) to model regions of the proteins with no detectable homology to known structures. In this analysis, it was attempted to consider high confidence in all samples. So, all the tertiary structure samples were estimated using “c1jqoA” model (PDB accession code: 1jqo), with 100% confidence (, ). Furthermore, the structural similarities and differences among six selected plants were analyzed using TM-score server. TM-score is a metric for measuring the structural similarity of two protein models. It is designed to solve two major problems in the traditional metrics like RMSD (root mean square deviation). (1) TM-score measures the global fold similarity and is less sensitive to the local structural variations; (2) magnitude of TM-score for random structure pairs is length-independent. TM-score has the value of (0,1], where 1 indicates a perfect match between two structures. Following strict statistics of structures in the PDB, scores below 0.17 correspond to randomly chosen unrelated proteins whereas scores higher than 0.5 assume generally the same fold. According to the obtained results, the least similarity of plant sample species belonged to Amaranthus hypochondriacus and Flaveria trinervia with TM-score = 0.9777 (RMSD = 0.56) and the most similarity of them were observed in Vanilla planifolia and Zea mays with TM-score = 0.2807 (RMSD = 3.56). Because tertiary structure is much more conserved than sequence, its comparisons let us to look even further back into biological prehistory (Maiti et al. Citation2004). The most common method for tertiary structure comparison is called structure superposition (or superimposition). So, in order to further evaluate tertiary structure, superposition of their structures was performed by SuperPose web server (, ).
Table 6. The results of tertiary structure prediction in six selected species of C4 and CAM plants.
Figure 4. Tertiary structure prediction of PEPC protein in Zea mays (accession number: NP_001105418.1; PDB accession code: 1jqo), established by Phyre2 server. (a) Ribbons model, (b) secondary structure model (the α-helix in red, the beta sheet in purple, and the random coil in gray), and (c) hydrophobicity surface model (from dodger blue for the most hydrophilic, to white, to orange red for the most hydrophobic). Images were given by Chimera 1.10.1.
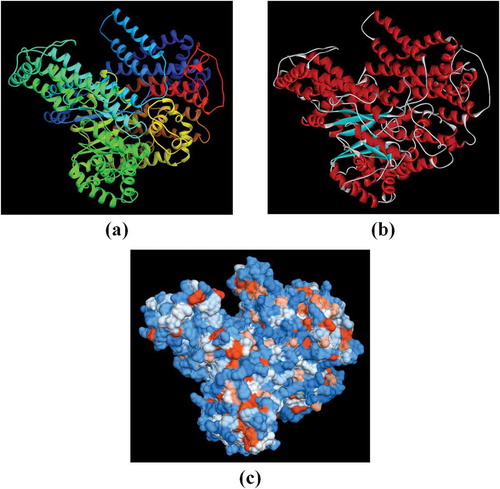
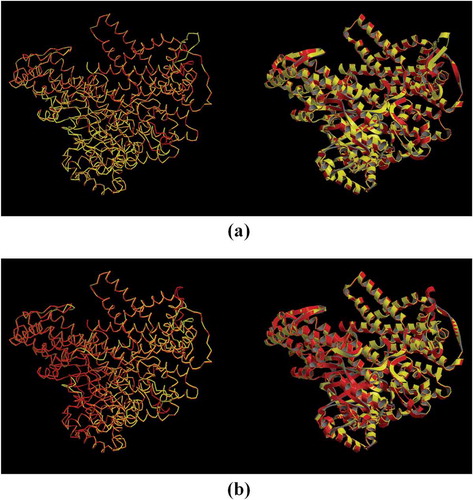
Figure 5. Superposition of (a) Ah-PEPC (red) and Ft-PEPC (yellow), and (b) Vp-PEPC (red) and Zm-PEPC (yellow) models by SuperPose web server. Backbone (left) and ribbon (right) superposed structures are shown in both figures.
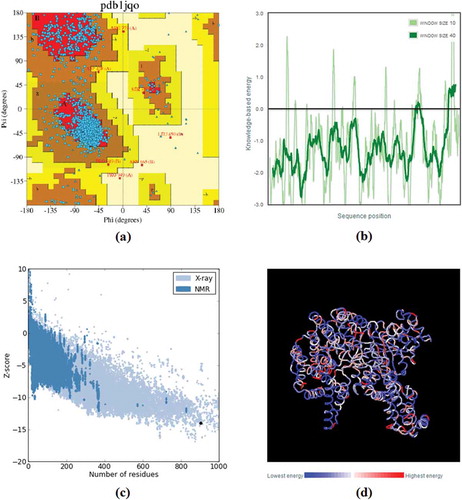
Verification of the stereochemical quality of Zm-PEPC structure was performed by PROCHECK (Programs to Check the Stereochemical Quality of Protein Structures) server and the result was explained as the form of Ramachandran and three other plots. The Ramachandran plot displays the phi-psi torsion angles for all residues in the structure (except those at the chain termini) (Morris et al. Citation1992). The Ramachandran plot for Zm-PEPC indicated that 86.4% of the main-chain dihedral angles are found in the most-favored regions, 13.3% in the additionally allowed, 0.2% in the generously allowed and 0.1% in the disallowed regions ()). The recognition of errors in tertiary structure prediction of Zm-PEPC was performed by ProSA-web (Protein Structure Analysis web) (, , )). ProSA-web provides an easy-to-use interface to the program ProSA (Sippl Citation1993), which is frequently employed in protein structure validation. The Z-score was used for the measurement of the energy as it indicated overall quality of the model. The positive Z-score shows that the structure is not stabilized while zero and negative score is the indication of one of the best ideal structures. In the plot, Z-scores of all protein chains in PDB (Protein Data Bank) determined by X-ray crystallography (light blue) or NMR spectroscopy (dark blue) with respect to their length.
Figure 6. Assessing tertiary structure prediction. (a) Ramachandran plot of PEPC protein in Zea mays (AC: NP_001105418.1; PDB accession code: 1jqo), obtained through PROCHECK server. Glycine residues are separately identified by triangles. The coloring/shading on the plot represents the different regions. The darkest areas (here shown in red) correspond to the “core” regions representing the most favorable combinations of phi-psi values. The regions are labelled as follows: A, core alpha; L, core left-handed alpha; a, allowed alpha; l, allowed left-handed alpha; ~a, generous alpha; ~l, generous left-handed alpha; B, core beta; p, allowed epsilon; b, allowed beta; ~p, generous epsilon; ~b, generous beta. (b) Screenshot of ProSA-web plot of Zm-PEPC showing the energy graph of residue scores of a native protein structure. (c) Screenshot of ProSA-web Z-score plot of Zm-PEPC showing the Z value< 0. (d) Screenshot of ProSA-web molecule visualization with Jmol; residues are colored from blue to red in the order of increasing residue energy.
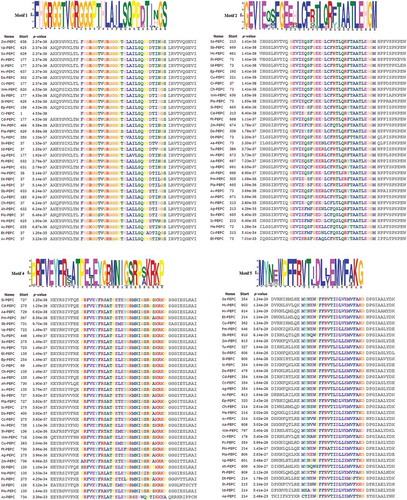
The analyses of protected motifs of PEPC proteins were performed by MEME and MAST programs. A conserved motif is a sequence pattern that occurs repetitively in a group of related protein sequences. MEME represents motifs as position-dependent letter-probability matrices which describe the probability of each possible letter at each position in the pattern, and motifs in MAST are represented as position-dependent scoring matrices which describe the score of each possible letter at each position in the pattern. Based on the results, 10 conserved motifs of PEPCs were identified (, and ). As can be seen in and , motifs 1, 2, 4, and 5 were common in all 34 species.
Table 7. Discovered conserved motifs by MEME tool in 34 different species of C4 and CAM plants.
Figure 7. Discovered conserved motifs for PEPC proteins in C4 and CAM plants by MEME tool. The motifs are shown as different-colored boxes.
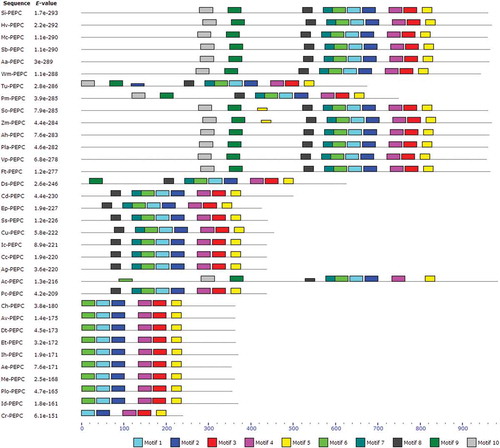
Figure 8. Sequence-specific MEME conserved motifs for PEPC proteins.
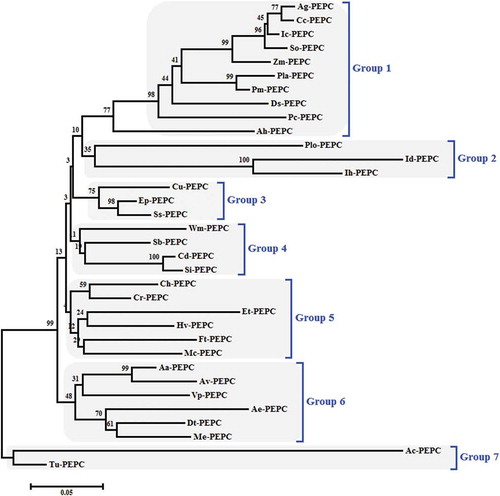
The multiple sequence alignment of PEPC proteins was performed with ClustalW algorithm implemented in MEGA 6.06 with default parameters. The phylogenetic tree was constructed using the NJ method and the bootstrap test carried out with 1000 replicates (). Based on the phylogenetic relationships, PEPCs were divided into seven groups, designated from Group 1 to Group 7.
Figure 9. Phylogenetic tree of PEPC proteins from 34 different species in C4 and CAM plants, using the ClustalW method (MEGA 6.06). The neighbor-joining (NJ) method was used to construct the tree. The percentage of 1000 bootstrap replicates was given at each node. Based on the phylogenetic tree result, 34 protein sequences of PEPC were defined, approximating seven major groups.
Discussion
PEPC is broadly distributed in all photosynthetic organisms including vascular plants, algae, cyanobacteria, photosynthetic bacteria, nonphotosynthetic bacteria and protozoa (Izui et al. Citation2004). PEPC activity produces malate and oxaloacetate which replenish the citric acid cycle or the so-called anaplerotic function, providing carbon skeletons for nitrogen assimilation (Huppe and Turpin Citation1994). In maize leaves, the addition of nitrate, ammonium, and glutamine promotes the activation of PEPC expression (Sugiharto and Sugiyama Citation1992; Sugiharto et al. Citation1992), lending support to the proposal that PEPC activity plays a significant role connecting carbon and nitrogen metabolism. Research on wheat seedlings showed that some abiotic stresses (monovalent cations, drought, cold, and hypoxia) induce expression of PEPC in their roots (González et al. Citation2003). These findings suggest that PEPC may play an important role in the adaptation of plants to environmental stress factors. In this study, bioinformatic methods were used to investigate the characteristics of PEPC in 34 species of 14 different families of C4 and CAM plants.
At first, a protein–protein interaction network was gathered to find which genes are possibly regulated by PEPC protein or pathway (, ). Genes involved in related biological pathways are usually expressed cooperatively for their functions, and thus information on their interaction is a key to understand the biological systems at the molecular level (Eisen et al. Citation1998). For this reason, Z. mays was selected as the representative of plants and examined by STRING 10 tool. As seen in , 10 functional partners were identified. Partners GRMZM2G375064_P01, GRMZM2G085078_P01 and Tac910.01 had the highest score (0.985), while partners GRMZM2G466833_P01, MDH, Pco143139c and Mdh2 had the lowest score (0.975). Other obtained partners in this analysis had scores between 0.984 and 0.978. Additionally, 10 pathways of KEGG, including “Carbon fixation in photosynthetic organisms”, “Pyruvate metabolism”, “Glyoxylate and dicarboxylate metabolism”, “Carbon metabolism”, “Microbial metabolism in diverse environments”, “Citrate cycle (TCA cycle)”, “Cysteine and methionine metabolism”, “Metabolic pathways”, “Biosynthesis of secondary metabolites” and “Nitrogen metabolism” were identified in the network analysis with their P-values.
The ProDom analysis was done in order to find functional domains in representative plants. In the initial survey of ProDom server 21, 18, 22, 24, 20, and 21 functional domains were found in Aloe arborescens, Ananas comosus, Amaranthus hypochondriacus, Flaveria trinervia, Vanilla planifolia, and Zea mays, respectively. It was found that there were 15 common functional domains among six representative plants (; ). These domains involve in some different activities such as phosphoenolpyruvate carboxylase activity, carbon fixation, lyase activity, and apoplast.
The primary structural analysis of 34 PEPC proteins revealed that Ac-PEPC and Vp-PEPC had the highest and the lowest molecular weights, respectively. In addition, the computed isoelectric point for PEPCs was between 5.77 and 6.07 (). Isoelectric point is a pH at which a protein carries no net charge. It is of importance in protein purification as it is the pH at which solubility is commonly minimal and mobility in an electrofocusing system is zero. Results of chemical modification studies on various plants’ PEPCs with group-selective reagents have recommended that Cys, His, Arg, and Lys are essential for the enzyme activity (Andreo et al. Citation1987; Stiborova Citation1988; Rajagopalan et al. Citation1994). The extinction coefficient indicates how much light a protein absorbs at a certain wavelength. It is useful to have an estimation of this coefficient for following a protein with a spectrophotometer when purifying it. Two values are produced by ProtParam, both for proteins measured in water at 280 nm. The first one shows the computed value based on the assumption that all cysteine residues appear as half cystines, and the second one assuming that no cysteine appears as half cystine. A protein whose instability index is smaller than 40 is predicted as stable, a value above 40 predicts that the protein may be unstable. The aliphatic index of a protein is defined as the relative volume occupied by aliphatic side chains (alanine, valine, isoleucine, and leucine). It may be regarded as a positive factor for the increase of thermostability of globular proteins. As shown in , the highest aliphatic index belonged to Vp-PEPC (92.75), while the lowest was observed in Ac-PEPC (85.04). As a result, high aliphatic index in PEPCs indicated structural stability. In the obtained values of GRAVY, only negative values were detected in all samples which show PEPC is a hydrophilic protein. The GRAVY value for a protein is calculated as the sum of hydropathy values of all the amino acids, divided by the number of residues in the sequence. In secondary structure analysis of 34 selected species, alpha helix had the highest percent (50.21–56.02%), while the lowest percent structure belonged to beta turn (7.83–8.97%) ().
Two servers including Predotar 1.03 and SignalP 4.1 were used in post-translational modification prediction (). Based on the results of Predotar server, none of the plant species were predicted to be targeted to mitochondria, plastid and endoplasmic reticulum. Also it was found that none of these species had signal peptide, subsequently PEPC is not a secretory protein. In addition, two other servers including TargetP 1.1 and TMHMM 2.0 were studied in topology prediction. Although previous studies proved the citric acid cycle occurs in the matrix of the mitochondrion in eukaryotic cells, in TargetP 1.1 analysis of this survey, none of the PEPCs were predicted to be targeted to chloroplast, mitochondrion or secretory pathway signal peptide. The cause of this contradiction is probably related to the protein sequence length in selected plants. Also, in TMhelix analysis, there were no transmembrane domains in PEPC proteins.
The 3D structure is the final goal of protein structure prediction and it is necessary to fully understand protein function. In this analysis, six selected species of PEPCs were estimated using “c1jqoA” model (PDB accession code: 1jqo), with 100% confidence (, ). Moreover, the values of TM-score were computed among six selected samples of C4 and CAM plants. According to the results of TM-score server, the lowest structural similarity of samples belonged to Ah-PEPC and Ft-PEPC whereas the highest one belonged to Vp-PEPC and Zm-PEPC (, ).
Also, PROCHECK and ProSA servers were used for evaluating tertiary structure. As displayed in ) the Ramachandran plot for Zm-PEPC indicated that 86.4% of the main-chain dihedral angles are found in the most-favored regions, 13.3% in the additionally allowed, while there is no residue found in the generously allowed and disallowed regions. In ProSA analysis, the plot of residue scores demonstrated local model quality by plotting energies as a function of amino acid sequence position. In general, positive values correspond to problematic or erroneous parts of the input structure. As presented in the graph of ), Zm-PEPC is mostly below zero on x-axis and on the basis of this graph, the modeled tertiary structure for Zm-PEPC can be constructed. Similarly, the Z-score of the template sequence (1jqo) is −14, which is highlighted as a large dot in ).
The MEME and MAST analyses of PEPC proteins were performed in order to find patterns of conserved motifs. As can be seen in and and , among 10 conserved motifs in 34 different species, only four motifs (1, 2, 4, and 5) were common in all species of PEPC proteins. The lack of these motifs in other plant proteins can be due to the differences of their sequence length.
PEPC is a useful molecular marker in phylogenetic studies of plant photosynthetic metabolism due to its extensive distribution in C4 and CAM plants (Gehrig et al. Citation1998a, Citation2001; Bläsing et al. Citation2000, Citation2002). The alignment analysis of all amino acid sequences available in 1994 and a phylogenetic tree construction by the NJ method exposed that these different PEPCs had evolved from the same ancestral origin and that the amino acid identities and similarities among them were more than 31% and 52%, respectively (Toh et al. Citation1994; Nakamura et al. Citation1995). The existence of PEPC in cyanobacteria suggested that the plant enzyme might have arisen from an endosymbiotic origin (Lepiniec et al. Citation1994). The identification of bacterial-type PEPC both in mono- and dicotyledoneous plants supports the prokaryotic origin of plant PEPCs (Sánchez and Cejudo Citation2003). In phylogenetic analysis among 34 PEPC proteins, seven main groups were categorized. Group 1 contained 10 members while Group 7 had two members; these constituted the largest and smallest groups, respectively. As it can be seen in phylogenetic tree, similar plant types (C4 or CAM) were not observed in all groups. All the Group 1 members were C4 plants while members of Groups 2, 6 and 7 were CAM plants. All the members of Group 3 and 5 were CAM but Cu-PEPC and Ft-PEPC, respectively. In Group 4 all members were C4 except Wm-PEPC.
Bioinformatics can play a vital role in the analysis and interpretation of genomic and proteomic data. It uses methods and technologies from mathematics, statistics, computer sciences, physics, biology, and medicine (Romano et al. Citation2011). Proteomics analyses generate huge amounts of data, expression information for hundreds or thousands of proteins in a single experiment (Wojcik and Schächter Citation2000). Therefore, data analysis (bioinformatics) is a vital part of some surveys. Currently proteomics and bioinformatics provide new insights into the processes in living cells and organisms (Darabi et al. Citation2012, Citation2017; Darabi and Farhadi-Nejad Citation2013; Seddigh and Darabi Citation2014, Citation2015, Citation2016, Citation2018; Darabi and Seddigh Citation2015, Citation2017). In this research, bioinformatic analyses of PEPCs in C4 and CAM plants exhibited similarities of this protein in different families and the obtained data provide a background of bioinformatic studies for the function and evolution of PEPC in plants.
Disclosure statement
No potential conflict of interest was reported by the authors.
References
- Altschul SF, Madden TL, Schäffer AA, Zhang J, Zhang Z, Miller W, Lipman DJ. 1997. Gapped BLAST and PSI-BLAST: a new generation of protein database search programs. Nucleic Acids Res. 25(17):3389–3402.
- Andreo CS, Gonzalez DH, Iglesias AA. 1987. Higher plant phosphoenolpyruvate carboxylase. FEBS Lett. 213(1):1–8.
- Bailey TL, Boden M, Buske FA, Frith M, Grant CE, Clementi L, Ren J, Li WW, Noble WS. 2009. MEME SUITE: tools for motif discovery and searching. Nucleic Acids Res. 37(Web Server issue):W202–208.
- Bailey TL, Gribskov M. 1998. Combining evidence using p-values: application to sequence homology searches. Bioinformatics. 14(1):48–54.
- Bläsing OE, Ernst K, Streubel M, Westhoff P, Svensson P. 2002. The non-photosynthetic phosphoenolpyruvate carboxylases of the C4 dicot Flaveria trinervia–implications for the evolution of C4 photosynthesis. Planta. 215(3):448–456.
- Bläsing OE, Westhoff P, Svensson P. 2000. Evolution of C4 phosphoenolpyruvate carboxylase inFlaveria, a conserved serine residue in the carboxyl-terminal part of the enzyme is a major determinant for C4-specific characteristics. J Biol Chem. 275(36):27917–27923.
- Brulfert J, Güclü S, Taybi T, Pierre J-N. 1993. Enzymatic responses to water-stress in detached leaves of the CAM plant Kalanchoe blossfeldiana Poelln. Plant Physiol Biochem. 31(4):491–497.
- Chen L-M, Li K-Z, Miwa T, Izui K. 2004. Overexpression of a cyanobacterial phosphoenolpyruvate carboxylase with diminished sensitivity to feedback inhibition in Arabidopsis changes amino acid metabolism. Planta. 219(3):440–449.
- Chollet R, Vidal J, O’Leary MH. 1996. Phospho enol pyruvate carboxylase: a ubiquitous, highly regulated enzyme in plants. Annu Rev Plant Biol. 47(1):273–298.
- Cushman JC, Bohnert HJ. 1999. Crassulacean acid metabolism: molecular genetics. Annu Rev Plant Biol. 50(1):305–332.
- Darabi M, Farhadi-Nejad H. 2013. Study of the 3-hydroxy-3-methylglotaryl-coenzyme A reductase (HMGR) protein in Rosaceae by bioinformatics tools. Caryologia. 66(4):351–359.
- Darabi M, Masoudi-Nejad A, Nemat-Zadeh G. 2012. Bioinformatics study of the 3-hydroxy-3-methylglotaryl-coenzyme A reductase (HMGR) gene in Gramineae. Mol Biol Rep. 39(9):8925–8935.
- Darabi M, Seddigh S. 2015. Bioinformatic characterization of aspartic protease (AP) enzyme in seed plants. Plant Syst Evol. 301(10):2399–2417.
- Darabi M, Seddigh S. 2017. Computational study of biochemical properties of ribulose-1, 5-bisphosphate carboxylase/oxygenase (RuBisCO) enzyme in C3 plants. J Plant Biol. 60(1):35–47.
- Darabi M, Seddigh S, Abarshahr M. 2017. Structural, functional, and phylogenetic studies of cytochrome P450 (CYP) enzyme in seed plants by bioinformatics tools. Caryologia. 70(1):62–76.
- Deroche ME, Carrayol E. 1988. Nodule phosphoenolpyruvate carboxylase: a review. Physiol Plant. 74(4):775–782.
- Dong L-Y, Masuda T, Kawamura T, Hata S, Izui K. 1998. Cloning, expression, and characterization of a root-form phosphoenolpyruvate carboxylase from Zea mays: comparison with the C4-form enzyme. Plant Physiol. 39(8):865–873.
- Eisen MB, Spellman PT, Brown PO, Botstein D. 1998. Cluster analysis and display of genome-wide expression patterns. Proc Natl Acad Sci. 95(25):14863–14868.
- Emanuelsson O, Nielsen H, Brunak S, von Heijne G. 2000. Predicting subcellular localization of proteins based on their N-terminal amino acid sequence. J Mol Biol. 300(4):1005–1016.
- Engelmann S, Bläsing OE, Westhoff P, Svensson P. 2002. Serine 774 and amino acids 296 to 437 comprise the major C4 determinants of the C4 phosphoenolpyruvate carboxylase of Flaveria trinervia. FEBS Lett. 524(1–3):11–14.
- Ernst K, Westhoff P. 1997. The phosphoenolpyruvate carboxylase (ppc) gene family of Flaveria trinervia (C4) and F. pringlei (C3): molecular characterization and expression analysis of the ppcB and ppcC genes. Plant Mol Biol. 34(3):427–443.
- Fujita N, Tetsuya M, Ishijima S, Katsura I, Katsuki H. 1984. The primary structure of phosphoenolpyruvate carboxylase of Escherichia coli. Nucleotide sequence of the ppc gene and deduced amino acid sequence. J Biochem. 95(4):909–916.
- Fumiaki K, Tsutomu K, Nobuyuki F, Katsura I, Hirohiko K. 1985. Nucleotide sequence of the phosphoenolpyruvate carboxylase gene of the cyanobacterium Anacystis nidulans. Gene. 38(1–3):265–269.
- Furbank RT, Taylor WC. 1995. Regulation of photosynthesis in C3 and C4 plants: a molecular approach. Plant Cell. 7(7):797.
- Gasteiger E, Hoogland C, Gattiker A, Wilkins MR, Appel RD, Bairoch A. 2005. Protein identification and analysis tools on the ExPASy server. In: Walker J.M. (eds). The proteomics protocols handbook. Humana Press; p. 571–607.
- Gehrig H, Faist K, Kluge M. 1998a. Identification of phosphoenolpyruvate carboxylase isoforms in leaf, stem and roots of the obligate CAM plant Vanilla planifolia Salib. (Orchidaceae): a physiological and molecular approach. Plant Mol Biol. 38(6):1215–1223.
- Gehrig H, Heute V, Kluge M. 2001. New partial sequences of phosphoenolpyruvate carboxylase as molecular phylogenetic markers. Mol Phylogen Evol. 20(2):262–274.
- Gehrig HH, Heute V, Kluge M. 1998b. Toward a better knowledge of the molecular evolution of phosphoenolpyruvate carboxylase by comparison of partial cDNA sequences. J Mol Evol. 46(1):107–114.
- Geourjon C, Deleage G. 1995. SOPMA: significant improvements in protein secondary structure prediction by consensus prediction from multiple alignments. Comput Appl Biosci. 11(6):681–684.
- González M-C, Sanchez R, Cejudo FJ. 2003. Abiotic stresses affecting water balance induce phosphoenolpyruvate carboxylase expression in roots of wheat seedlings. Planta. 216(6):985–992.
- Hartwell J, Gill A, Nimmo GA, Wilkins MB, Jenkins GI, Nimmo HG. 1999. Phosphoenolpyruvate carboxylase kinase is a novel protein kinase regulated at the level of expression. Plant J. 20(3):333–342.
- Hatch MD. 1987. C 4 photosynthesis: a unique elend of modified biochemistry, anatomy and ultrastructure. Biochim Et Biophys Acta (Bba)-Rev Bioenerg. 895(2):81–106.
- Hatch MD. 1992. C4 photosynthesis: an unlikely process full of surprises. Plant Physiol. 33(4):333–342.
- Häusler RE, Hirsch HJ, Kreuzaler F, Peterhänsel C. 2002. Overexpression of C4‐cycle enzymes in transgenic C3 plants: a biotechnological approach to improve C3‐photosynthesis J Exp Bot. 53(369):591–607.
- Höll W. 1973. Enzyme activities in wood tissue as affected by different methods of homogenizing. Holzforschung-Int J Biol Chem Phys Technol Wood. 27(5):145–146.
- Höll W. 1974. Dark CO2 fixation by cell-free preparations of the wood of Robinia pseudoacacia. Can J Bot. 52(4):727–734.
- Huppe H, Turpin D. 1994. Integration of carbon and nitrogen metabolism in plant and algal cells. Annu Rev Plant Biol. 45(1):577–607.
- Ivanov AG, Krol M, Sveshnikov D, Malmberg G, Gardeström P, Hurry V, Öquist G, Huner NP. 2006. Characterization of the photosynthetic apparatus in cortical bark chlorenchyma of Scots pine. Planta. 223(6):1165–1177.
- Izui K, Ishijima S, Yamaguchi Y, Katagiri F, Murata T, Shigesada K, Sugiyama T, Katsuki H. 1986. Cloning and sequence analysis of cDNA encoding active phosphoenolpyruvate carboxylase of the C4-pathway from maize. Nucleic Acids Res. 14(4):1615–1628.
- Izui K,Matsumura H, Furumoto T, Kai Y. 2004. Phospho enol pyruvate carboxylase: a new era of structural biology. Annu Rev Plant Biol. 55:69–84.
- Jefferys BR, Kelley LA, Sternberg MJ. 2010. Protein folding requires crowd control in a simulated cell. J Mol Biol. 397(5):1329–1338.
- Kai Y, Matsumura H, Inoue T, Terada K, Nagara Y, Yoshinaga T, Kihara A, Tsumura K, Izui K. 1999. Three-dimensional structure of phosphoenolpyruvate carboxylase: a proposed mechanism for allosteric inhibition. Proc Natl Acad Sci. 96(3):823–828.
- Kai Y, Matsumura H, Izui K. 2003. Phosphoenolpyruvate carboxylase: three-dimensional structure and molecular mechanisms. Arch Biochem Biophys. 414(2):170–179.
- Kawamura T, Shigesada K, Yanagisawa S, Izui K. 1990. Phosphoenolpyruvate carboxylase prevalent in maize roots: isolation of a cDNA clone and its use for analyses of the gene and gene expression. J Biochem. 107(1):165–168.
- Kelley LA, Sternberg MJ. 2009. Protein structure prediction on the Web: a case study using the Phyre server. Nat Protoc. 4(3):363–371.
- Kogami H, Shono M, Koike T, Yanagisawa S, Izui K, Sentoku N, Tanifuji S, Uchimiya H, Toki S. 1994. Molecular and physiological evaluation of transgenic tobacco plants expressing a maize phosphoenolpyruvate carboxylase gene under the control of the cauliflower mosaic virus 35S promoter. Transgenic Res. 3(5):287–296.
- Ku MS, Agarie S, Nomura M, Fukayama H, Tsuchida H, Ono K, Hirose S, Toki S, Miyao M, Matsuoka M. 1999. High-level expression of maize phosphoenolpyruvate carboxylase in transgenic rice plants. Nat Biotechnol. 17(1):76–80.
- Laskowski RA, MacArthur MW, Moss DS, Thornton JM. 1993. PROCHECK: a program to check the stereochemical quality of protein structures. J Appl Crystallogr. 26(2):283–291.
- Latzko E, Kelly G. 1983. The many-faceted function of phosphoenolpyruvate carboxylase in C3 plants [review]. Physiologie Végétale. 21:805–815.
- Leegood RC, Osmond CB. 1990. The flux of metabolites in C4 and CAM plants. Plant physiology, biochemistry and molecular biology, 274–298.
- Lepiniec L, Keryer E, Philippe H, Gadal P, Crétin C. 1993. Sorghum phosphoenolpyruvate carboxylase gene family: structure, function and molecular evolution. Plant Mol Biol. 21(3):487–502.
- Lepiniec L, Vidal J, Chollet R, Gadal P, Crétin C. 1994. Phosphoenolpyruvate carboxylase: structure, regulation and evolution. Plant Sci. 99(2):111–124.
- Maiti R, Van Domselaar GH, Zhang H, Wishart DS. 2004. SuperPose: a simple server for sophisticated structural superposition. Nucleic Acids Res. 32(suppl 2):W590–W594.
- Moller S, Croning MD, Apweiler R. 2001. Evaluation of methods for the prediction of membrane spanning regions. Bioinformatics. 17(7):646–653.
- Morris AL, MacArthur MW, Hutchinson EG, Thornton JM. 1992. Stereochemical quality of protein structure coordinates. Proteins: Structure, Function, and Bioinformatics. 12(4):345–364.
- Nakamura T, Yoshioka I, Takahashi M, Toh H, Izui K. 1995. Cloning and sequence analysis of the gene for phosphoenolpyruvate carboxylase from an extreme thermophile, Thermus sp. J Biochem. 118(2):319–324.
- O’Leary MH. 1982. Phosphoenolpyruvate carboxylase: an enzymologist’s view. Annu Rev Plant Physiol. 33(1):297–315.
- O'Leary B, Park J, Plaxton WC. 2011. The remarkable diversity of plant pepc (phosphoenolpyruvate carboxylase): recent insights into the physiological functions and post-translational controls of non-photosynthetic pepcs. Biochem J. 436(1):15–34.
- Outlaw WH. 1990. Kinetic properties of guard-cell phosphoenolpyruvate carboxylase. Biochemie und Physiologie der Pflanzen. 186(5):317–325.
- Papini A, Nicosia G, Stracquadanio G, Lio P, Umeton R. 2010. Key Enzymes for the optimization of CO2 uptake and nitrogen consumption in the C3 photosynthetic carbon metabolism. J Biotechnol. 150:525–526.
- Petersen TN, Brunak S, von Heijne G, Nielsen H. 2011. SignalP 4.0: discriminating signal peptides from transmembrane regions. Nat Methods. 8(10):785–786.
- Rademacher T, Häusler RE, Hirsch HJ, Zhang L, Lipka V, Weier D, Kreuzaler F, Peterhänsel C. 2002. An engineered phosphoenolpyruvate carboxylase redirects carbon and nitrogen flow in transgenic potato plants. Plant J. 32(1):25–39.
- Rajagopalan A, Devi MT, Raghavendra A. 1994. Molecular biology of C4 phosphoenolpyruvate carboxylase: structure, regulation and genetic engineering. Photosynthesis Res. 39(2):115–135.
- Romano P, Giugno R, Pulvirenti A. 2011. Tools and collaborative environments for bioinformatics research. Brief Bioinform. 12(6):549–561.
- Sako Y, Takai K, Uchida A, Ishida Y. 1996. Purification and characterization of phosphoenolpyruvate carboxylase from the hyperthermophilic archaeon Methanothermus sociabilis. FEBS Lett. 392(2):148–152.
- Sánchez R, Cejudo FJ. 2003. Identification and expression analysis of a gene encoding a bacterial-type phosphoenolpyruvate carboxylase from Arabidopsis and rice. Plant Physiol. 132(2):949–957.
- Schmitt J. 1990. Rapid concentration changes of phosphoenolpyruvate carboxylase mRNA in detached leaves of Mesembryanthemum crystallinum L. in response to wilting and rehydration. Plant, Cell Environ. 13(8):845–850.
- Seddigh S, Darabi M. 2014. Comprehensive analysis of beta-galactosidase protein in plants based on Arabidopsis thaliana. Turkish J Biol. 38(1):140–150.
- Seddigh S, Darabi M. 2015. Structural and phylogenetic analysis of α-glucosidase protein in insects. Biologia. 70(6):812–825.
- Seddigh S, Darabi M. 2016. Proteomics comparison of aspartic protease enzyme in insects. Turkish J Biol. 40(1):69–83.
- Seddigh S, Darabi M. 2018. Functional, structural, and phylogenetic analysis of mitochondrial cytochrome b (cytb) in insects. Mitochondrial DNA Part A. 29(2):236–249.
- Sippl MJ. 1993. Recognition of errors in three‐dimensional structures of proteins. Proteins: Structure, Function, and Bioinformatics. 17(4):355–362.
- Söding J. 2005. Protein homology detection by HMM–HMM comparison. Bioinformatics. 21(7):951–960.
- Stiborova M. 1988. Phosphoenolpyruvate carboxylase: the key enzyme of C4-photosynthetis. Photosynthetica. 22(2):240–263.
- Stracquadanio G, Umeton R, Papini A, Lio P, Nicosia G. 2010. Analysis and optimization of C3 photosynthetic carbon metabolism. BioInformatics and BioEngineering (BIBE), 2010 IEEE International Conference on pp. 44-51, IEEE.
- Sugiharto B, Sugiyama T. 1992. Effects of nitrate and ammonium on gene expression of phosphoenolpyruvate carboxylase and nitrogen metabolism in maize leaf tissue during recovery from nitrogen stress. Plant Physiol. 98(4):1403–1408.
- Sugiharto B, Suzuki I, Burnell JN, Sugiyama T. 1992. Glutamine induces the N-dependent accumulation of mRNAs encoding phosphoenolpyruvate carboxylase and carbonic anhydrase in detached maize leaf tissue. Plant Physiol. 100(4):2066–2070.
- Szklarczyk D, Franceschini A, Wyder S, Forslund K, Heller D, Huerta-Cepas J, Simonovic M, Roth A, Santos A, Tsafou KP. et al. 2014. STRING v10: protein–protein interaction networks, integrated over the tree of life. Nucleic Acids Res. 43(D1):D447–D452.
- Tamura K, Stecher G, Peterson D, Filipski A, Kumar S. 2013. MEGA6: molecular evolutionary genetics analysis version 6.0. Mol Biol Evol. 30(12):2725–2729.
- Taybi T, Sotta B, Gehrig H, Güclü S, Kluge M, Brulfert J. 1995. Differential effects of abscisic acid on phosphoenolpyruvate carboxylase and CAM operation in Kalanchoë blossfeldiana. Botanica Acta. 108(3):240–246.
- Toh H, Kawamura T, Izui K. 1994. Molecular evolution of phosphoeno/pyruvate carboxylase. Plant, Cell Environ. 17(1):31–43.
- Vance CP, Gregerson RG, Robinson DL, Miller SS, Gantt JS. 1994. Primary assimilation of nitrogen in alfalfa nodules: molecular features of the enzymes involved. Plant Sci. 101(1):51–64.
- Vidal J, Chollet R. 1997. Regulatory phosphorylation of C 4 PEP carboxylase. Trends Plant Sci. 2(6):230–237.
- Wiederstein M, Sippl MJ. 2007. ProSA-web: interactive web service for the recognition of errors in three-dimensional structures of proteins. Nucleic Acids Res. 35(suppl 2):W407–W410.
- Wojcik J, Schächter V. 2000. Proteomic databases and software on the web. Brief Bioinform. 1(3):250–259.
- Xu J, Zhang Y. 2010. How significant is a protein structure similarity with TM-score= 0.5? Bioinformatics. 26(7):889–895.
- Yanagisawa S, Izui K, Yamaguchi Y, Shigesada K, Katsuki H. 1988. Further analysis of cDNA clones for maize phosphoenolpyruvate carboxylase involved in C4 photosynthesis Nucleotide sequence of entire open reading frame and evidence for polyadenylation of mRNA at multiple sites in vivo. FEBS Lett. 229(1):107–110.
- Zhang Y, Skolnick J. 2004. Scoring function for automated assessment of protein structure template quality. Proteins. 57(4):702–710.