
ABSTRACT
The response of three flames with different degrees of premixedness (fully premixed, non-premixed with radial, and non-premixed with axial fuel injection) to acoustic oscillations is studied experimentally. The flames were imaged using OH* chemiluminescence and OH planar laser-induced fluorescence at 5 kHz. In addition to a flame kinematics analysis, the amplitude dependence of the transfer function was calculated. The dominant spatial structures of the heat release and their periodicity were examined using the proper orthogonal decomposition (POD) method. The Non-Premixed system with Radial fuel injection (NPR) showed the highest response to acoustic forcing, followed by the fully premixed and the Non-Premixed system with Axial fuel injection (NPA). In addition, the response of the non-premixed system with radial fuel injection was greater than that of the fully premixed system for various bulk velocities , global equivalence ratios
, forcing amplitudes
, and forcing frequencies
. In the fully premixed system, the heat release modulation was mainly through flame surface area modulation, while in the NPR system, both the flame area and the equivalence ratio modulations were found to be important mechanisms of the heat release oscillations. About 70% of the energy of the total fluctuations in the NPR case was contained in the first four POD modes, a percentage that decreased with overall equivalence ratio, but only this dropped to about 40% for the NPA flame. The frequency spectra of the coefficients of the POD modes exhibited peaks at the forcing frequency, with increasing broadband contributions in higher modes and for the NPA flame.
Introduction
Combustion instabilities constitute a major challenge for the development of modern gas turbines, not only because they are associated with the generation of unsteady combustion, but also because they lead to considerable system degradation. In the search for the optimization of efficiency and longevity of gas turbines, several different operational modes have been employed to date. Lean flames present the advantage of reduced fuel consumption and NOx production; however, they are susceptible to combustion instabilities (Candel, Citation2002). The accurate prediction of the flame response is difficult because the heat release fluctuation is affected by many parameters. Various driving mechanisms of instabilities have been suggested and most importantly the flame–vortex interactions, equivalence ratio and velocity oscillations, and flame area fluctuations (Zinn and Lieuwen, Citation2006). Advanced diagnostic techniques (Balachandran et al., Citation2005; Lee and Santavicca, Citation2003) and computational methods (Armitage et al., Citation2006; Poinsot et al., Citation1995) contribute to the improved understanding of the various underlying mechanisms involved in combustion dynamics. Apart from the conventional analysis of OH* chemiluminescence and OH planar laser-induced fluorescence (OH PLIF) imaging, the proper orthogonal decomposition (POD) method has been used to extract coherent structures of the flame (Berkooz et al., Citation1993) and has been a useful tool in providing important insights into the most dominant underlying mechanisms of the flame response (Denisov and Ravi, Citation2015).
In the past, experimental studies have focused mainly on the response of lean, fully premixed in space and in time, gas-fueled turbulent flames to acoustic oscillations (Balachandran et al., Citation2005; Bellows et al., Citation2007; Kim et al., Citation2010a; Schimek et al., Citation2011). It was shown that the interaction of the flame with vortices caused by the oscillating flow constitutes an important mechanism of nonlinear response. Apart from turbulent premixed flames, the flow–flame interaction was studied extensively in the case of laminar premixed flames, which resulted in the development of many theoretical models to accurately define the flame response (Candel, Citation2002; Ducruix et al., Citation2000; Schuller et al., Citation2003).
In gas turbines, fuel is injected and mixed shortly before it impinges on the flame front, and as a result, the velocity and equivalence ratio fluctuations may be coupled. Acoustically forced fully premixed flames experience only velocity oscillation (Balachandran et al., Citation2005; Bellows et al., Citation2007; Kim et al., Citation2010a; Schimek et al., Citation2011) because the mixture is always and everywhere the same. If the fuel injection system is such that the fuel flow rate is constant and its location is far enough upstream to produce uniform equivalence ratio across the mixing duct, a slowly time-varying velocity field will result also in a slowly varying equivalence ratio associated with the constant fuel flow rate and the unsteady air flow rate (Balachandran, Citation2005; Balachandran et al., Citation2011). The term “imperfectly premixed” may be used to describe this situation. With fast velocity oscillations, and equivalent short wavelength equivalence ratio fluctuations, uniform mixing may be achieved by the time the mixture reaches the flame. If the fuel injection system additionally undergoes flow rate oscillations, or if its location is close enough to the flame so that the equivalence ratio has both temporal and spatial fluctuations (equivalence ratio changing in space at the scale of the flame), then the response of the flame may be very different (Arndt et al., Citation2015; Han et al., Citation2015; Kim et al., Citation2010c; Kypraiou et al., Citation2016). The amplitude of the equivalence ratio, or mixture fraction, fluctuations is an important mechanism of nonlinear response, because it affects the nonlinear dependence of the heat release rate on the equivalence ratio (Kim et al., Citation2010b). Spatially resolved transfer functions of forced stratified flames (the term “stratified” implying equivalence ratio fluctuations within the nominal flammability limits of premixed flame propagation), estimated from high-speed chemiluminescence images, suggested that the location and magnitude of the fluctuation along the flame branches were affected by the stratification ratio (Han et al., Citation2015). An experimental analysis of thermoacoustic instabilities in a gas turbine model combustor by Arndt et al. (Citation2015) revealed that the thermoacoustic oscillations were accompanied by phase-dependent variations in the mixture fraction and the fuel mole fraction in the inflowing jet and in the low part of the inner recirculation zone (IRZ), while small variations were observed on the upper side of the IRZ and outer recirculation zone (ORZ).
A direct comparison of the response of flames with different levels of premixedness is not easy based on the literature, as the various studies have used different geometries and since the geometry affects the flame dynamics significantly. Understanding the response of a flame with different degrees of premixing using the same burner configuration can contribute to the development of reliable flame response models and lean-burn devices.
In this work, the response of three flames with different degrees of premixedness (i.e., different mixture fraction patterns) to acoustic oscillations has been experimentally investigated. In particular, the same burner configuration was used, varying only the fuel injection strategy for the study of a fully premixed flame, a non-premixed flame with radial fuel injection, and a non-premixed flame with axial fuel injection. The specific objectives are (1) to study the global heat release response and understand the response and behavior of the local flame structure, (2) to estimate and compare the amplitude dependence of the flame transfer functions, and (3) to characterize the dominant structures of the flame and their periodicity using the POD method.
Experimental methods
The experimental apparatus used for the study of forced (1) fully premixed (P), (2) non-premixed with radial fuel injection (NPR), and (3) non-premixed with axial fuel injection (NPA) methane flames is depicted in . The burner consisted of two long concentric circular ducts. The outer duct (i.d. = 37 mm) housed two pressure taps (axial distance = 200 mm), where pressure transducers were mounted flush with the duct internal wall for acoustic pressure measurements. At the exit of the inner duct (i.d. = 6 mm), a conical bluff body of diameter 25 mm was used and a 60-deg vane angle swirler was located 41.6 mm upstream of the bluff body plane. In order to perturb the flame, acoustic oscillations were imposed to the air mass flow by means of two loudspeakers, which were fitted upstream of the outer duct. The flames were forced at 160 and 280 Hz, which were the most dominant resonant frequencies of the burner (Balachandran, Citation2005).
Figure 1. Schematic of the burner used for the study of forced fully premixed (a), NPR (b), and NPA (c) flames.
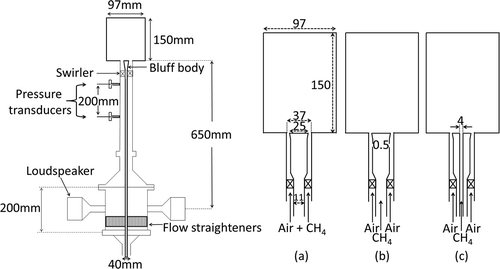
The main difference between the P, NPR, and NPA systems is the fuel injection point, resulting in flames with a different degree of premixedness. In particular, in the P system, air and methane were mixed about 1 m upstream of the burner entrance to ensure a fully premixed mixture (i.e., no temporal or spatial variation in equivalence ratio) at the bluff body plane ()). In the NPR system, the fuel was injected radially through a 0.5 ± 0.01-mm circular gap 3 mm upstream of the bluff body plane ()). In this system, apart from the time-varying velocity field, there was also a time- and space-varying equivalence ratio (also the fuel flow could in principle oscillate, since the annular gap at the injection point was not choked). In the NPA system, the bluff body design was modified so that a central pipe of diameter of 4 mm fed the methane ()). In this system, again, there were time- and space-varying equivalence ratio oscillations, but it is expected that the span of mixture fraction fluctuations at the flame is larger than in the NPR system. Hence, we could argue that the P system produces a conventional fully premixed swirl flame, the NPA system a conventional non-premixed swirl flame, and the NPR system is nominally non-premixed, but there is quick mixing before the flame (i.e., across the duct and during 3 mm before the bluff body corner and up to the occasional lift-off height of the flame) so that the base of the flame may resemble the stabilization point of a lifted jet diffusion flame and the rest of the flame to resemble a stratified premixed flame. Mixture fraction measurements are needed to fully characterize the NPR and NPA systems, but they will be attempted in future work. The operating conditions are presented in together with the acronyms that will be used in the remainder of this paper to indicate each condition. The air velocity was calculated as the air flow rate divided by the open annular area between the bluff-body and the outer duct at the exit of the burner, while the fuel velocity was calculated as the fuel flow rate divided by the area of the fuel nozzle exit.
Two Kulite pressure transducers (Model XCQ-093) were used. OH chemiluminescence measurements were conducted using: (a) full planar view high-speed imaging system at 5 kHz for 1 s (within the pressure measurement period), and (b) a photo-multiplier tube (Thorlabs PMT, Model PMM01). Also, OH PLIF measurements were acquired at 5 kHz, for 1 s. Further details of the imaging systems can be found in a previous study (Kypraiou et al., Citation2016). The PMT measurements were recorded simultaneously with the pressure measurements. Experimental data were recorded with a National Instruments data acquisition system controlled by the Labview software program at a sampling frequency of 10 kHz.
Time series of acoustic pressure, OH chemiluminescence from the PMT, and reference signal were acquired simultaneously and were analyzed spectrally using the fast Fourier transform technique. From the OH
chemiluminescence power spectrum, the complex amplitude of the quantity OH
′ at the forcing frequency f was determined and then normalized using the time-averaged value of OH
to obtain
, which was used as an estimate of
. This factor together with the ratio
determined from the simultaneous pressure measurements using the two-microphone method were used to calculate the nonlinear flame transfer function:
The flame surface density (FSD) was estimated using the corrected OH PLIF instantaneous images, following a similar procedure with that described by Balachandran et al. (Citation2005). In particular, the images were filtered with a Gaussian filter of a width of 3 pixels to remove high-frequency noise, and then, they were converted into binary images using an intensity thresholding algorithm. Binary values were assigned to the progress variable, which was defined such that it took a value of 0 in fresh reactants and a value of 1 in burnt gases. Also, the magnitude of the 2D gradient of the progress variable was calculated and the instantaneous flame edge contour was obtained using a threshold on the gradient. The FSD was calculated following a similar approach with others (Balachandran et al., Citation2005; Veynante et al., Citation1994; Worth and Dawson, Citation2012), using an interrogation window of 5 × 5 pixels. In addition, phase-averaged FSD images were calculated at every 15-deg phase angle, which were then revolved around the central axis of the burner to obtain the cyclic FSD variation. This quantity was compared with the cyclic OH* chemiluminescence variation based on a 40-mm window (40 mm is the height of the OH PLIF laser sheet). The FSD results could be used as a surrogate of the heat release for fully premixed flames (Balachandran et al., Citation2005), whereas they were used only as an indicator of flame area for the non-premixed system with radial fuel injection.
The POD method is a spatio-temporal statistical method used to extract the most dominant spatial features of the system (POD modes) and the respective frequency content (Power Spectral Density (PSD) of the POD time coefficients). The OH* chemiluminescence images were analyzed using the POD method, as described in previous studies (Ayache and Mastorakos, Citation2013; Berkooz et al., Citation1993) based on the Sirovich’s method of snapshots (Sirovich, Citation1987). The POD method applied in this system has been presented previously (Kypraiou et al., Citation2015). Since the results of the POD analysis for the studied datasets begin to converge after 500 snapshots, the POD method was applied to 1000 snapshots in order to achieve a good statistical representation.
Results and discussion
Flame kinematics
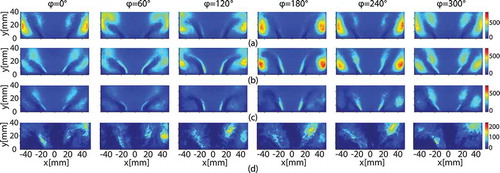
For flames P-15-070-160-30, NPR-15-070-160-30, and NPR-15-055-160-30, a change in the flame shape is observed, and in particular, a downstream motion of the heat release zone during the cycle, with the main heat release being concentrated close to the wall (). The OH PLIF images reveal that the flame impinges on the wall, while a change in the angle of the flame can be observed (). The main difference between flames P-15-070-160-30 and NPR-15-070-160-30 is that for the former, the reaction zone is stronger in the downstream region and close to the wall than in the inner shear layer (ISL) region, while for the latter flame, the reaction zone in the ISL region is very strong. However, in case of NPA-15-042-160-30, a reduced modulation in the flame shape and a less pronounced wall impingement are exhibited compared with the aforementioned conditions.
Figure 2. Phase-averaged OH* chemiluminescence image sequence of flames P-15-070-160-30 (a), NPR-15-070-160-30 (b), NPR-15-055-160-30 (c), and NPA-15-042-160-30 (d).
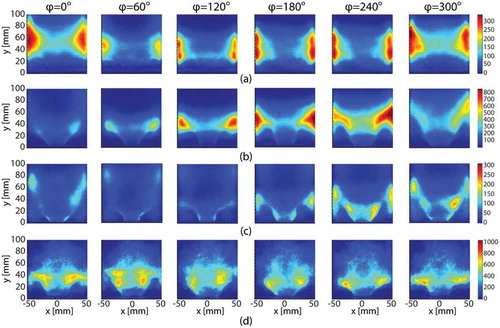
Figure 3. Phase-averaged OH PLIF image sequence of flames P-15-070-160-30 (a), NPR-15-070-160-30 (b), NPR-15-055-160-30 (c), and NPA-15-042-160-30 (d).
In order to probe which part of the flame responds at the forcing frequency and which does not, and to help understand the regions that are most sensitive to the forcing frequency, the ratio was defined as the OH fluctuation contribution at 160 ± 3 Hz to the total variance at each pixel:
, where
This quantity, which varies between 0 and unity, provides a measure of the energy contained at the forcing frequency relative to the total energy of the fluctuations, as a function of space. To reduce the computational demand, each OH PLIF image of a 5000-image dataset was divided into m = 100 × 100 groups of n × n pixels each, with n = 10.
For flames P-15-070-160-30, NPR-15-070-160-30, and NPR-15-055-160-30, the variance, and thus the level of OH fluctuations associated with the whole frequency range, is the greatest in the near wall region, unlike flame NPA-15-042-160-30, where the highest values of the variance are found in the ISL region (). This difference is explained by the fact that in the latter flame, the impingement on the wall is less pronounced compared to the other flames. The proportion of OH fluctuations at 160 Hz versus the overall fluctuations, , is greater in the ISL region than in the other regions for flames NPR-15-070-160-30, NPR-15-055-160-30, and NPA-15-042-160-30, whereas for flame P-15-070-160-30, these values are greater in large regions on the downstream side of the OH PLIF plane than those in the ISL region close to the bluff body plane (). Flame NPA-15-042-160-30 shows that in the region downstream of the fuel injection point,
is negligible. The comparison between suggests that
in the ORZ region is relatively high in flame NPR-15-070-160-30, unlike flame NPR-15-055-160-30, due to the penetration of unburnt reactants in the ORZ in the case of the higher overall
.
Figure 4. Image 1: variance of OH; Image 2: ratio (OH fluctuation at 160 Hz to the total variance of OH), for flames (a) P-15-070-160-30, (b) NPR-15-070-160-30, (c) NPR-15-055-160-30, and (d) NPA-15-042-160-30.
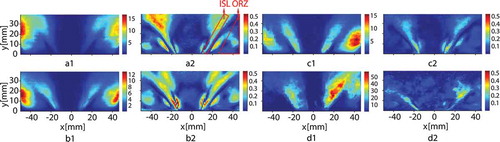
Comparing flames P-15-070-160-30 () and NPR-15-070-160-30 (), the most striking difference is seen in the ISL region downstream of the annular passage, between the bluff body plane and 15 mm downstream. In particular, at this zone, is significantly greater in case of NPR-15-070-160-30 than that of P-15-070-160-30. This is attributed to the equivalence ratio modulation through the cycle, since as mentioned above, the fuel injection point constitutes the main factor that differentiates these systems. In the NPR system, the greater values of the proportion of OH fluctuations at 160 Hz over the total fluctuations are concentrated in the shear layer zones, mainly closer to the bluff body plane. In contrast, in the premixed flame, even though the acoustic oscillations are greater at the burner exit than further downstream, the values of
are greater in large regions on the downstream side of the OH PLIF plane than those in the ISL region. In the P-15-070-160-30 system, high values of
are also seen in the IRZ and ORZ regions. The above could probably be explained by the fact that for P-15-070-160-30, the reaction zone is stronger in the downstream region and close to the wall than in the ISL region, while for NPR-15-070-160-30, the reaction zone in the ISL region is very strong, as explained previously.
shows some similar patterns, the most prominent being the regions with ≠ 0 adjacent to both sides of the ISL zone. The phase-averaged OH PLIF images () indicate that these zero-value regions constitute the extremes on either side of the flame angle variation region, between which the flame angle is modulated during the cycle. In addition, the high
regions, observed adjacent to the zero-value locations, might be associated with the penetration of unburnt reactants to the IRZ and ORZs. The above pattern is also revealed in the second OH PLIF POD mode of flames P-15-070-160-30 and NPR-15-070-160-30 (not presented here), implying that the respective characteristics that it represents constitute one of the most dominant mechanisms of the flame dynamics of both systems.
Nonlinear flame transfer functions
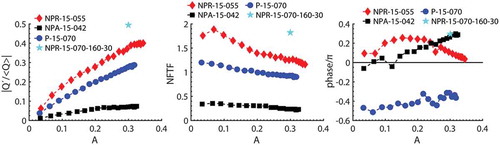
Following the previous analysis on the dynamics at a specific forcing amplitude (), the overall flame response as a function of forcing amplitude is presented in this section. shows the dependence of
on the forcing amplitude
, at a forcing frequency of 160 Hz, for flames P-15-070-160-30, NPR-15-055-160-30, and NPA-15-042-160-30. The respective data for flame NPR-15-070-160-30 were not available; however, the flame response at
is indicated. also plots the magnitude of the transfer function, and the corresponding phase information. Flame NPA-15-042-160-30 shows the lowest response to acoustic forcing, followed by P-15-070-160-30, NPR-15-055-160-30, and NPR-15-070-160-30, which exhibits a significantly greater response. The results suggest that the general trend is that at low forcing amplitudes,
increases linearly with
, and with a further increase in
, the heat release response continues to rise at a reduced rate until it starts saturating at higher amplitudes. The maximum
value observed in case of P-15-070-160-30, NPR-15-055-160-30, and NPA-15-042-160-30 is 29%, 37%, and 0.07%, respectively. The transfer functions show a nonlinear amplitude dependence and, in particular, a gradual decrease with
until they level off. The transfer function phase reveals a small dependence on the forcing amplitude.
Figure 5. Left: normalized global heat release fluctuations of flames P-15-070, NPR-15-070, NPR-15-055, and NPA-15-042, measured as a function of using OH* chemiluminescence; middle: the corresponding transfer function; and right: phase.
The influence of global equivalence ratio on the flame response of the NPR system is significant. In particular, the cyclic OH chemiluminescence variation between flames NPR-15-055-160-30 and NPR-15-070-160-30 is compared in . The figure suggests that the peak-to-peak variation between the trough and the peak value of the heat release cycle is greater for flame NPR-15-070-160-30 than that of NPR-15-055-160-30. In fact,
is 49% and 37% for the former and the latter flame, respectively. In case of NPR-15-070-160-30, which is farther from blow-off than NPR-15-055-160-30, the OH* chemiluminescence snapshots (not presented here) demonstrated an oscillatory flame motion without any evidence of isolated flame regions. However, in case of NPR-15-055-160-30, flame flapping and isolated OH
pockets were observed. Thus, the reduced flame response in case of the lower
could probably be associated with the observed difference in the flame dynamics.
Figure 6. Comparison of the normalized global heat release variation evaluated from OH* chemiluminescence images for flames NPR-15-055-160-30 and NPR-15-070-160-30.
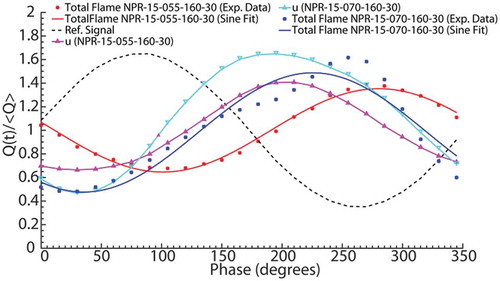
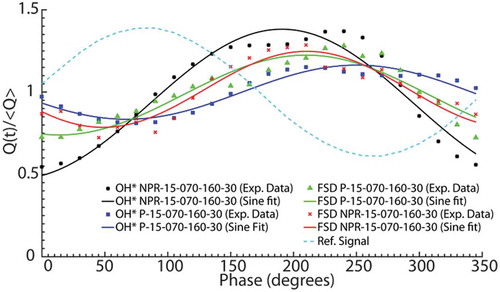
For flame P-15-070-160-30, the phase-averaged OH* chemiluminescence variation agrees relatively well with the FSD variation, with a small difference in amplitude and phase (). This probably suggests that in the fully premixed system, the heat release modulation is mainly through flame surface area modulation. It should be noted that the slight difference in the phase and amplitude between the FSD and OH chemiluminescence for P-15-070-160-30 might also be attributed to increased wrinkling in the third dimension, due to the presence of the strong swirl. A good agreement between the OH
and FSD variation was also reported by Balachandran et al. (Citation2005) in the study of forced premixed ethylene flames. The cyclic FSD variation of NPR-15-070-160-30 and P-15-070-160-30 is very similar in amplitude and phase, with the maximum value revealed at around 200 deg (). Also, in both conditions, the cyclic flame angle variation (not presented here) was almost in antiphase with the FSD variation, with the minimum angle exhibited at approximately 200 deg. The agreement between the FSD variation of both flames implies that the flame area modulation mechanism and how it is influenced by the change in the flame angle are common in both the premixed and NPR systems. Since both systems have a similar geometry and, hence, almost identical aerodynamic profiles, it could be speculated that the flame area modulation is mainly dependent on the time-varying velocity field, while the effect of equivalence ratio fluctuations on the flame area seems to be of smaller importance. For NPR-15-070-160-30, the cyclic OH* chemiluminescence variation shows a similar phase, but a greater magnitude than the respective FSD variation. This difference in magnitude may be attributed mainly to the equivalence ratio fluctuations constituting an important mechanism of the NPR system. The similar phase suggests that this contribution of the equivalence ratio fluctuations to the heat release modulation is mainly in the magnitude and less in phase. Therefore, from the above analysis, it can be conjectured that in the NPR system, both the flame area and the equivalence ratio modulations constitute important mechanisms of the heat release modulations.
Figure 7. Comparison of the cyclic FSD variation, evaluated from the phase-averaged FSD images, revolved around the burner central axis, and the cyclic OH* chemiluminescence variation both based on a 40-mm window for NPR-15-070-160-30 and P-15-070-160-30.
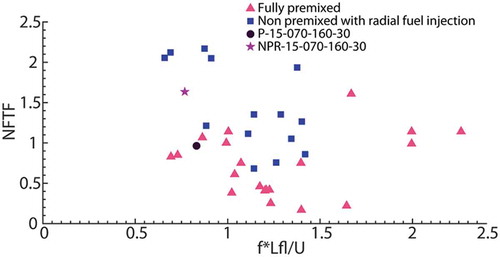
In , the transfer function is plotted with respect to the non-dimensional frequency for the fully premixed and NPR systems. In particular, the frequency of forcing was normalized with the convection time, estimated by dividing the length of the flame,
, with the bulk velocity,
. The flame length was defined as the distance between the edge of the bluff body and the highest position of the flame based on the time-averaged OH
chemiluminescence intensity. The flame boundary was determined using a threshold value which was chosen to separate flame regions from the background noise of the image. A flame whose length is much smaller than an acoustic/convective wavelength is referred to as acoustically/convectively compact (Lieuwen, Citation2012). The experimental conditions used for this estimation have different bulk velocities,
(
m/s), global equivalence ratios
(fully premixed:
, NPR:
), forcing frequencies
(160 or 280 Hz), and forcing amplitudes
(
). The figure suggests that the response of the NPR system was greater than that of the fully premixed system in the whole range of
. The close-to-zero values are attributed to the fact that close to blow-off, the flame response is significantly reduced compared with that farther from blow-off. These results are consistent with the findings of a previous study on forced fully premixed and imperfectly premixed forced ethylene flames (Balachandran et al., Citation2011), which also suggested that the response of imperfectly premixed flames was greater than that of fully premixed flames, but only when the flame was compact (
< 1). However, for
≥ 1, the fully premixed and imperfectly premixed flames exhibited a similar response.
Figure 8. Transfer function plotted with respect to for the fully premixed and NPR systems.
POD analysis
In , the cumulative POD energy distribution of the first 200 POD modes is plotted for the studied forced and unforced flames. For all conditions, the cumulative energy of the forced flame is greater than that of the respective unforced condition, while their energy difference becomes smaller at higher modes. The cumulative energy content of the first four POD modes is the greatest for flame NPR-15-070-160-30 (73% of the total POD energy), followed by P-15-070-160-30 (63%), NPR-15-055-160-30 (48%), and NPA-15-042-160-30 (35%). The fact that the POD energy contained in the first four modes is significantly greater in case of flame NPR-15-070-160-30 than that of NPR-15-055-160-30 suggests that the flame structures that are associated with forcing are much more pronounced in case of greater , farther from blow-off than those of NPR-15-055-160-30. The flame dynamics (i.e., increased flame flapping, increased possibility of local extinctions, etc.) at lower
and at a relatively small proximity to blow-off affect dramatically the flame structure and as a result, the influence of forcing on the flame structure decreases. In order to gain insight into the most dominant spatial structures of the flames and the respective periodicity, shows the first four OH* chemiluminescence POD modes and the respective PSD of POD time coefficients of the flames presented in .
Table 1. Experimental conditions of fully premixed (P), non-premixed with radial (NPR), and non-premixed with axial (NPA) fuel injection flames.
Figure 9. Cumulative energy of OH* chemiluminescence POD modes of flames P-15-070-160-30, NPR-15-070-160-30, NPR-15-055-160-30, and NPA-15-042-160-30 and the respective unforced flames.
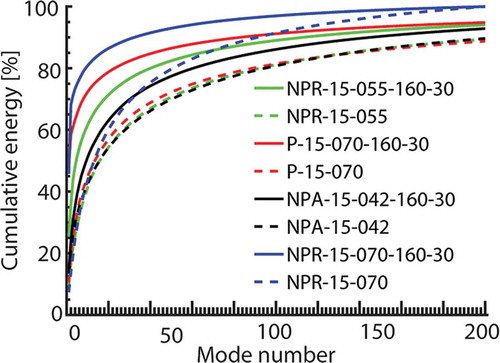
Figure 10. Mean image and first four OH* chemiluminescence POD modes and respective PSDs of POD time coefficients for flames P-15-070-160-30 (a), NPR-15-070-160-30 (b), NPR-15-055-160-30 (c), and NPA-15-042-160-30 (d).
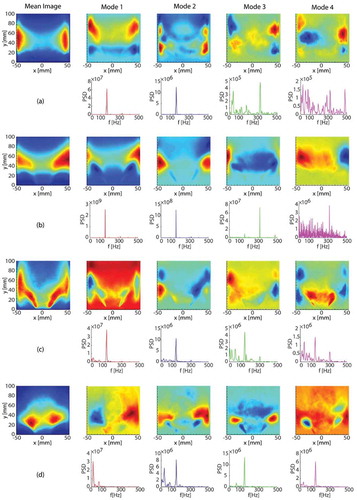
For flame P-15-070-160-30, POD modes 1 and 2 show a banded shape (), which is representative of the pronounced axial flame motion. In both modes, the heat release is mainly concentrated close to the wall. The respective PSDs of POD time coefficients exhibit one dominant peak at 160 Hz, and a smaller one at 320 Hz. The PSD of mode 3 reveals one dominant peak at 320 Hz and other smaller peaks at lower frequencies, while the PSD of mode 4 shows many peaks. The signal-to-noise ratio in the PSD of modes 3 and 4 is much lower than that of the PSD of modes 1 and 2. The structure of modes 3 and 4 represents a combination of a transverse and axial motion.
The shapes of the POD modes of flame NPR-15-070-160-30 () indicate that the flame has strong features, which is consistent with the strong response of the flame to acoustic oscillations, as discussed earlier. In particular, modes 1 and 2 reveal a strong axial dependence, which is characteristic of the pronounced axial flame motion. The respective PSDs of POD time coefficients exhibit one dominant peak at 160 Hz and a peak at 320 Hz, which is one order of magnitude smaller than that at 160 Hz. The PSD of mode 3 shows one dominant peak at 320 Hz and also two much smaller peaks at 160 and 480 Hz. The mode shape indicated an outward movement of the flame toward the wall. In mode 4, a roughly antisymmetric pair of heat release fluctuations can be seen, which represents the left–right motion of the flame. The respective PSD reveals a peak at 320 Hz, but the signal-to-noise ratio is much smaller than that of the PSDs in the previous modes.
For flame NPR-15-055-160-30 (), which is closer to blow-off than NPR-15-070-160-30, the structure of POD modes 1 and 2, representing the axial flame motion, is less well-defined than that of flame NPR-15-070-160-30. This suggests that the flame has weaker features, which is consistent with the lower response of flame NPR-15-055-160-30 than that of NPR-15-070-160-30, discussed previously. The respective PSDs reveal that 160 Hz is the main frequency content associated with this motion, implying that forcing affects greatly the behavior of the flame. However, this peak is significantly lower than that of NPR-15-070-160-30, also implying the lower influence of forcing on the flame response. A relatively small peak is also exhibited at 320 Hz. The shapes of modes 3 and 4 show a combination of axial and radial heat release variation, which represents an axial and transverse oscillating flame motion, while in the PSDs, apart from the main peak at 160 Hz, other peaks – of the same order of magnitude – are also revealed at lower frequencies and at the first harmonic at 320 Hz.
The first POD mode of flame NPA-15-042-160-30 () shows an antisymmetric pair of heat release fluctuations, which corresponds to a transverse flame motion. The respective PSD exhibits a dominant peak at 20 Hz and a smaller peak at 83 Hz. The absence of a 160 Hz peak suggests that the forcing does not have a great effect on the flame response, which is consistent with the low response to acoustic oscillations. The second POD mode represents a combination of an axial and transverse motion associated with two peaks, at 160 and at 34 Hz. The structure of POD modes 3 and 4 shows mainly an axial dependence, while the respective PSDs reveal a dominant peak at 160 Hz.
Conclusions
An experimental study was performed to investigate the response of three flames with different degrees of premixedness (fully premixed, non-premixed with radial, and non-premixed with axial fuel injection flames) to acoustic oscillations.
The NPR system showed the highest response to acoustic forcing, followed by the fully premixed and the NPA system, which exhibited a very low response. In particular, the response of the NPR system was greater than that of the premixed system for various levels of compactness, estimated for different bulk velocities , global
, and forcing amplitudes
. In the fully premixed system, it was suggested that the heat release modulation was mainly through flame surface area modulation, while in the NPR system, both the flame area and the equivalence ratio modulations were found to be important mechanisms of the heat release modulations. The lower
NPR flame showed a much lower response than that of the greater
NPR flame. Concerning the flame kinematics, a method for the quantifying the local response of the various parts of the flame at the forcing frequency was developed. This was achieved by using the ratio
of OH fluctuation contribution at 160 ± 3 Hz to the total variance, based on groups of pixels from the OH PLIF images. It was suggested that the greatest level of OH fluctuations was found in the near wall region for P and NPR flames, whereas in the ISL for the NPA flame. However,
was greater in the ISL region, and close to the bluff body plane than in the other regions for NPR and NPA flames, while for P system, the greatest values were seen in larger region farther downstream. Unlike the NPA system, the cyclic variation of the flame angle varied harmonically for P and NPR flames. From the POD analysis, for P and NPR flames, the first two OH* chemiluminescence POD modes revealed an axial dependence, which was characteristic of the axial motion of the flame and was associated with the forcing frequency at 160 Hz. For NPA, mode 1 revealed an antisymmetric pair of heat release fluctuations, which corresponded to a transverse flame motion and did not show a periodicity at 160 Hz. Finally, the flame dynamics at low
and at a relatively small proximity to blow-off affected dramatically the flame structure and as a result, the influence of forcing on the flame structure decreased. The results presented in this paper provide insight into the influence of fuel injection strategy on the flame response to acoustically excited systems, which contributes to the better understanding of combustor design as well as development of nonlinear combustion models.
Disclosure statement
No potential conflict of interest was reported by the authors.
Additional information
Funding
References
- Armitage, C.A., Balachandran, R., Mastorakos, E., and Cant, R.S. 2006. Investigation of the nonlinear response of turbulent premixed flames to imposed inlet velocity oscillations. Combust. Flame., 146, 419–436.
- Arndt, C.M., Severin, M., Dem, C., Stöhr, M., Steinberg, A.M., and Meier, W. 2015. Experimental analysis of thermo-acoustic instabilities in a generic gas turbine combustor by phase-correlated PIV, chemiluminescence, and laser Raman scattering measurements. Exp. Fluids., 56, 69.
- Ayache, S., and Mastorakos, E. 2013. Investigation of the “TECFLAM” non-premixed flame using large eddy simulation and proper orthogonal decomposition. Flow Turbul. Combust., 90, 219–241.
- Balachandran, R. 2005. Experimental Investigation of the Response of Turbulent Premixed Flames to Acoustic Oscillations. PhD, University of Cambridge.
- Balachandran, R., Ayoola, B.O., Kaminski, C.F., Dowling, A.P., and Mastorakos, E. 2005. Experimental investigation of the nonlinear response of turbulent premixed flames to imposed inlet velocity oscillations. Combust. Flame., 143, 37–55.
- Balachandran, R., Dowling, A., and Mastorakos, E. 2011. Dynamics of bluff-body stabilised flames subjected to equivalence ratio oscillations. In proceedings of the 5th European Combustion Meeting, Cardiff, Wales, 28 June - 1 July 2011..
- Bellows, B.D., Bobba, M.K., Forte, A., Seitzman, J.M., and Lieuwen, T. 2007. Flame transfer function saturation mechanisms in a swirl-stabilized combustor. Proc. Combust. Inst., 31 (II), 3181–3188.
- Berkooz, G., Holmes, P., and Lumley, J.L. 1993. The proper orthogonal decomposition in the analysis of turbulent flows. Annu. Rev. Fluid Mech., 25, 539–575.
- Candel, S. 2002. Combustion dynamics and control: progress and challenges. Proc. Combust. Inst., 29, 1–28.
- Denisov, A., and Ravi, A. 2015. Premixed Swirling Flame Response to Acoustic Forcing Studied With High-Speed PIV and OH* Chemiluminescence. ASME Turbo Expo 2015. V04BT04A030.
- Ducruix, S., Durox, D., and Candel, S. 2000. Theoretical and experimental determinations of the transfer function of a laminar premixed flame. Proc. Combust. Inst., 28, 765–773.
- Han, Z., Balusamy, S., and Hochgreb, S. 2015. Spatial analysis on forced heat release response of turbulent stratified flames. J. Eng. Gas Turbines Power., 137, 061504–061504-8.
- Kim, D., Lee, J.G., Quay, B.D., Santavicca, D.A., Kim, K., and Srinivasan, S. 2010a. Effect of flame structure on the flame transfer function in a premixed gas turbine combustor. J. Eng. Gas Turbines Power., 132, 021502-021502-7.
- Kim, K.T., Lee, J.G., Quay, B.D., and Santavicca, D. 2010b. Experimental investigation of the nonlinear response of swirl-stabilized flames to equivalence ratio oscillations. J. Eng. Gas Turbines Power., 133, 021502-021502-8.
- Kim, K.T., Lee, J.G., Quay, B.D., and Santavicca, D.A. 2010c. Response of partially premixed flames to acoustic velocity and equivalence ratio perturbations. Combust. Flame., 157, 1731–1744.
- Kypraiou, A.-M., Dowling, A., Mastorakos, E., and Karimi, N. 2015. Proper orthogonal decomposition analysis of a turbulent swirling self-excited premixed flame. 53rd AIAA Aerospace Sciences Meeting, American Institute of Aeronautics and Astronautics.
- Kypraiou, A.-M., Worth, N., and Mastorakos, E. 2016. Experimental investigation of the response of premixed and non-premixed turbulent flames to acoustic forcing. 54th AIAA Aerospace Sciences Meeting, American Institute of Aeronautics and Astronautics.
- Lee, J.G., and Santavicca, D.A. 2003. Experimental diagnostics for the study of combustion instabilities in lean premixed combustors. J. Propul. Power., 19, 735–750.
- Lieuwen, T.C. 2012. Unsteady Combustor Physics, Cambridge University Press, New York.
- Poinsot, T., Candel, S., and Trouvé, A. 1995. Applications of direct numerical simulation to premixed turbulent combustion. Prog. Energy Combust. Sci., 21, 531–576.
- Schimek, S., Moeck, J.P., and Paschereit, C.O. 2011. An experimental investigation of the nonlinear response of an atmospheric swirl-stabilized premixed flame. J. Eng. Gas Turbines Power., 133, 101502.
- Schuller, T., Durox, D., and Candel, S. 2003. A unified model for the prediction of laminar flame transfer functions: comparisons between conical and V-flame dynamics. Combust. Flame., 134, 21–34.
- Sirovich, L. 1987. Turbulence and the dynamics of coherent structures. I. Coherent structures. Quart. Appl. Math., 45, 561–571.
- Veynante, D., Duclos, J.M., and Piana, J. 1994. Experimental analysis of flamelet models for premixed turbulent combustion. Symposium (International) on Combustion, Elsevier, 1249–1256.
- Worth, N.A., and Dawson, J.R. 2012. Cinematographic OH-PLIF measurements of two interacting turbulent premixed flames with and without acoustic forcing. Combust. Flame., 159, 1109–1126.
- Zinn, B.T., and Lieuwen, T.C. 2006. Combustion instabilities: basic concepts. In Lieuwen, T.C., and Yang, V. (eds.) Combustion Instabilities In Gas Turbine Engines: Operational Experience. Fundamental Mechanisms, and Modeling. American Institute of Aeronautics and Astronautics, Reston.