
ABSTRACT
The amount of moisture in wood fuel has a significant influence on the emissions of particulate matter (PM) and gaseous pollutants when burned in small-scale domestic appliances. Previous studies have shown that higher moisture content generally produces higher particulate emissions factors. As well as quantity of material emitted, it is also important to understand the effects of moisture on particle qualities including size, composition and morphology – since these can influence the human-toxicity and environmental impacts of the particles. In this study, emissions were quantified and the particulate qualities were also examined using chemical, optical and thermogravimetric analysis as well as size-graded sampling. By comparing the results from the use of batches of beech wood fuel with differing moisture content, it was shown that there are consistent and significant differences in both the quantity and qualities of the resulting emissions when burned under the same conditions. This has important consequences for emission inventories which currently only assume an emission factor from a proscribed combustion situation
KEYWORDS:
Introduction
The evidence of adverse human health impacts of particulate matter air pollution, including respiratory and cardiovascular disease are well documented. Consequently, PM10 and PM2.5 have been targeted by air quality legislation in various jurisdictions across the developed world (Kim, Kabir, and Kabir (Citation2015)). While significant particulate matter emissions arise from the industrial and transport sectors, residential wood combustion has become one of the primary sources contributing to detrimental urban air quality in many European cities. Across the European Union (EU (Citation2018)), combustion in households and commercial and institutional premises accounts for more than half the emissions of PM2.5 and over a third of the emissions of PM10 – most of which is from small-scale residential wood combustion. The majority of these particulate emissions are from traditional heating stoves, the use of which has been generally increasing in Europe in recent years and forecast to continue to increase (Denier Van Der Gon et al. (Citation2015)). This has been partly due to increased fossil fuel prices but also as a result of biomass combustion being incentivized in many countries through climate change policy and renewable energy targets. In the UK, total emissions of both PM10 and PM2.5 have been declining since 2005 through reductions in the industrial and transport sectors. However, in the same period, those emissions from domestic combustion increased substantially. By 2018, 27% of total emissions of PM10 and 44% of total emissions of PM2.5 were attributed to domestic combustion. (UK Government (Citation2020))
The ongoing need to reduce fine particulate air pollution for health reasons, especially in urban zones, has led to many governments considering or implementing controls on residential wood combustion. Aside from banning the use of solid fuels altogether, approaches have included schemes to improve appliance efficiencies and reduction of their specific emissions (i.e. improved emissions factor) and the use of abatement technologies (Amann (Citation2018)). However, even best practice stove design and operation are only partially effective if there is no control on the quality of the fuel used. More specifically, it has been shown that wood fuel moisture content has a significant effect on the quantity and type of pollutant emissions produced in small-scale domestic combustion (Wilton and Bluett (Citation2012)). A number of studies have investigated such effects (Simoneit (Citation2002), Shen et al. (Citation2012), Magnone, Park, and Park (Citation2016), Fachinger et al. (Citation2017), Price-Allison et al. (Citation2019)). However, given the variability in the wide range of solid biomass fuels available on the market, the variety of stove designs and the inconsistency of user behavior, the reproducibility and predictability of the combustion processes and the consequent pollution formation is challenging (Houck and Tiegs (Citation1998), Magnone, Park, and Park (Citation2016)).
Combustion of biomass and other solid fuels leads to the formation of a complex mixture of gaseous pollutant species (Koppmann, Von Czapiewski, and Reid (Citation2005)) as well as aerosols and particulate matter commonly identified as ‘soot’. Soot may consist a variety of carbon-based species including black carbon, polycyclic aromatic hydrocarbons (PAH) and tars, and a variety of morphologies including aggregated chains, nucleated irregular solids and amorphous droplets. Routes to formation are many and complex with the production of precursor VOC and PAH, combustion temperatures, oxygen levels and flue gas temperatures being key factors (Reid et al. (Citation2005)). The variation and variability of each of these factors during the combustion cycle of a solid fuel produces different compositions, morphologies and quantity of soot at different stages of combustion and with different qualities of the wood fuel (Torvela et al. (Citation2014)). Perhaps the most significant and tangible quality of wood that affects particulate formation and emissions is the moisture content. The effects of moisture are various and include: depression of the fuel heating rate which affects the pyrolysis rate and the balance of VOCs produced; cooling of the flame and inhibition of oxygen in the combustion chamber thus reducing oxidation of VOCs; condensation and interaction with particle formation in the fuel gases. Together, these effects result in an increase in the quantity of soot emissions (i.e. higher emissions factors). This has been demonstrated in previous experimental work (Price-Allison et al. (Citation2019), Purvis and McCrillis (Citation2000), Chomanee et al. (Citation2015), Magnone, Park, and Park (Citation2016)). To some extent, these effects of fuel moisture content can be mitigated and emissions reduced where stove design and operation allows improved oxygen availability and controlled burning rates (Zhao et al. (Citation2008), Lu, Zhu, and Zhu (Citation2009)). Moisture also affects the composition of the soot. Lowered heating rates, temperatures and oxygen concentrations lead to higher fractions of organic carbon (OC) and higher fractions of heavier compounds within the OC including PAH, tars and ‘semi-volatile’ compounds (Shen et al. (Citation2013)). The differing fractions of each of these ingredients influences the soot particle development, affecting size, morphology and reactivity – and, consequently, its potential toxicity. It is therefore important that these other ‘qualities’ of soot emissions from fuel wood combustion are evaluated as well as the crude quantities measured in ‘emissions factors’ and size fractions.
In this study, the effects of moisture in wood burned in a typical domestic stove are further investigated, with an assessment of the soot emissions, an examination of the composition and morphology of captured particulates as well as associated emissions of gaseous pollutants. This work is relevant to the current interest, particularly in Europe and the US, in the role of condensable organics on smoke emission factors for biomass burning stoves (EMEP Citation2020).
Experimental methods
Fuel properties
The fuels used in the experiments were from a ‘low-moisture’ batch and a ‘high-moisture’ batch of hardwood beech (Fagus sylvatica L) logs. The ‘low-moisture’ fuel was kiln-dried for a period of 24 hours at 50°C in accordance with HETAS and Woodsure certification and had an average moisture content of 12.4 ± 0.2%. The ‘high-moisture’ fuel was seasoned for a short period and had a moisture content of 23.6 ± 2.6%. Moisture content was determined by mass difference after oven-drying at 105°C. Measurements were also recorded using a digital moisture meter (Valiant, FIR421) previously described by Price-Allison et al. (Citation2019).
The logs were prepared by removing the bark and then cut to a consistent size: ~225 mm length and 80 mm diameter. For analysis, samples of the wood were milled and sieved to 100 µm particle size using a cutting mill (Retsch SM100) and a cryo-mill (Retsch CryoMill). Sample preparation and selection were undertaken following BS EN 14780.
Ultimate Analysis (CHNS) was undertaken using a CE Instruments Flash EA1112 analyzer with results presented on a dry-basis while oxygen content (%) was calculated by difference (BS ISO 17247). The Higher Heating Value (HHV) and Lower Heating Value (LHV) were determined from the elemental composition of the fuel as identified in Friedl et al. (Citation2005) and BS EN 13240.
Thermogravimetric analysis (TGA) was undertaken on each of the fuels with heating rates and temperatures set to those outlined in BS EN 14774–3, BS EN 15148 and BS EN 14775 for moisture, volatile material and ash, respectively.
Combustion experiments
The combustion of the wood fuel was performed using a HETAS approved Waterford Stanley Oisin multi-fuel heating stove, previously described by Mitchell et al. (Citation2016). The manufacturer’s rating of the stove gives a thermal output of 5.7 kW with an efficiency of 79%. The stove is a cast-iron box 259 mm high, 270 mm wide and 190 mm high with a glass-paneled door. An internal deflector plate creates two separate (primary and secondary) combustion zones, with volumes of 8 × 10⁻³ m3 and 1.4 × 10⁻³ m3 and residence times of 0.9 s and 0.2 s, respectively. Combustion gases egressed via a 125 mm diameter vertical flue, to a height of 1.5 m above the stove and were thereafter extracted along with entrained air through a fixed flow duct (‘dilution tunnel’). A schematic of the apparatus is presented in figure S1.
The entire stove was mounted on a mass balance (Kern, DE 300k5DL) to allow the change in fuel mass during combustion to be recorded. Flue-gas flow rate was measured using an S-type pitot tube and a precision manometer.
Thermocouple probes were placed at: just above the grate within the combustion bed; near to the center of the primary combustion chamber; at the top of the flue near to the gas sampling point; in the dilution tunnel near to the soot sampling point.
Each set of experiments started with a fuel load ignited in the cold stove (cold start). The mass of fuel required per batch was calculated in accordance with the BS EN 13240:2001+ A2:2004 Standard, and changes mainly because of the different moisture contents. This was followed by three subsequent fuel loads ignited from the hot ash bed (3 hot start cycles). Each load of wood was between 1.13 kg and 1.46 kg. The time for fuel reloading was selected based upon the mass of unburned fuel reducing to below ~0.4 kg.
Flue gas was extracted at 10.00 l min−1 using a sampling pump via a cooled, stainless-steel sampling probe near the top and at the center of the flue through to a heated line and into a Fourier-transform infrared (FTIR) spectroscope [Gasmet, DX4000]. The line and cell temperatures were 180°C, the residence time in the system was <1 s. This instrument was calibrated by the manufacturer for typical combustion products. The gas sample exhaust was condensed in a cooled, deionized water-impinger. CO concentrations were measured in the dilution tunnel using a 8 mm diameter Testo 340 probe. The dilution factor was calculated from the ratio of CO concentration in the flue and that in the dilution tunnel. This ranged between 14.4 and 17.5.
Entrained soot in the flue gas was sampled using two methods: (a) Samples for determining total soot emissions (PMt) were taken from the dilution tunnel iso-kinetically via the sampling probe using a heated (30°C) impactor [Dekati, PM10] with a pump and flow controller at a sampling rate of 10.0 l min−1. Particles were collected on 25 mm greased aluminum foils for size fractions of ≥10, 2.5–10 and 1.0–2.5 μm (Dekati, CFG-225). A 50 mm micro-quartz backup filter with a pore size of 0.3 μm (Gilson, RF-360-050) was applied to collect PM emissions below 1.0 μm. Values of the emission factors (EF) were calculated following ISO 19867–1 as used in Mitchell et al. (Citation2019). (b) Samples of soot were taken at intermediate time intervals (2–5 min) using a small manual-suction pump device (Testo Smoke Pump) designed in accordance with DIN 51402 and ASTM D2156. This drew a fixed volume of gas (~1.6 l) through a filter paper over a 2–5 s period. In all cases the soot samples were not thermally pre-treated.
Analysis of soot samples
An evaluation of the color and optical density of the soot deposited on the filter papers was analyzed using an X-Rite (504) spectro-densitometer. The optical density is reported here as a darkness factor, D where white is represented as D = 0 and black is D = 100. The color of soot samples was estimated using GIMP GNU [2.8.14] image manipulation and analysis software and expressed using a red, green or blue (RGB) additive color model (Nishad. and Chezian. (Citation2013)). The RGB color model evaluates the intensity of each color component across a range 0–255. The darker the coloration of the sample material the lower the RGB value. Black is (0,0,0) while light brown is (150, 75, 0). This allows the soot samples which are black, brown or tan-like to be characterized qualitatively (Jones et al. (Citation2020)).
The soot collected on micro-quartz filter papers was analyzed using a Renishaw inVia Raman Spectrometer using a 514.5 nm green Argon laser excitation source.
The Raman shift spectrum was evaluated in the range from 500 to 2500 cm−1. The first-order spectra of soot particles are widely reported in the literature and generally consist of two overlapping peaks located at approximately 1350 cm−1 and 1585 cm−1 attributed as the G-band and D-band, respectively (Dippel, Jander, and Heintzenberg (Citation1999), Sadezky et al. (Citation2005), Ess et al. (Citation2016)). The G-band (1585 cm−1), often designated the ‘Graphitic band’, is characteristic of ideal graphitic lattice type structures maintaining an E2g symmetry. The D-band (1350 cm−1), or ‘Defect band’, applies to the disordered fraction of graphitic materials (Ferrari and Robertson (Citation2000), Sadezky et al. (Citation2005), Ivleva et al. (Citation2007)). The quantification of nanostructural order may be inferred from the peak intensity–height ratio as described in Ferrari and Robertson (Citation2000) and Ess et al. (Citation2016). The height-ratio, calculated as ID/IG, indicates the degree of order of the soot material, where a value <1 is indicative of poor ordering and a value >1 suggests an improved order.
Elemental Carbon (EC) and Organic Carbon (OC) fractions were determined by thermogravimetric analysis (Netzsch STA449 instrument). Samples were taken as 20.1 cm2 cuts of filter paper. The Organic Carbon fraction was determined from the mass-loss of the sample in nitrogen while the temperature was increased from 100°C to 550°C at 20 K min−1. The Elemental Carbon fraction was determined from the subsequent mass-loss of the sample in air at 550°C allowing full oxidation. Corrections were allowed for buoyancy effects during heating. Mass-loss from the substrate and binder was confirmed as negligible by testing a blank filter.
Fuel particle morphology and physical structure were examined using a FEI Nova NanoSEM 450 device operating at 3 kV. Energy Dispersive X-Ray spectroscopy (EDX) analysis was used to determine the elemental composition of the soot samples using an EDAX AMTEK analyzer operating at 18 kV.
Py-GC-MS analysis of the samples was undertaken as previously described (Maxwell et al. Citation2019) using a CDS Pyroprobe Model 5000 interfaced to a Shimadzu GC-MS, Model QP2010E. The Pyroprobe sample heating rate was set at 20°C ms−1 to a final temperature of 550°C with a hold time of 60s.
Condensate analysis
The condensate from the sampled flue gases (at the exhaust of the heated FTIR analyzer) was collected in a deionized water impinger for analysis. The pH of the sample was determined using a digital pH meter. The total phenolic content, incorporating substituted phenolic components, was determined by reacting with 4-aminoantipyrine and quantified by spectrophotometry. The total organic carbon (TOC) fraction water was determined by difference using a HACH IL 500 TOC-TN analyzer. Volatile acids were determined by gas chromatography with a flame ionization detector (GC-FID).
Results and discussion
Fuel analysis
The proximate and ultimate analyses of the fuel are presented in .
Table 1. Proximate and ultimate analysis of wood fuel.
Burning rates
The fuel conversion (burning) rate of each batch of fuel can be derived from the measured mass of the fuel during combustion. shows the measured mass (kg) and derived burning rate (kg/h) during three consecutive ‘hot start’ combustion cycles for both the low moisture and a high moisture fuel. The average over three complete cycles of the burning rate is 2.4 ± 0.4 kg/h for the low moisture fuel and 1.4 ± 0.03 for the high moisture fuel. The burning rates are consistent with measurements made in a previous study (Price-Allison et al. (Citation2019), Maxwell et al. (Citation2019)).
Figure 1. Measured mass (kg) and derived fuel conversion rate (kg/h) during the combustion of: (a) low moisture and (b) high moisture fuel. Solid vertical lines represent the point of reloading. Dashed vertical lines represent transfer from flaming to smoldering phase.
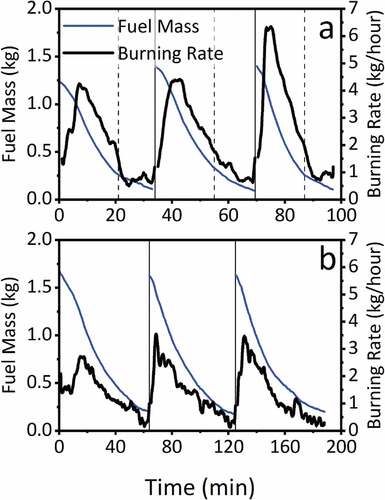
The wood fuel combustion cycle can be considered in three distinct phases: i) ignition; ii) flaming combustion; iii) smoldering combustion. The ignition phase involves the heating up of the raw wood fuel on the hot bed of char until the wood begins to devolatilize and a flame is ignited. The flaming and smoldering phases can be identified (other than visually) by the Modified Combustion Efficiency (MCE) which is defined (Yokelson, Griffith, and Ward (Citation1996)) as MCE = [CO2]/[CO2 + CO]. The MCE changes from a high value (close to 1.0) during flaming to a lower value (0.65–0.85) during the smoldering phase (Fachinger et al. (Citation2017)). In , the transition between the combustion phases is indicated by dashed lines.
Combustion temperatures
The combustion temperatures vary depending upon the fuel moisture content, the combustion phase and the associated burning rate. The highest temperatures occur during the flaming phase where the volatiles from the wood burn in a diffusion flame. The later smoldering phase can occur at much lower temperatures where the combustion is dominated by oxidation of carbon monoxide at the surface of the char. The relationship between the MCE and observed flue gas temperature is illustrated in Figure S2.
shows measured temperatures at different places in the combustion chamber/bed/flue. Very few direct measurements of these temperatures have been reported in this context in other studies. Yan et al. (Citation2020) measured flame temperatures of the combustion of wood pellet pyrolysis products reporting average temperatures ~1000°C with hot spots at ~1150°C. As far as the authors are aware, no similar measurements have been made of beds of biomass char. Linjewile et al. (Citation1993) reported temperatures for petroleum coke under convective flow ~900°C. In the case of higher moisture wood, the temperatures are depressed by about 10%, for example, to ~810°C in the combustion chamber.
Table 2. Combustion zone temperatures.
The combustion temperatures around the mid-points of the flaming phase and the smoldering phase for the combustion cycles illustrated in are also presented in . The temperature profiles have implications for the formation of the pollutants discussed later.
Gaseous emissions
presents selected components of the emitted flue gas detected by the FTIR gas analyzer. Organic and inorganic gaseous species are reported in mg/m3 at STP (0°C and 101 kPa) on a dry basis. It is noted that pollutant species identified as benzene and formaldehyde may include other similar species. The 120 s gap in the data is the period of manual reloading which is omitted due to air ingress.
Figure 2. Gaseous emission concentrations (mg/m3) for (a) low moisture wood and (b) high moisture wood. Solid vertical lines represent the point of reloading. Dashed vertical lines represent the point of transfer from the flaming phase to the smoldering phase.
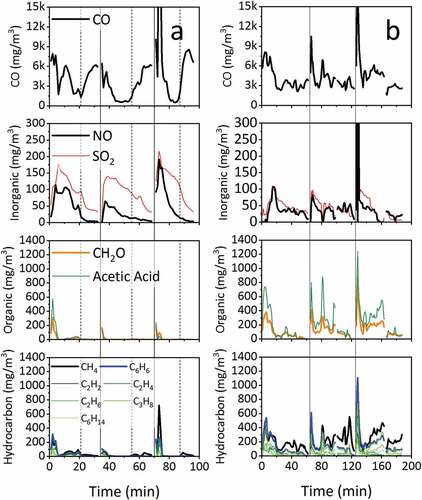
During the combustion of low moisture wood, the CO concentration is observed to follow a typical profile whereby formation is low during the flaming phase and higher during smoldering phase. For high moisture wood, a different profile is observed; CO remains high throughout the entire combustion cycle. Peaks in CO are observed following fuel addition where the fuel is heating up from a low temperature prior to ignition. Higher moisture prolongs this warming/drying, depresses the fuel temperature and inhibits the flaming phase temperatures leading to higher CO formation (Vakkilainen (Citation2017)).
Emission Factors were derived from the data acquired for a wider range of gaseous products as detected with the FTIR gas analyzer. These are presented in .
Table 3. Average emission factors evaluated over complete combustion cycles for low and high moisture wood in g/kg (dry basis).
Nitric oxide formation is variable throughout the combustion cycle with higher emissions during periods where the rate of fuel conversion was highest (). NO is the most common nitrogen oxide species in the flue gas composition and accounts for ~90% of total NOx. Fuel-NOx is the major route of formation of NO and NO2 in wood stove combustion (Glarborg, Jensen, and Johnsson (Citation2020, Citation2003)). Since the combustion temperature remains relatively low (<1400°C), there is less of a contribution from the thermal NOX formation mechanism (Bugge and Haugen (Citation2014)). NO formation is shown to be similar for both wet and dry wood following a similar trend to the fuel burning rate: being generally highest during the flaming phase and lowest during smoldering. However, the total formation is shown to be unaffected by combustion temperature. The correlation with burning rate suggests that emissions are linked to the rate of devolatilization of the fixed nitrogen in the fuel.
SOX formation is derived from the fuel sulfur content. During typical stove operation between 57–65% of fuel sulfur may be released and entrained within the flue gas while between 35–43% remains within the char (Houmoller and Evald (Citation1999)). As with NOX formation, the rate of SO2 emission is correlated to the fuel conversion rate suggesting a mechanism of release through devolatilization. The correlation coefficient (r) for the relationship between the combustion temperature and SO2 formation is 0.818 perhaps indicating a higher dependence of the formation process on temperature. However, there is also a difference in SO2 emissions between low and high moisture wood with the latter generally associated with higher concentrations (cf. ).
Emissions of gaseous organic species vary throughout the combustion cycle. Formaldehyde and acetic acid generally peak immediately following stove reloading with a subsequent reduction throughout the flaming and smoldering phases. The trend appears similar for both low and high moisture wood although average emissions for the latter were significantly higher (cf. ). The difference is attributed to the respective differences in combustion temperatures as described previously, but in this case the FTIR measurements will encompass other functional similar species.
Spikes in the pollutant emissions following reloading are attributed to devolatilization occurring prior to ignition of the flame. The devolatilization is accompanied by heavy smoke production which further inhibits ignition. Such processes are less pronounced during the combustion of low moisture fuel which dries and ignites quicker. Similar trends are observed for hydrocarbon species indicating similar causation with regard to reloading, delayed ignition and combustion temperature. Methane and benzene were the most prevalent hydrocarbon emissions from both low and high moisture wood. However, the emissions were generally lower for hydrocarbons with higher molecular mass (g/mol). Some mid-cycle peaks were observed which are attributed to the inherent variability in combustion conditions. High moisture fuel appears to produce higher emissions throughout the combustion cycle with high concentration of organic and hydrocarbon species identified during the cooler smoldering phase. The higher moisture content inhibits fuel particle heating leading to unreactive biomass fractions retaining volatile constituents for a prolonged period under heating (Price-Allison et al. (Citation2019)).
Condensable product analysis
The exhaust gases from the FTIR analyzer went into a water-cooled impinger unit where the condensed products were captured, see Figure A1. For practical reasons, the sample collected was for the entire experimental process (the ‘cold’ start cycle as well as the three ‘hot start’ cycle) and collected in an impinger containing an initial 150 ml deionized water. After the experiment up to 10 cm3 (85%) phosphoric acid was added depending on the pH. The quantity of water produced during combustion was estimated from the composition of the wood, and it was assumed that all this water condensed in the impinger. A summary of the condensate analyses is presented in .
Table 4. Concentration of organic compounds sampled in the condensate.
The on-line FTIR analysis indicated more ‘acetic acid’ formed during wet wood combustion, and this is confirmed by the condensate analysis shown in . It should be noted that the pH of the condensate is very similar for both cases, possibly due to the amphoteric effect of the phenols.
Particulate emissions: analysis of the soot fraction < 1 µm
In previous work (Jones et al. (Citation2020)) examined soot properties for samples where the full range of particulate sizes was captured on filter papers. In the current work, the soot was captured in four size fractions using a Dekati Impinger.
The size distributions of these soots are similar to that observed previously (Price-Allison et al. (Citation2019) and Maxwell et al. (Citation2019)). The results from this study are presented in . Since over 90 wt% of the soot is in the <PM1.0 range and up to 98% for the high moisture wood, this fraction was studied in more detail.
Table 5. Soot particle size distribution (by mass fraction).
Three soot samples for each of the two fuels captured on the <1µ micro-quartz filter papers were analyzed to determine the Elemental Carbon (EC), Organic Carbon (OC) and Total Carbon (TC), where TC = EC+OC. shows the results of these analyses. The Modified Combustion Efficiency, MCE, is also shown to illustrate the relationship.
Table 6. Elemental Carbon, Organic Carbon and Total Carbon composition of the soot samples presented on a weight percent basis (wt. %).
The ‘High Moisture 3ʹ sample was collected during the prolonged smoldering period of cooler combustion conditions. These conditions lead to the formation of a higher OC fraction. On average, the ratio of EC/TC for the low moisture fuel is 0.84 while for high moisture fuel it is 0.25. These are consistent with previous work (e.g. Li et al. (Citation2009), Alves et al. (Citation2011), Atiku et al. (Citation2016)).
It is interesting to compare the results obtained previously using a total soot sample analyzer (Jones et al. (Citation2020)). Of note is the fact that for this <1 µm sample the colors are black or brown. Lighter colors such as yellows are seemingly associated with larger particles containing organic molecules. The present results are compared with previous published results from this stove, and from a model compound, furfural, which are presented in . The association of color and the nature of the carbon is clearly apparent.
Table 7. Published data from (Jones et al. Citation2020) on optical properties and MCE.
The AAE is defined as: babs = a λ AAE where babs is the absorption coefficient for filter papers covered with soot samples and measured by a spectrophotometer. The constant, a, is independent of wavelength but is dependent on the thickness of the absorbing sample. For small spherical soot particles AAE equals 1.
Scanning electron microscope (SEM) images of the soot deposited on portions of the <1µ filters are shown in . These samples correspond to samples 1 and 2 for each fuel as listed in . The images are both with x10,000 magnification. The samples from low moisture wood ( (a) and (b)) are of slightly different soot concentrations and consist mainly of spherical soot particles with diameters of ~50 nm, some joined in long chains. These samples had higher EC/TC ratios. Some images showed the occasional presence of KCl crystals ~0.5 µm diameter. The samples from high moisture wood ( (c) and (d)) which had the higher OC content, showed the formation of an amorphous tar-like material. No separate KCl crystals were observed on the surface in this case.
Figure 3. SEM images of soot collected by impaction from low moisture wood (a, b) showing long chains of spherical particulate material (high EC/TC) and high moisture wood (c, d) showing the formation of amorphous tar-like material (high OC).
Evidence on the nature of the tar-like material was obtained by using PY- GC-MS analysis on the samples from the same quartz micro-filters. The resulting chromatogram for the high moisture wood is shown in . The low moisture sample showed a similar chromatogram but with a much lower intensity.
Figure 4. Chromatogram of the Py-GC-MS of species desorbed at 300oC from the ‘raw tar’ collected from the combustion of High Moisture wood showing the sugar hydrides, oxidized species and polyphenol species: 1, methoxy-toluenes; 2, methoxy-phenols; 3, guaiacyl acetone;4, 1-(3,4,5-trimethoxyphenyl)ethenone; 5, levoglucosan, d-glucopyranose, anhydro-d-mannosan; 6, Syringaldehyde; 7, acetosyringone, acetophenone.
The fraction also contains peaks from organic acids which might explain the difference between the concentration of acetic acid measured by FTIR (given in ) and the measured speciated lower molecular weight acid data in .
The soot samples were also analyzed by Raman spectroscopy. The resulting normalized spectra are shown in . The height-ratio of the D-peak (at 1350 cm−1) and G-peak (at 1585 cm−1), ID/IG, is used as a method of characterizing the nano structural order of the material For graphitic materials, a lower value of ID/IG indicates an increased structural order characteristic of more graphitic materials. However, for carbon material of these types (i.e. soot containing organic matter) the ID/IG ratio is influenced by the amount of organic carbon, such that those with the highest OC have the lowest ID/IG ratio, as seen by Ferrari and Robertson (Citation2000) and Ess et al. (Citation2016).
Figure 5. Normalized Raman spectra of soot from the combustion of low and high moisture woods.
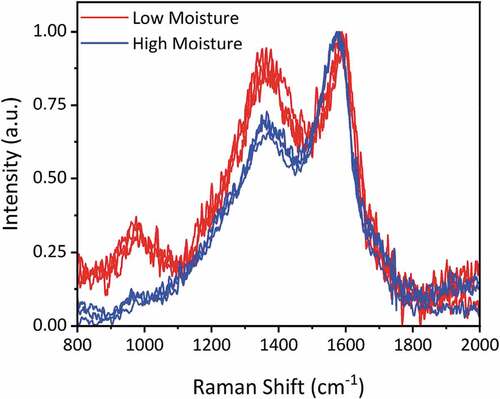
The ID/IG ratios for the samples studied are presented in . The ratios for those samples from the low moisture fuel are higher (0.85 to 0.95) compared to those from high moisture fuel (0.65 to 0.71). Thus, there is an association between the ID/IG ratio and the OC content, with the lower ID/IG ratio corresponding to higher OC as shown in . The stronger intensity spectra of the high moisture fuel soot samples are due to greater fluorescence from the higher OC benzenoid content. Though presenting a higher nano-structural order, the inherent amorphous nature of the soot means that the ID/IG values are lower than that observed in the literature for true graphitic materials (Ferrari and Robertson (Citation2000), Ivleva et al. (Citation2007), Ess et al. (Citation2016)).
Table 8. Relationship of OC fraction to ID/IG value.
Color analysis of total soot samples
Samples of soot were collected at 2–5 min intervals throughout the combustion cycle using a pump to extract fixed volumes of flue gas with the soot captured on a filter paper. The samples were analyzed for color and darkness using a spectro-densitometer. Over a complete combustion cycle, the total soot samples produce a black or brown deposit. However, for a sample extracted over a short time interval (10–60 seconds) a more subtle variation in color (tan, gray, yellow, blue) can be observed. The coloration and ‘darkness’ of the soot samples collected for ‘hot start’ cycles are shown in .
Table 9. Soot characteristics from low and high moisture wood.
A noticeable color difference is observed between the soot samples obtained from the combustion of low moisture and high moisture wood. Low moisture wood combustion generally results in formation higher density soot with a dark brown or black color. The combustion of high moisture wood or fuels under cold-start conditions results in the formation of lower density soot with a light brown or tan color. Similar findings have been presented in other studies (Rau (Citation1989), Mitchell et al. (Citation2016)) where the soot color varies in relation to the relative EC and OC content. The lower density soot with light brown or tan color corresponds to higher OC fraction while higher density soot with dark brown or black coloration corresponds to higher EC formation within the material (Rau (Citation1989)). Mitchell et al. (Citation2016) identified brown or tan-coloration in soot samples collected under cold-start operation while soot collected under higher temperature combustion was black. This color change from black to brown was as result of a higher tar-phase formation on the soot surface resulting in a higher organic fraction. Similarly, Jones et al. (Citation2020) identified a change in the visible color of soot samples collected during different phases of combustion – also a result of the variation in EC/TC. Crudely, darker and black soot is representative of periods of higher temperature and higher efficiency combustion while lighter brown, tan, yellow and gray soot samples are indicative of reduced combustion efficiency and fuel smoldering.
The Absorption Ångström Exponent (AAE) is an equation representing optical absorption by an aerosol as a function of wavelength (Liu. et al. (Citation2018)). It is generally assumed that black carbon, generated under low moisture wood combustion, presents an AAE value of near to 1.0 while soot samples that are visually brown in color present an AAE greater than 2.0 (Kirchstetter, Novakov, and Hobbs (Citation2004), Liu et al. (Citation2016), Liu. et al. (Citation2018)). This information is important for climate model predictions. An increase in brown carbon emission is prevalent during the combustion of high moisture wood while black carbon is generally only associated with high-temperature combustion. Given the capacity of high moisture wood combustion via improper seasoning and gray wood procurement routes, the fraction of brown carbon particles may be higher than initially predicted in climate models.
UV-Vis analysis of the ASTM soot samples has been made using the same method in Jones et al., 2018. Previously it has been shown that mature soot particles with a low OC had AAEs close to 1, whereas soot containing higher OC had high values of AAEs. In these experiments, there is a very significant difference between the soot produced during combustion of low moisture wood compared to the high moisture wood as shown in (a) and (b). In the former, spectra for soot produced during flaming combustion are close together and separated from the spectra for soots from smoldering combustion. In the latter, all curves are also close together indicating that the products are optically similar in both phases.
Figure 6. UV Vis results for: (a) low moisture wood and (b) high moisture wood.
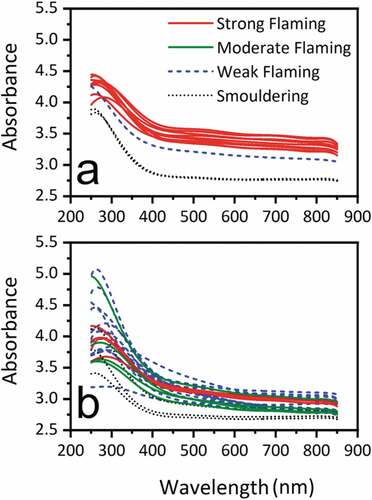
In this analysis, the shapes of the spectra are dictated by enhanced absorption by semi-volatile organics (SOVC) such as the compounds shown from PY-GC-MS analysis, or due to the soot-forming species (the building bricks). As a consequence, it is not possible to get a power-function to fit in the AAE equation although the results are similar. This may be the result of higher levels of samples and thicker optical paths for the measurement. During short sampling times (0 min-5 min) it is possible to see a number of different colors but these are lost when we collect soot over a long period of time (Dekati method) so we only see brown and black soot samples.
Concluding remarks
The burning rate of the woods used as a fuel was shown to be dependent on their moisture content, an increase in the fuel moisture content led to a reduction in the burning rate. This is expected and consistent with earlier studies using this stove (Price-Allison et al. Citation2019). The difference in burning rates can be attributed to an observed reduction in the bed temperature as well as the combustion chamber temperature with resultant reduction in radiant feedback.
The emission of both gaseous and particulate emissions is greatly influenced by the moisture content in the wood. In the case of smoke emissions, the increase is influenced by the amount of incompletely combusted material, an effect which is well known (Rau, Citation1989) but additional information is provided here.
The concentration of gaseous hydrocarbon species was shown to be dependent upon the molecular mass of the compound, as expected on thermodynamic grounds in combustion of both the low and high moisture woods. However, the concentrations of semi-volatile species, OC and total phenolic content were shown to be significantly higher during the combustion of high moisture wood. The pyrolysis processes lead to highly aromatic species, which can condense on filters and presumably soot particles once they have cooled in the dilution tunnel.
The PMt emissions generated during the combustion were higher for the high moisture wood compared to the low moisture wood. Soot samples collected during low moisture wood combustion presented a black appearance and included a high EC fraction and a low OC fraction. Soot samples collected during high-temperature combustion with a high EC fraction are present as long chains of spherical particulate material with a diameter of approximately 50 nm. Soot samples collected during high moisture wood combustion presented a largely brown appearance and included a high OC fraction. It is possible that the values of the emission factors of soot from high moisture wood are misleading because of the high semi-volatile fraction, and the structure consists of a nucleus of black carbon surrounded by a tar-like layer of brown OC.
Declaration of Interest Statement
The authors declare no conflict of interest.
Data Statement
All the data in this study is in the body of the paper or in the Supplementary Online Material.
Acknowledgments
The authors would like to thank support from EPSRC for support via the Centre for Doctoral Training (Grant Number EP/L014912/1). They also wish to thank Ashtrees Ltd, Leeds, UK for the supply of wood, and for technical support from Dr. A. Cuncliffe, Mrs. K. Alves Thorne, Dr. A. Kulak, Dr. J. Williams, Dr. A. Kazlauciunas, Dr. E.J.S. Mitchell and Dr. D. Elliott (University of Leeds). We are grateful for discussions with Mr. G. Hughes (Hughes Design Ltd. UK)
Additional information
Funding
References
- Alves, C., C. Gonçalves, A. P. Fernandes, L. Tarelho, and C. Pio. 2011. Fireplace and woodstove fi ne particle emissions from combustion of western Mediterranean wood types. Atmos. Res. 101 (3):692–700.
- Amann, M. (Ed.), Measures to address air pollution from small combustion sources, Report to the European Commission, 2018
- Atiku, F. A., E. J. S. Mitchell, J. M. Jones, A. Williams, and K. D. Bartle. 2016. The impact of fuel properties on the composition of soot produced by the combustion of residential solid fuels in a domestic stove. Fuel Process. Technol. 151:117–25.
- Bugge, M., and N. E. L. Haugen 2014. NOx emissions from wood stoves - a CFD modelling approach: Proc. of 22nd EU BC&E., 674–79.
- Bugge, M., Ø. Skreiberg, N. E. L. Haugen, and P. Carlsson. 2020. Predicting NOx emissions from wood stoves using detailed chemistry and computational fluid dynamics. Energy Procedia. 75 (1876):1740–45.
- Chomanee, J., S. Tekasakul, P. Tekasakul, and M. Furuuchi. 2015. Effects of moisture content and burning period on concentration of smoke particles and particle-bound polycyclic aromatic hydrocarbons from rubber. Aerosol. Air. Qual. Res. 9:404–11.
- Denier Van Der Gon, H. A. C., R. Bergström, C. Fountoukis, C. Johansson, S. N. Pandis, D. Simpson, and A. J. H. Visschedijk. 2015. Particulate emissions from residential wood combustion in Europe – Revised estimates and an evaluation. Atmos. Chem. Phys. 15:6503–19.
- Dippel, B., H. Jander, and J. Heintzenberg. 1999. NIR FT Raman spectroscopic study of flame soot. Phys. Chem. Chem. Phys. 1:4707–12.
- EMEP. 2020. European Monitoring and Evaluation Programme (EMEP) Technical Report MSC-W 4/2020, How should condensables be included in PM emission inventories reported to EMEP/CLRTAP? Report of the expert workshop on condensable organics organised by MSC-W, Gothenburg, 17-19th March 2020. FULLTEXT01.pdf (diva-portal.org).
- Ess, M. N., D. Ferry, E. D. Kireeva, R. Niessner, F. Ouf, and N. P. Ivleva. 2016. In situ Raman microspectroscopic analysis of soot samples with different organic carbon content: Structural changes during heating. Carbon 105:572–85. doi:10.1016/j.carbon.2016.04.056.
- EU, 2018. European environment agency, sector share for emissions of primary PM2.5 and PM10 particulate matter, www.eea.europa.eu
- Fachinger, F., F. Drewnick, R. Giere, and S. Borrmann. 2017. How the user can influence particulate emissions from residential wood and pellet stoves: Emission factors for different fuels and burning conditions. Atmos. Environ. 158:216–26.
- Ferrari, A. C., and J. Robertson. 2000. Interpretation of Raman spectra of disordered and amorphous carbon. Am. Phys. Soc. Phys. Rev B 61 (20):14095–107.
- Friedl, A., E. Padouvas, H. Rotter, and K. Varmuza. 2005. Prediction of heating values of biomass fuel from elemental composition. Anal. Chim. Acta 544 (1–2):191–98.
- Glarborg, P., A. D. Jensen, and J. E. Johnsson. 2003. Fuel nitrogen conversion in solid fuel fired systems. Prog. Energy Combust. Sci. 29 (2):89–113.
- Houck, J. E., and P. E. Tiegs 1998. Residential wood combustion technical review: Volume 1. Technical Report [Online]. https://www3.epa.gov/ttnchie1/ap42/ch01/related/woodstove.pdf.
- Houmoller, S., and A. Evald 1999. Sulphur balances for biofuel combustion systems In: Proceedings 4th Biomass Conference of the Americas. Eds. Overend,R.P. and Chornet, E. Pergamon.
- Ivleva, N. P., U. Mckeon, R. Niessner, and U. Pöschl. 2007. Raman microspectroscopic analysis of size- resolved atmospheric aerosol particle samples collected with an ELPI: Soot, humic-like substances, and inorganic compounds raman microspectroscopic analysis of size-resolved atmospheric aerosol particle sample. Aerosol Sci. Technol. 41 (7):655–71.
- Jones, J. M., E. J. S. Mitchell, A. Williams, E. Kumi-Barimah, G. Jose, K. D. Bartle, N. Hondow, and A. R. Lea-Langton. 2020. Examination of combustion-generated smoke particles from biomass at source: relation to atmospheric light absorption. Combust. Sci. Technol. 192:130–43.
- Kim, K.-H., E. Kabir, and S. Kabir. 2015. A review on the human health impact of airborne particulate matter. Environ Int 74:136–43.
- Kirchstetter, T. W., T. Novakov, and P. V. Hobbs. 2004. Evidence that the spectral dependence of light absorption by aerosols is affected by organic carbon. J. Geophys. Res. 109:D21208.
- Koppmann, R., K. Von Czapiewski, and J. S. Reid. 2005. A review of biomass burning emissions, part I: Gaseous emissions of carbon monoxide, methane, volatile organic compounds, and nitrogen containing compounds. Atmos. Chem. Phys. 5:10455–512.
- Li, X. H., S. X. Wang, L. Duan, J. M. Hao, and Y. F. Nie. 2009. Carbonaceous aerosol emissions from household biofuel combustion in China. Environ. Sci. Technol. 43:6076–81.
- Linjewile, T. M., V. S. Gururajan, K. Pradeep, and P. K. Agarwal. 1993. Measurement and modelling of the temperature of burning petroleum coke particles in an incipiently fluidized bed. Fuel 72:813–19.
- Liu, C., C. E. Chung, F. Zhang, and Y. Yin. 2016. The color of biomass burning aerosols in the atmosphere. Sci. Rep 6:28267. .
- Liu., C., C. E. Chung, Y. Yin, and M. Schnaiter. 2018. The absorption angstrom exponent of black carbon: From numerical aspects. Atmos. Chem. Phys 18:6259–73.
- Lu, H., L. Zhu, and N. Zhu. 2009. Polycyclic aromatic hydrocarbon emission from straw burning and the influence of combustion parameters. Atmos. Environ. 43:978–83. .
- Magnone, E., S. Park, and J. H. Park. 2016. Effects of moisture contents in the common Oak on carbonaceous aerosols generated from combustion processes in an indoor wood stove. Combust. Sci. Technol. 188:982–96.
- Maxwell, D., B. Gudka, A. Price-Allison, J. M. Jones, and A. Williams. 2019. Emissions from the combustion of torrefied and raw biomass fuels in a domestic heating stove. Fuel Process. Technol. 199 (2020):106266.
- Mitchell, E. J. S., A. R. Lea-Langton, J. M. Jones, A. Williams, P. Layden, and R. Johnson. 2016. The impact of fuel properties on the emissions from the combustion of biomass and other solid fuels in a fixed bed domestic stove. Fuel Process. Technol. 142:115–123. .
- Mitchell, E. J. S., Y. Ting, J. Allan, D. V. Spracklen, G. Mcfiggans, H. Coe, M. N. Routledge, A. Williams, J. M. Jones, Y. Ting, et al. 2019. Pollutant emissions from improved cookstoves of the type used in Sub-Saharan Africa. Combust. Sci. Technol. 192:1582–602.
- Nishad., P. P., and R. M. Chezian. 2013. Various colour spaces and colour space conversion algorithms. J. Global Res. Comput. Sci. 4:44–48.
- Price-Allison, A., A. R. Lea-Langton, E. J. S. Mitchell, B. Gudka, J. M. Jones, P. E. Mason, and A. Williams. 2019. Emissions performance of high moisture wood fuels burned in a residential stove. Fuel 239:1038–45.
- Purvis, C. R., and R. C. McCrillis. 2000. Fine particulate matter (PM) and organic speciation of fireplace emissions. Environ. Sci. Technol. 34:1653–58.
- Rau, J. A. 1989. Composition and size distribution of residential wood smoke particles. Aerosol Sci. Technol. 10:181–92. .
- Reid, J. S., R. Koppmann, T. F. Eck, and D. P. Eleuterio. 2005. A review of biomass burning emissions part II: Intensive physical properties of biomass burning particles. Atmos. Chem. Phys. 5:799–825.
- Sadezky, A., H. Mucjenhuber, H. Grothe, R. Niessner, and U. Poschl. 2005. Raman microspectroscopy of soot and related carbonaceous materials: Spectral analysis and structural information. Carbon 43:731–1742.
- Shen, G., S. Wei, W. Wei, Y. Zhang, Y. Min, B. Wang, R. Wang, W. Li, H. Shen, Y. Huang, et al. 2012. Emission factors, size distributions, and emission inventories of carbonaceous particulate matter from residential wood combustion in rural China. Environ. Sci. Technol. 46 (7):4207–14.
- Shen, G., M. Xue, S. Wei, Y. Chen, Q. Zhao, B. Li, H. Wu, and S. Tao. 2013. Influence of fuel moisture, charge size, feeding rate and air ventilation conditions on the emissions of PM, OC, EC, parent PAHs, and their derivatives from residential wood combustion. J. Environ. Sci. 25:1808–16.
- Simoneit, B. R. T. 2002. Biomass burning - A review of organic tracers for smoke from incomplete combustion. Appl. Geochem. 17:129–62.
- Torvela, T., J. Tissari, O. Sippula, T. Kaivosoja, J. Leskinen, A. Virén, A. Lähde, and J. Jokiniemi. 2014. Effect of wood combustion conditions on the morphology of freshly emitted fine particles. Atmos. Environ. 87:2014.
- UK Government. 2020. Emissions of air pollutants in the UK, 1970 to 2018 – Particulate matter (PM10 and PM2.5), Department for Environment Food & Rural Affairs, 24 September. www.gov.uk/government/publications
- Vakkilainen, E. K. 2017. Steam generation from biomass. Oxford: Butterworth-Heinemann.
- Wilton, E., and J. Bluett 2012. Factors influencing particulate emissions from NEW compliant woodburners in Nelson, Rotorua and Taumarunui 2007, NIWA, Auckland, New Zealand
- Yan, W., K. Li, X. Huang, L. Yu, C. Lou, and Y. Chen. 2020. Online measurement of the flame temperature and emissivity during biomass volatile combustion using spectral thermometry and image thermometry. Energy Fuels 34:907–19.
- Yokelson, R. J., D. W. Griffith, and D. E. Ward. 1996. Open-path Fourier transform infrared studies of large-scale laboratory biomass fires. J. Geophys. Res. 101 (D15):21,067–21,080.
- Zhao, W., Z. Li, G. Zhao, F. Zhang, and Q. Zhu. 2008. Effect of air preheating and fuel moisture on combustion characteristics of corn straw in a fixed bed. Energy Convers. Manage. 49:3560–65