
 ?Mathematical formulae have been encoded as MathML and are displayed in this HTML version using MathJax in order to improve their display. Uncheck the box to turn MathJax off. This feature requires Javascript. Click on a formula to zoom.
ABSTRACT
Under certain conditions dust explosions occur in the alimentary industry. Following ATEX and other guidelines have not eliminated accidents. Therefore, more knowledge is needed. The current work delivers experimental results describing phase transitions and decomposition of dusts. Dusts from wheat flour, chili powder, corn starch, milk powder, cocoa powder, and by-product of grain are investigated. The temperature of pyrolisation has been identified using TGA to be in the range [250°C, 600°C] in air and [300°C, 450°C] in nitrogen. It was found that the compositions of the pyrolysis gases depend on temperature. Carbon monoxide, carbon dioxide, methane, and hydrogen were the main contributors to the pyrolysis gases. The distributions are described with a polynomial or Gaussian fit. The current paper proposes coefficients for Gaussian polynomials expressing the concentration for the four primary pyrolysis gases.
KEYWORDS:
Introduction
Dust explosions are common and costly. Biomass materials, such as wood, agricultural crops or wastes, and municipal wastes are flammable and can explode when in the form of a dust cloud entering into contact with an energy source and if concentrations of dust in the air falls within certain limits. Explosions and fires from combustible materials are a known hazard and they can have devastating and irreversible effects. Most industries handling powders, such as the food, wood, paper, and pharmaceutical are at risk of suffering an explosion.
A dust explosion can occur when any oxidizable fine powdered material, dispersed in the appropriate concentrations, form a flammable dust cloud in air (NFPA Citation2020). When combustible dusts ignite, there are often two explosions known as primary and secondary explosions. A primary dust explosion often occurs when a dust suspension in a confined space, such as a container, room, or machinery, ignites, and explodes. The pressure wave and flow induced by the primary explosion will shake other dusts and powders that have accumulated somewhere else in the plant. When this dust becomes airborne, it also ignites and creates a secondary dust explosion, this being often more destructive than the primary one.
In the United Kingdom, every year there are about 40 to 50 dust explosions reported to the Health and Safety executive (Executive, H.a.S Citation2011). In the United States, there are approximately 20 explosions related solely to the storage of grains per year and about 80 explosions per year related to organic products (Abbasi and Abbasi Citation2007). In Germany, the number of cases related to wood, food, and paper rises between 65 and 70 per year (Abbasi and Abbasi Citation2007; Sjöberg Citation2002). In Sweden alone, dust explosions were identified as the origin of 8 of the 79 fires in silos for the period of time comprehended between 1996 and 2003 (Persson and Per Citation2004). Furthermore, a serious dust explosion is officially reported to the Swedish Work Environment Authority once every month, but it is estimated that a dust explosion occurs almost every week (bbb Citation2016).
Dust explosions often go unreported, and the totals reflected may vastly underestimate the actual number explosions in the industry. In fact, it is widely admitted that one dust explosion occurs in each industrialized country every day (Sjöberg Citation2002). This is especially true for the reports gathered internationally, where the reports on incidents is limited, especially for the developing countries.
Examples of large accidents involving organic dusts are unfortunately easy to find, as the starch explosion during the Formosa Fun Coast in New Taipei, Taiwan (Formosa_Fun_Coast_explosion Citation2020) which resulted 15 deaths and 497 injured, the explosion of sugar dust in the Imperial Sugar factory in Georgia, USA (Georgia sugar refinery explosion Citation2020) which left 14 deaths and 42 injured or the grain dust explosion in the village of Blaye, France (Hought Citation2011), which left eleven deaths and one injured. The U.S. Chemical Safety Board (CSB) identified 119 fatalities in 78 of the 281 incidents in their Combustible Dust Hazard Study (CSB), U.S.C.S.a.H.I.B Citation2006) from 2006. The data showed an average of nearly five fatalities and 29 injuries per year. Since 2006, the CSB has conducted five additional investigations into dust-related incidents. These five incidents alone have taken the lives of 27 workers and injured 61 others (Board, U.C.S. Citation2018).
The guidelines and directives for handling combustible dusts in Europe and in the United States are known as the ATEX and NFPA 652, respectively. The former having dedicated directives for workplaces (99/92/EC)(EC Citation2018) and equipment 2014/34/EU (aaa Citation2014; EC Citation2018) while the NFPA 652 (NFPA Citation2019) gives prescriptive requirements regarding the safe handling of combustible dusts and powders in industrial settings. The requirements given by the NFPA 652 are prescriptive and not specific to each substance regardless of the actual hazard potential of the handled dust. This results in requirements that are mostly identical for all combustible dusts which can be classified under the same category. These standardized guidelines and directives specify, in some cases, allow the use of performance-based methods. A performance-based approach based on models and the combustion processes of dusts can enable more accurate and precise predictions, identifying the critical points for reducing risks focusing on life safety and production continuity. It must be noted, however, that using performance-based methods requires reliable data regarding the ignitability of the powders processed at the plant.
Solid materials, such as powders, can ignite if their surface is heated to temperatures high enough to decompose and react with the surrounding oxygen. The combustion of solids is much more complicated than the combustion of gaseous fuels where just homogeneous gas to gas reactions occur, the combustion of solids involves heterogeneous reactions where the oxidizer simultaneously reacts with gaseous compounds produced by pyrolysis and substances at the surface of the burning material.
Combustion of powders can be generally described as the exothermal reactions of the surrounding oxygen with the hot gaseous substances released by the heat decomposition of the solid and the gas to liquid and gas to solid reactions at the surface of the material. Although all these three reactions are relevant for combustion, most of the energy release occurs due to the gas to gas reactions.
The combustion of solids requires the surface temperature of the burning material to be high, leading also to charring and melting. Even though the temperature of the solid material must be high to decompose and release combustible substances, the surface temperature is much lower than the temperature of the flame itself. Most of the materials commence to be decomposed by pyrolysis at temperatures around 300°C and, a further increase in temperature yields to a deeper decomposition of the surface and a release of pyrolysis compounds.
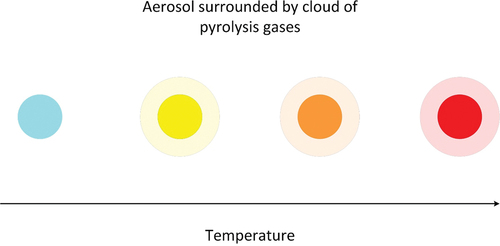
The pyrolysis of solid materials requires of just heat to occur. Although pyrolysis is a term usually used in combustion contexts, pyrolysis occurs when the temperature of a given material reaches a certain level, . Once this level is reached or trespassed, the material releases combustible substances to the environment, which in its turn can be ignited. If enough of these combustible substances is accumulated in a closed space originally containing air, a violent explosion can occur if ignition sources such as a spark or a glowing item enter into contact with the combustible mixture. shows the particle (blue), which is emits a gas cloud as it is heated. Propagating to the right in the figure, the temperature is increased. The particle releases different gas compositions for increasing temperatures.
Figure 1. Aerosol surrounded by cloud of pyrolysis gas.
Hence, products are not only formed during combustion but also in the pyrolysation process. This is found in studies which separately treat the process of combustion from the process of pyrolysation as shown by Brink et al. (Brink and Massoudi Citation1978). Here the composition of CO, CO2, CH4, H, and others are found in the pyrolysis gas from wood particles is measured as a function of pyrolysation temperature, using a flow reactor technique for the study of overall kinetics of the process of pyrolysis. It is found that the fraction of the carbon monoxide in the pyrolysis gas increases with pyrolysation temperature from 0 to a mole fraction of about 70% over an interval of 600–1100 K. The pyrolysis of wood generates high concentrations of CO and others, which is shown by Pitts, Johnsson and Bryner (Bryner, Johnsson, Pitts Citation1994), who performed an experimental study on the formation of carbon monoxide in fires by high temperature anaerobic wood pyrolysis. For low combustion efficiency CO occurs as unburned gaseous fuel at the top of a fixed bed; see the work of Zhou and coworkers (Zhou et al. Citation2005). Yang and coworkers (Yang et al. Citation2007) found low levels of CO in the final char burning period at the fixed bed top which is consumed in the over-bed region. A study on pyrolyzation without combustion is presented in the work of Vigouroux et al. (Zanzi, Sjöström, Björnbom Citation2002) experimentally investigating a free-fall reactor at pilot scale and retrieving the composition of the gas from the rapid pyrolyzation of birch wood. In this experiment combustion is avoided by the introduction of nitrogen. The concentration of carbon monoxide drops from the fuel side throughout the reaction zone of a counter flow diffusion flame; see the work of Drake et al.(Drake and Blint Citation1989), who performed numerical studies on CO = H₂ = N2 counterflow diffusion flames with the focus on the emission of NOx. This finding is confirmed by the work of Di Blasi (Di Blasi et al. Citation1999) who performed a study on the dynamic behaviors of stratified downdraft gasifier on biomass using one step reaction for gases, tars and chars.
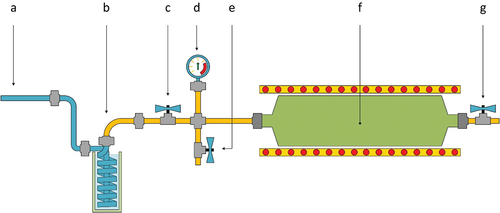
Figure 2. Reactor Gas to be admitted to the GC-MS Heat exchanger to condense heavy hydrocarbons and tar, Sampling valve, Pressure indicator, Purging valve, Reactor installed inside the tubular furnace, Purging valve
“Continuation of the modelling beyond the pyrolysis point requires knowledge of the products of pyrolysis in terms” (Purdy et al. Citation1990). In order to improve modeling and hereby the predictions of fires, in particular gas explosions, the chemistry of the gas needs to be known. Hence, the pyrolysis gas emitted by dust particles are analyzed in the current work.
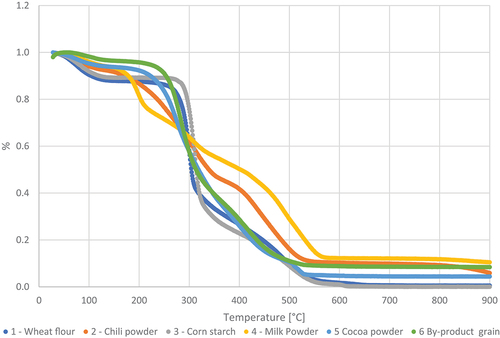
Figure 3. TGA analysis of samples conducted in an air environment.
Unfortunately, there is very little information available about the physical and chemical properties of the compounds released by pyrolysis of powders and dusts present in the alimentary industry. The question rises whether the composition of the pyrolysis gases changes with temperature. Knowledge of these properties is essential to understand the combustion phenomena of dust clouds and is required in order to support the development of numerical models for the prediction and description of dust explosions in these environments. Computerized models together with experimental data of high quality will allow to do parametric studies on the combustion and explosion characteristics of dusts where the physical and chemical properties of dusts can be varied on demand for determining those parameters having most impact on the safety of the processing facility. The goal of the present study is to fill the gap mentioned above
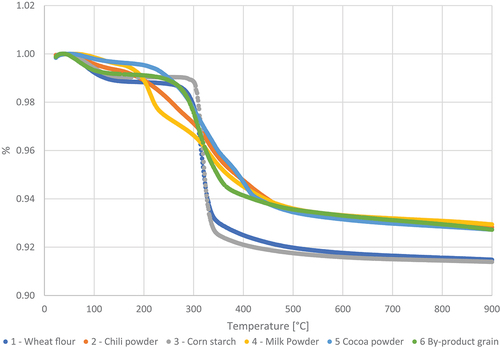
Figure 4. TGA analysis of samples conducted in a nitrogen environment.
This work presents experimental results about phase transitions and decomposition of edible powders when heated under controlled conditions. The chemical composition of the gaseous compounds produced by the pyrolysis of these substances in a nitrogen rich atmosphere is also presented
Methods
The phase transitions and decomposition due to heating as well as the chemical composition of the gaseous compounds produced by the pyrolysis of the following six powders was studied: wheat flour, chili powder, corn starch, milk powder, cocoa powder and by-product of grain.
Phase transitions and decomposition
Thermogravimetry analysis (TGA) was employed for studying phase transitions and decomposition of the aforementioned substances. Thermogravity is a thermal analysis technique which continuously measures the sample weight over time in specified temperature ranges. A sample of each material was put in an inert and thermally stable beaker which sits on a balance, the desired temperature program is set together with which atmosphere to use. When there is a thermally activated process in the material, as oxidation, the mass will change and data about the mass loss rate as function of temperature is recorded. For pyrolysis with carbon-based materials, the measured activity is usually decomposition from an organic material to carbon/ash which is stable at high temperatures.
Thermogravimetric (TGA) of the six samples was performed in both a nitrogen and in an air-filled atmosphere. The samples were analyzed with a TA instrument model STA 449 F33 Jupiter at a constant heating rate of 10 K per 10 min in nitrogen and 20 K per 10 min in air-filled atmosphere, up to a maximum temperature of 900°C.
Pyrolysis products
The chemical composition of the gaseous compounds produced by the pyrolysis of the studied substances was analyzed and determined. The powders were heated in a closed reactor coupled to a GC-MS (gas chromatograph mass spectrometer) where a nitrogen rich atmosphere prevailed. The composition of the gaseous compounds released and produced by pyrolysis was analyzed for the temperature interval comprehended between 100°C and 900°C.
A dust sample of approximately 50 g was placed in a constant volume reactor made of stainless-steel with a volume of 500 ml. Inside the reactor, a nitrogen-rich atmosphere prevailed. Once the dust sample was placed inside the reactor, the reactor was purged and pressurized with nitrogen at an initial pressure of 7 bar. The reactor was then installed inside a tubular furnace which temperature could be controlled on demand. A sketch of the reactor is shown in .
The temperature inside the reactor was increased in intervals of 100°C from ambient temperature to 800°C. The maximum pressure inside the reactor was limited to 10 bar throughout the entire tested temperature interval. The heating rates were kept below 10 K/min to ensure a slow pyrolysis.
At each set temperature, a gaseous sample was obtained. In order to condense heavy hydrocarbons and tar, the sampled gas was cooled in nitrogen filled glass vials before being admitted into the GC-MS.
The employed gas chromatograph mass spectrometer (GC-MS) used to determine the volatile components in the gas samples was an Agilent Technologies 490 GC. The GC-MS uses two column channels, both with backflush, the former is a MolSieve 5A (MS5A) 10 m and the latter a PoraPLOT U (PPU) 10 m. The back-flushing system reverses the flow of the carrier gas after the target compound is detected to discharge residual components in the column from the injection port. Argon and helium were used as carrier gases. The two columns were set up to identify H2, O2, N2, CH4, CO and CO2, C2H4, C2H6, C2H2 and C3H8, respectively. Quantification of the identified components were based on NIST library. The volume proportion of the gases in a sample was determined periodically by means of an integrator.
Results and discussion
The results are presented and discussed in the current section. The section starts out presenting the results from the thermogravimetric analysis, used to identify the temperature domains, where the particles experience large mass loss, being the ranges, where pyrolysis occur. These results are followed by results showing the composition of the pyrolysis gases for the different dusts and finally presenting the polynomial coefficients of the graphs.
Thermogravimetric analysis
The thermal stability of the six different samples measured by the loss in weight through TGA performed with increasing temperature under air and nitrogen (N2) is shown in .
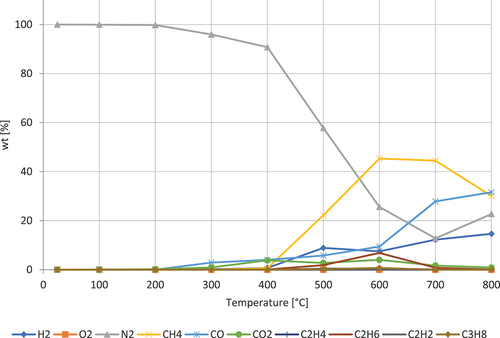
Figure 5. Pyrolysis gases from wheat flour. The formation of gases as function of temperature.
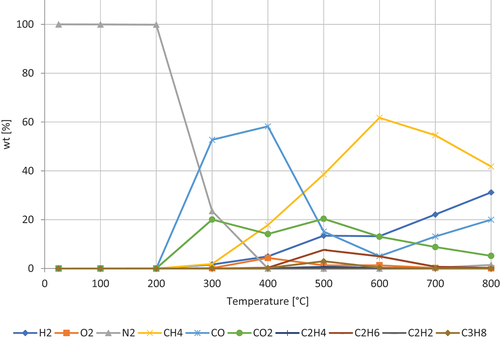
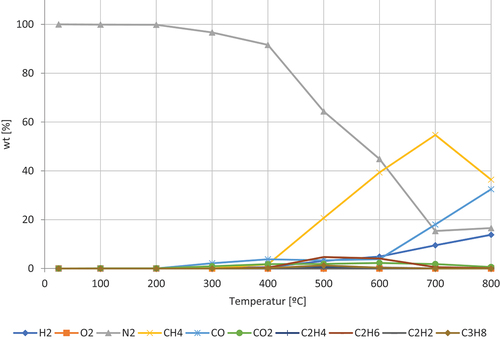
Figure 6. Pyrolysis gases from chili powder. The formation of gases as function of temperature.
All samples displayed a similar decomposition pattern in thermal distribution. The TGA analysis showed a small gradual weight loss at about 70–100°C for both atmospheres. This initial drop in weight is the release of moisture in the sample.
After the first constant stage, most samples have a sharp decrease in weight at 250–300°C reducing at 500–600°C under air and at 300–350°C reducing at 400–450°C under N2. The sample from chili powder, milk powder, and cocoa powder had a more flattened decline from 200°C to 500°C. Under N2 a second constant stage in TGA curves exists up to the limit of 900°C established for the analysis. Under air the steep decline is followed by a more moderately mass loss until a constant stage occurs at 550°C through the end of the analysis at 900°C.
Pyrolysis gases
Methane, carbon monoxide, carbon dioxide, and hydrogen were the primary gases identified in the pyrolysis gases followed by C2-hydrocarbons.
shows the decomposition of wheat flour. The gases dominating are CO, which peaks at around 400 ◦C, and CH4, peaking around 600 ◦C. Furthermore, the concentration of H₂, increases steadily after 300 ◦C and CO2, showing a double peak at 300 ◦C and 500 ◦C. The concentration of O2 has a peak at 400 ◦C. Wheat flour mainly consists of starch (70–75%), protein (10–12%), and the minor components are polysaccharides (2–3%) and lipids (2%) (Goesaert et al. Citation2005). The starch is assumed to be responsible to produce carbon containing molecules and the release of O2. The second peak of CO2 is most likely due to combustion, which can be correlated to the decrease in O2 at 400 ◦C.
shows the decomposition of chili powder. The gases dominating are CH4, which peaks at around 700 ◦C, and CO, steadily increasing after 600 ◦C. Furthermore, the concentration of H₂, increases steadily after 500 ◦C and CO2 shows a peak at 600 ◦C. Chili powder consists mostly of Capsaicin (C18H27NO3)(Bennett and Kirby Citation1968), which is assumed to be responsible for the production of carbon containing molecules and the release of N2.
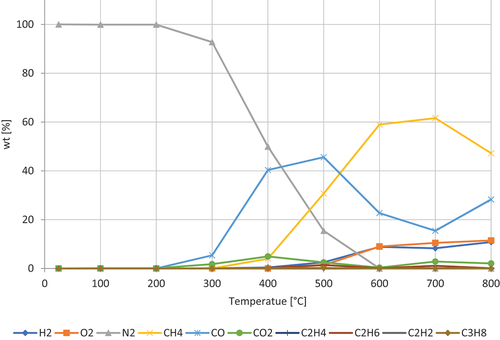
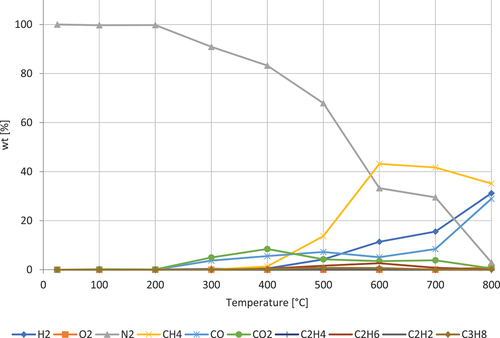
shows the decomposition of corn starch. The gases dominating are CH4, which peaks at around 600 ◦C-700 ◦C, and CO, peaking around 500 ◦C. Furthermore, the concentration of H₂ and O2, increasing steadily after 400 ◦C. CO2 shows a double peak located at 400 ◦C and 700 ◦C. The production of carbon containing molecules and the release of O2 can be explained by the composition of the starch (C6H10O5)n (Corn starch Citation2021). The second peak of CO2 is most likely due to the oxidation. The increase in CO between 700 and 800 ◦C is most likely due to the oxidation of carbon containing molecules such as C2H6.
Figure 7. Pyrolysis gases from corn starch. The formation of gases as function of temperature.
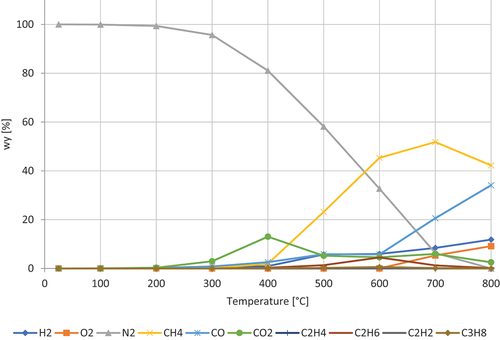
shows the decomposition of dried milk powder. The components of milk powder lactose (36–40%), fat (30–40%),) and milk protein (28–32%) (Moran Citation2012), (Ata and Al Masad Citation2015) . The gases dominating are CH4, CO, and CO2. CH4 peaks at around 700 ◦C, CO is progressively increasing with a higher rate from 600 ◦C. CO2 has a peak at 400 ◦C. Furthermore, the concentration of H₂ and O2, increasing steadily. The increase of the oxygen is due to the decomposition of the lactose (C12H22O11).
Figure 8. Pyrolysis gases from dried milk powder. The formation of gases as function of temperature.
shows the decomposition of cocoa powder. The composition of cocoa powder, C7H8N4O2 is 21,4% protein, 12.10% fat, 7.61% sugar, 36.67% fiber, 8.06% ash, 4.17% water, and 7.25% polyphenol (Osakabe et al. Citation2004). The gases dominating are CH4, CO, and H₂. CH4 peaks at around 600–700 ◦C. CO is progressively increasing with a higher rate from 600 ◦C. H₂ is progressively increasing. CO2 has a double peak at 400 and 600 ◦C.
Figure 9. Pyrolysis gases from cocoa powder. The formation of gases as function of temperature.
shows the decomposition of by-product of grain. The gases dominating are CH4, H₂, CO, and CO2. CH4 peaks at around 600 ◦C. H₂ is progressively increasing. CO is progressively increasing with a higher rate from 700 ◦C. CO2 peaks at 400 ◦C.
Figure 10. Pyrolysis gases from by-product of grain. The formation of gases as function of temperature.
For almost all samples carbon monoxide increased slowly toward 200°C. From 200°C to 600°C the concentration remained constant after which it increased more steeply toward 800°C. Three different powder samples (wheat flour, corn starch, and casting powder) exhibited a different behavior, with a steep increase at 300–400°C followed by a peak at 400–500°C, after which they drop to the same level as the other samples and follow a trend similar to the other samples, at higher temperatures.
The different powders do not follow the same trend with regards to carbon dioxide as with hydrogen and carbon monoxide, as the different samples have different trends. Most samples have a peak at 400°C, followed by a slow decrease in concentration toward 800°C.
The concentration of methane has a strong dependence to temperature. The concentration increases between 300°C and 600°C, at 600–700°C there is a relative maximum, followed by a decrease in concentration. The slope of the increase and decrease follows the same incline/decline.
The rate of concentration for the four primary pyrolysis gases are fitted to a Gaussian or polynomial curve, depending on the pyrolysis gas and temperature interval. Values for calculating the concentration at an any given temperature between 100°C and 800°C are given in .
Table 1. Constants for calculating the concentration of methane and hydrogen.
Table 2. Constants for calculating the concentration of carbon monoxide.
Table 3. Constants for calculating the concentration of carbon dioxide.
When the rate of concentration follows a Gaussian curve that can be calculated as:
where, y = the concentration of the gas in the pyrolysis gas [%] at the temperature T [°C]; a [%] and b [°C] are constants; T0 = the temperature where the maximum concentration can be registered.
Otherwise the rate of concentration can be calculated as
where, y = the concentration of the gas in the pyrolysis gas [%] at the temperature T [°C]; a2, a1 and a0 are constants.
gives the values of constants for calculating the concentration of methane and hydrogen in the pyrolysis gas, between 100°C and 800°C. The rate of methane follows a Gaussian curve whereas hydrogen follows a polynomial curve.
The values for carbon monoxide and carbon dioxide are shown in . The rate of concentration of carbon monoxide and carbon dioxide are more inconsistent and vary in different temperature intervals.
Limitations
The experiments in the nitrogen-rich cases involved fuel containing oxygen. The experiments were run with overpressure, hence, the air entrainment into the apparatus can be neglected.
It needs to be mentioned, that the TGA data refers to an experiment involving a continuous flow, whereas the experiments in the reactor happen in a closed volume. The decrease in weight in the TGA indicates that the retrieved gases origin from pyrolysis until a temperature of 600°C. This limits the applicability of the fitted curves.
Conclusions
The current work delivers experimental results describing phase transitions and decomposition of dusts. Dust particles of different origins are heated, and the temperature-dependent pyrolysis gases are extracted, analyzed and the gas compositions are presented in the current work. Dusts from wheat flour, chili powder, corn starch, milk powder, cocoa powder, and by-product of grain are investigated. The study has the following findings:
Most dusts show a decrease in weight in the TGA in the range [250°C, 600°C] (air) and [300°C, 450°C] (N2). This indicates the temperature interval, where the particles release pyrolysis gases. After that charring can be expected and a little release of gases. The gases detected after that interval are presumably related to gas phase reactions.
It was found that the compositions of the pyrolysis gases change with temperature. Predominantly changing concentrations of carbon monoxide, carbon dioxide, and methane were found in the pyrolysis gases, followed by hydrogen and hydrocarbons, particularly C2-hydrocarbons, at lower concentrations. The varying compositions of the gases consisting of methane, carbon monoxide, carbon dioxide and hydrogen were identified.
Starch containing dusts show produce carbon containing molecules and the release of O2. They also show a double peak for the CO2, where the second peak of CO2 is most likely due to the oxidation, as O2 decreases simultaneously. CH4 peaks around 600–700◦C, CO2 peaks at 400◦C and in case of a double peak at 600 ◦C.
Carbon monoxide increased in the temperature interval of the experiment, reaching its maximum at 800°C. This is the case for all dusts except wheat flour, corn starch and casting powder. There CO peaks at 400–500°C before dropping to the same level as the other samples and follow a trend like the other samples, at higher temperatures. The concentration of methane peaks 600–700°C. The found gas compositions can be used as input for models describing fire and combustion of particles. The current work proposes coefficients for Gaussian polynomials expressing the concentration for the four primary pyrolysis gases. It should be noted that the polynomials describe the composition if the pyrolysis gases in the ranges defining the domain of pyrolysis.
Acknowlegdements
We thank ÅForsk foundation for granting the work with the project 17-492.
Disclosure statement
No potential conflict of interest was reported by the author(s).
Additional information
Funding
References
- 2014. DIRECTIVE 2014/34/EU OF THE EUROPEAN PARLIAMENT AND OF THE COUNCIL on the harmonisation of the laws of the Member States relating to equipment and protective systems intended for use in potentially explosive atmospheres. EEA.
- Abbasi, T., and S. A. Abbasi. 2007. Dust explosions–Cases, causes, consequences, and control. Journal of Hazardous Materials 140 (1–2):7–44. doi:10.1016/j.jhazmat.2006.11.007.
- Ata, M., and M. Al Masad. 2015. Effect of Milk Powder Supplementation on Growth Performance of Broilers. Journal of Agricultural Science 7.
- 2016. Personal communication between SP and Arbetsmiljöverket during. September.
- Bennett, D. J., and G. W. Kirby. 1968. Constitution and biosynthesis of capsaicin. Journal of the Chemical Society C: Organic (4):442. doi:10.1039/j39680000442.
- Board, U.C.S. 2018. Dust Incidents 2006-2017.
- Brink, D. L., and M. S. Massoudi. 1978. FLOW REACTOR TECHNIQUE FOR THE STUDY OF WOOD PYROLYSIS - 1. EXPERIMENTAL. J Fire Flammability 9:176–88.
- Bryner, N. P., E. L. Johnsson, and W. M. Pitts, Carbon Monoxide Production in Compartment Fires: Reduced-Scale Enclosure Test Facility NIST Interagency/Internal Report (NISTIR)-5568, 1994.
- Corn starch. 2021. cited 2021 March 4
- CSB), U.S.C.S.a.H.I.B., Investigation Report – Combustible Dust Hazard Study. 2006.
- Di Blasi, C., G. Signorelli, C. Di Russo, G. Rea. 1999. Product Distribution from Pyrolysis of Wood and Agricultural Residues. Industrial & Engineering Chemistry Research. 38(6):2216–24. doi:10.1021/ie980711u.
- Drake, M., and R. Blint. 1989. Thermal NOx in stretched laminar opposed-flow diffusion flames with CO/H2/N2 fuel. Combustion and Flame 76 (2):151–67. doi:10.1016/0010-2180(89)90064-3.
- EC. 2018. Directive 99/92/EC - risks from explosive atmospheres. european Union.
- Executive, H.a.S. Prevention of dust explosions in the food industry. 2011.
- Formosa_Fun_Coast_explosion. 2020. retrieved.
- Georgia sugar refinery explosion. retrieved 2020 2008
- Goesaert, H., K. Brijs, W. S. Veraverbeke, C. M. Courtin, K. Gebruers, and J. A. Delcour. 2005. Wheat flour constituents: How they impact bread quality, and how to impact their functionality. Trends in Food Science and Technology 16 (1–3):12–30. doi:10.1016/j.tifs.2004.02.011.
- Hought, J. 2011. Dust to Dust. cited 2020.
- Moran, J. 2012. DTU, Rearing young stock on tropical dairy farms in Asia. CSIRO Publishing. Vol. Chapter 9.
- NFPA. 2019. NFPA 652-2019: Standard on the Fundamentals of Combustible Dust, National Fire Protection Association, 652–2019.
- NFPA. 2020. NFPA654: Standard for the Prevention of Fire and Dust Explosions from the Manufacturing, Processing, and Handling of Combustible Particulate Solids.
- Osakabe, N., S. Baba, A. Yasuda, T. Iwamoto, M. Kamiyama, T. Tokunaga, K. Kondo. 2004. Dose-Response Study of Daily Cocoa Intake on the Oxidative Susceptibility of Low-Density Lipoprotein in Healthy Human Volunteers. Journal of HEALTH Science - J HEALTH SCI. 50(6):679–84. doi:10.1248/jhs.50.679.
- Persson, H., and B. Per. 2004. Släckning av Silobränder. SP Arbetsrapport 2004:16, SP Brandteknik. 16.
- Purdy, K. R., C. E. Martin, S. J. Campbell, J. D. Garr, G. M. Graham, C. P. Kerr, M. L. Wyatt. 1990. Empirical model of slow pyrolysis of hardwood chips. Applied Biochemistry and Biotechnology. 24-25(1):49–65. doi:10.1007/BF02920233.
- Sjöberg, J., Riskanalys på Svenska lantmännens Lanläggning i Helsingborg. Report 5104 2002
- Yang, H., R. Yan, H. Chen, D. H. Lee, C. Zheng. 2007. Characteristics of hemicellulose, cellulose and lignin pyrolysis. Fuel. 86(12–13):1781–88. doi:10.1016/j.fuel.2006.12.013.
- Zanzi, R., K. Sjöström, and E. Björnbom. 2002. Rapid Pyrolysis of Agricultural Residues at High Temperature. Biomass and Bioenergy 23 (5):357–66. doi:10.1016/S0961-9534(02)00061-2.
- Zhou, H., A. Jensen, P. Glarborg, P. Jensen, A. Kacaliaiskas. 2005. Numerical modeling of straw combustion in a fixed bed. Fuel. 84(4):389–403. doi:10.1016/j.fuel.2004.09.020.