
 ?Mathematical formulae have been encoded as MathML and are displayed in this HTML version using MathJax in order to improve their display. Uncheck the box to turn MathJax off. This feature requires Javascript. Click on a formula to zoom.
ABSTRACT
Experiments were performed to investigate the ensemble combustion of a linear array of three coaxial liquid oxygen/gaseous hydrogen turbulent non-premixed jet flames. The experimental conditions were carefully controlled to duplicate those of a previous single element experiment as closely as possible, so that the single element flame could be closely compared with the present three element flame. All ensemble and inter-element effects were due to the turbulent combustion only; acoustic effects were intentionally suppressed. Abundant interactions were found both in the time averaged sense as well as in the dynamics of the larger scale motions. The multielement flames were found to be axially longer, and dominant frequencies were found to emerge for the multielement flames that were not present for the single element flames. A dynamic wave amplification mechanism previously identified for single element flames was found to remain present for multielement flames. However, the mechanism did not operate independently for each element in the ensemble, but instead entered into phase relationships with the neighboring elements. The phase relationship possibly encouraged the dynamics between jet flames that allowed the dominant frequencies to emerge. Several indications of such a phase relationship were found, but not all indications were observed to occur all of the time. It is possible that the coordination of the wave amplification mechanism between the flames was weak or intermittent. Other simultaneous processes probably also contributed to the overall flame behavior.
Introduction
In liquid rocket engines, propellants are typically introduced into the combustion chamber through arrays of identical or nearly identical individual injector elements, arranged in patterns over a usually circular plate or dome at the upstream end of the combustion chamber. The number of individual elements in application can range from a few to many hundreds or more. The propellants injected subsequently mix and burn before they are exhausted through a common nozzle to produce thrust (see any basic text on rocket propulsion, for example Sutton and Biblarz Citation2017). In most cases, the mixing and burning process occurs extremely rapidly. For example, in the Space Shuttle Main Engine, it occurred in less than 1 millisecond. Because such injector arrays are often composed of nearly identical elements, it can be attractive to perform as much research and development as possible on only a single one of the elements before combining them into the larger array. When possible, such an approach can effectively reduce experimental and computational development costs. A single element also tends to allow more extensive experimental measurements of detailed processes.
The above reasoning has led to numerous single element studies in the past. Many recent instances of such studies relevant to the current coaxial geometry were reviewed in the predecessor papers to this one (Roa and Talley Citation2019, Citation2021). The predecessor papers also investigated single elements. However, while it has always been recognized that the combustion behavior of an injector ensemble need not be and in most cases probably is not just a simple superposition of isolated single element behaviors, there has recently been more of a trend toward intermediate approaches to address this concern. Such approaches utilize more than a single injector, but considerably fewer than the full number of elements in various subscale representative arrangements. The present study is of this class. In particular, the present study attempts to better understand some of ways in which the ensemble behavior differs from that of a single element.
Several reasons can be anticipated at the outset why the ensemble behavior should be different than a simple superposition of the behavior of single elements. One reason is that not all the elements may be subject to the same initial and/or boundary conditions. For example, outer elements may be bounded in part by a solid wall, which may or may not feature film cooling, while inner elements will be mainly bounded only by other elements. In addition, if multiple elements are fed from common distribution manifolds, as is usually the case, the inlet conditions may not be precisely the same for each element, depending on its position in the manifold. For both the inner and the outer elements, and regardless of their position in manifolds, an important source of difference between the single element and the ensemble behavior can be turbulent combustion interactions that occur among the elements that are not present for isolated elements. The turbulent combustion interactions may be further modified if acoustic waves are present, such as those produced by acoustic combustion instabilities. The further modification by acoustic waves will be considered in a subsequent paper. In this paper, consideration is given only to interactions promoted by the turbulent combustion. A linear array of three coaxial liquid oxygen (LOX) and gaseous hydrogen (GH2) injectors is studied and carefully compared with the behavior of only a single element. The flow conditions are maintained to be as identical as possible, furthering an ideal where the only change is the number of elements present. This study is considered to be useful on its own merits, but it also serves as a baseline for a subsequent study where acoustic waves will be introduced.
In what follows, the relevant literature is reviewed first in section 2, followed by the experimental description in section 3. The results are then presented in section 4 in three parts: (a) flow visualizations, (b) frequency, phase, and spatial mode analysis, and (c) flame wave trajectories. A summary and conclusions are then presented in section 5.
Background
The subject of interactions among arrays of injected flows, namely jets, naturally generalizes to a large number of combustion and non-combustion applications. Villermaux and Hopfinger (Citation1994) performed smoke visualizations of nonreacting simple jets emanating from arrays of round holes in different patterns from a perforated plate in a wind tunnel. For jet Reynolds numbers less than 4x10⁴, self-sustained non-acoustic quasi-periodic oscillations of the jet merging distances were observed. The reason was attributed to packets of turbulent fluid shed from individual jets, that were periodically recirculated upstream into the inter-jet spacing and which could then disrupt the shear layer development of other jets as far as five jets away. An appreciable number of studies on multielement injectors have been performed for gas turbine applications. Worth and Dawson (Citation2012) studied the interaction between two turbulent premixed flames as a function of jet spacing, while Kwong and Steinberg (Citation2020) studied the behavior of one, two, and three interacting turbulent flames as a function of nozzle spacing, with an emphasis on flame blow-off and reattachment. Vignat et al. (Citation2020) studied ignition and combustion instabilities in premixed flames in a full annular configuration. The references cited in these studies provide further entries into the literature. The reader may in addition consult O’Connor, Acherya, and Lieuwen (Citation2015).
The present application concerns liquid rocket combustion, where the injected flame arrays tend to be non-premixed. Even with the focus thereby narrowed, the number of possible geometric configurations and other parametric variations is exceedingly large, depending on thrust class, propellant combination, and many other factors. Here the focus will be on individual elements that have coaxial configurations, where one propellant is injected in a central round jet, surrounded by an annular gap through which the other propellant is injected. Coaxial injection schemes are often but not exclusively used in boost and upper stage engines flowing propellants that are often but not always stored at cryogenic temperatures. Common propellants include cryogenic and non-cryogenic oxygen, hydrogen, and methane, and liquid kerosenes of various mixes, such as RP-1 and JP-8. Example engines using these kinds of elements include the Space Shuttle Main Engine and the RL-10 class of upper stage engines from the United States, the Vulcain 2 engine from Europe, the LE-7A and LE-5B engines in Japan, and the RD-170 and RD-180 engines from Russia.
Specific consideration is given here to the case where the central flow is liquid oxygen (LOX), and the annular flow is gaseous hydrogen (GH2). Many of the prior studies relevant to this paper had as their actual objective the study of combustion instabilities, that is, configurations where not only turbulent combustion but also acoustic waves of significant amplitudes were present. Results in the absence of acoustic waves, which is the concern here, tended to occupy the smaller part of these studies and were often reported mainly to baseline subsequent acoustic results. The review below pertains mostly to these non-acoustic parts; acoustic effects will be considered in a subsequent paper, as mentioned above.
Recent studies include those conducted by many of the major research groups concerned with liquid rocket combustion. Rey et al. (Citation2004) investigated a linear array of three LOX/GH2 coaxial injectors in a configuration similar to that of the present investigation, but with a larger inter-element spacing. The interelement spacing was stated to be 17 mm, but it is not clear whether this dimension refers to the spacing between the centers of the elements, or between their adjacent outer edges, which would be one diameter less than the distance between the centers. The dimensions of the injector elements themselves was not given. However, from the figures it appears that the interelement spacing, measured from center to center, was about 5 LOX diameters. This is compared to 2.8 LOX diameters in the present study. The chamber pressure was lower than the present study (0.9 MPa vs about 3.3 MPa), and the momentum flux ratio (density times the velocity squared of the outer flow divided by that of the inner flow), denoted here as J, was 17. The main intent was to transversely force the three-element linear array acoustically. To provide for the required acoustic drivers, the end elements were not closely bounded by walls. This is in contrast to other studies to be cited below, where the end elements were located close to walls, which sometimes produced distinct behaviors. Only two figures showed results without forcing and no unforced interelement effects were discussed. The available unforced information does not indicate clear evidence of interelement effects upstream until the flames merged approximately 2–3 interelement spacings downstream. On average, with or without acoustics, the three individual flames tended to develop mainly axially without significant deflection toward or away from the center, but the outer edges of the ensemble flame expanded at a small angle. The outer two flames tended to be shorter than the center flame.
The fuel in the Rey et al. (Citation2004) experiment was changed from hydrogen to ambient temperature and subcooled gaseous methane at the same chamber pressure by Richecoeur et al. (Citation2006), (Citation2008), in order to increase the sensitivity to acoustic forcing. The range of momentum flux ratios investigated was from 5 to 20. Once again because of the need for acoustic drivers, the end elements were not closely bounded by walls. At lower flow rates and warmer methane temperatures, the individual flames tended to develop mainly axially with a small expansion angle of the flame ensemble. The ensemble expansion angle increased at lower methane temperatures, and the natural OH* emission fluctuations became larger. Higher flow rates tended to shorten the ensemble of flames. Observation of the entire flame length was often limited by the extent of the window, but when the entire flame was visible, one of the edge flames tended to be longer than the other edge flame and the center flame. However, it is reasonable to hypothesize that this was probably due to a small unintended asymmetry in the flow balance, and that had the small flow imbalance been corrected, both edge flames would have been the same length or slightly shorter than the center flame. Richecoeur et al. (Citation2006b) also performed some preliminary cold flow experiments and large eddy simulations without chemical reactions, which included not only three elements but also five. The results showed even less obvious jet interactions for the unforced flow at this large inter-element spacing. The LES of unreacted LOX/methane jets did not predict jet merging until about 6–7 interelement spacings downstream.
Mery et al. (Citation2013) and Hakim et al. (Citation2015) extended the above results to experimental and computational investigations (respectively) of five linear LOX/methane elements, higher pressures, and more powerful acoustic forcing. Hakim et al. compared LES simulations with the Mery et al. experiment but with a different experimental case than reported in Mery et al. (Citation2013) . Once again, the end elements were not closely bounded by walls, and the majority of the results pertained to the acoustic forcing. Little new insight was gained into unforced interelement effects over what has previously been described in this section, even with five elements. Namely, the unmodulated flow tended to develop mainly axially with a small expansion angle of the ensemble of flames. It was not possible to assess the different lengths of the flames from the experiments due to the limited extent of the windows. The single non-modulated LES result showed individual flame lengths that were all very close.
Hardi, Oschwald, and Dally (Citation2011), (Citation2014), Citation2014b) studied an array of five acoustically forced LOX/GH2 injectors that were not linear, but rather were arranged in a pentad with four injectors at the corners of a square and one injector in the center, at pressures of 4 MPa (subcritical with respect to oxygen) and 6 MPa (supercritical). The inter-element spacing was about half that of Rey et al. (Citation2004), Richecoeur et al. (Citation2006), Citation2006b, (Citation2008), Mery et al. (Citation2013) and Hakim et al. (Citation2015), about 2.6 LOX jet diameters – equivalent to that in the present study. Although the experiment was continuously forced while the frequency was ramped, “off-resonance” conditions were reported where the acoustic amplitudes were low enough for the flow to have been effectively unforced. The off-resonance results showed that the four outer flames deflected outwards somewhat into the spatial gap surrounding them, while the center element was constrained by the four outer elements to develop downstream mainly axially. The intact core length of the center element was found to be significantly longer than predicted by most correlations in the literature obtained from single element studies, and longer than the length of the outer elements.
The tendency for outer elements to deflect outwards if gaps are present was also observed for a much larger number of elements by Urbano et al. (Citation2016) and Schmitt et al. (Citation2017). They performed LES simulations of a full scale 42 element LOX/GH2 engine for both stable and unstable operating conditions. This configuration was not acoustically driven but experienced natural instabilities. The outer elements were closely bounded by walls. Both references noted a marked sudden deflection of the outer flames into the gap next to the wall at about 10 LOX jet diameters downstream. Schmitt et al. (Citation2017) noted a similar sudden expansion of even a single flame at about the same distance, both in simulations and in older experimental data (Juniper et al. Citation2000). Evidently such deflections are related to gas expansion from the inner flames of multiple elements or the inner regions of a single flame, the latter promoted by the gasification of the LOX. Schmitt et al. (Citation2017) showed a curved shape of the axial velocities of the envelope of the 2100 K temperature iso-surfaces across engine, with larger velocities near the center. In contrast to the studies reviewed above, the flame lengths from the central elements were found to be shorter than the outer flames, not longer. This was clearly the case for the unstable condition, and of Urbano et al. (Citation2016) suggests that it was probably the case for the stable condition as well. Since the walls were assumed to be adiabatic, it seems likely that these trends were probably caused by the suppressed bulk and fluctuating velocities near the closely bounded walls, which in turn suppressed turbulent mixing in those regions (the simulated chemistry was infinitely fast). These results for a larger number of elements demonstrate how otherwise identical injector elements need not in general experience identical surrounding conditions, due to larger variations on the scale of the entire engine created in the global flow. Armbruster et al. (Citation2019) experimentally installed windows on the experimental version of the same engine, and concluded from their observations of both stable and unstable operating conditions that “flame-flame interactions should not be neglected in combustion modelling of industrially relevant thrust chamber configurations.”
Marshall et al. (Citation2006), (Citation2007), and Citation2008) studied linear arrays of up to 16 swirl coaxial LOX/methane injectors (inner LOX swirled) in order to determine which configurations of injectors caused the largest acoustic oscillations. Large acoustic amplitudes could mostly not be produced, so in a sense nearly all the results were influenced only by turbulent combustion interactions. Unfortunately, the combustion chamber was not optically accessible and was instrumented only with pressure transducers. Interelement and ensemble effects could not be investigated in any detail, except through integrated measures such as frequency and amplitude.
Unlike Marshall et al. (Citation2006)- (Citation2008)), the linear combustor arrays investigated by various authors from Purdue did develop acoustic instabilities of significant amplitudes. Various numbers of injectors, up to nine, were investigated in linear arrays with various propellants (GOX, vitiated GOX, kerosene, methane, ethane). For all these propellant combinations, the injectors investigated were of the same class, namely gas-centered swirl-coaxial injectors, where the gaseous oxidant (GOX) flows axially in the center of the element, while the hydrocarbon fuel is swirled in a surrounding outer annular region. In a sense, these injector elements were an “inverse” of the other elements reviewed thus far and studied in this paper, in that the central flow was a gas and the outer flow could be a liquid, and was swirled. No acoustic drivers were used and the flow was naturally unstable. The outer elements were closely bounded by walls. Various generations of designs have been used. The most recent experimental configuration is described in Orth et al. (Citation2018) and Gejji et al. (Citation2020), and a summary of previous configurations prior to Orth et al. (Citation2018) and Gejji et al. (Citation2020) may be found in Gejji, Anderson, and Austin (Citation2019) (see also Pant and Wang Citation2019). Most of the information regarding interelement interactions associated with these experimental configurations is found in the various attempts to model these configurations; see for example Harvazinski et al. (Citation2019), Morgan, Shipley, and Anderson (Citation2015), Shipley et al. (Citation2013) and (Citation2014)), Pant and Wang (Citation2019), and Tudisco, Ranjan, and Menon (Citation2016). However, once again most of the behavior investigated pertained to acoustics. Orth et al. (Citation2018) showed one CH* chemiluminescence result during a “stable” portion of a test involving low amplitude acoustics, but the images showed only three of nine elements and not global multielement behavior. The image does seem to show waves in the flames around the periphery of the individual injector flows similar to the results to be discussed later in this paper, and some in-phase side-to-side oscillations of the flames responded to the low level of acoustics. More details regarding inter-element effects were not clear. Tudisco, Ranjan, and Menon (Citation2016) showed some non-acoustically forced results for three linear elements, but the outer elements flowed oxidant only while only the central element was burning, so the results are not closely relevant here. Shipley et al. (Citation2013) presented one simulation of three elements without driving, consisting of decomposed hydrogen peroxide as the oxidant, with RP kerosene fueling the two outer elements and ethane fueling the inner element, at a chamber pressure of about 1 MPa. The inter-element spacing was about 2 center diameters for these very large injectors, and the side wall in this case was very distant. The momentum flux ratio was not reported. The envelope of the highest temperature showed a curved profile with the temperature of the center element extending the furthest downstream. High temperature was also observed along the side walls, presumably due to recirculation. No deflection of the outer flames toward the gap between the outer elements and the distant walls was observed; in fact the outer elements seem to cant slightly toward the center. On the other hand, Harvazinski et al. (Citation2019) showed some time averaged results showing an opposite temperature curvature trend for a 9 element case, where the average envelope of low temperature of the side elements extended further downstream than the center element. However, these were time averages of a transversely acoustically excited case, where the transverse mixing caused by the acoustics was the most intense at the center, an effect which would not have been present had acoustics been absent.
Tamura et al. (Citation2003) experimentally examined a linear array of 12 realistically sized LOX/H2 coaxial injectors at a chamber pressure of 1.7 MPa and an O/F mixture ratio of about 2. The inter-element spacing was about 2.5 LOX diameters, as was the distance from the outer element to the nearest wall. No acoustic forcing was used, although the array experienced chug instabilities when the injector pressure drop was too small. In steady flow, they observed a sudden and dramatic deflection of the outer element toward the chamber wall at about 5 LOX diameters downstream.
Matsuyama et al. (Citation2011) have probably remarked the most extensively on the purely turbulent interactions between multiple elements without acoustics. They performed LES of a linear array of three coaxial injectors flowing gaseous oxygen and gaseous hydrogen at atmospheric pressure and at an initial injection temperature of 300 K. The interelement spacing was 2.4 inner GOX diameters, center-to-center. The outer elements were not close to the chamber walls, on the order of 10 GOX diameters away. The momentum flux ratio was about 0.45. The three flames were found to expand with the same individual expansion angles near the exits, and started to merge at around 5–10 GOX diameters, or 2–4 inter-element spacings, whereas the outer layers of the outer jets continued to expand without limit into the chamber. No local flame extinction was observed. For computational probes located in the outer shear layers, the three turbulent kinetic energy (TKE) spectra based separately on the three different velocity components were all found to obey the usual exponential −5/3 frequency decay law. However, for probes located in the inter-element region, the TKE decay law was −5/3 only for the axial velocity component. It was more rapid, about −3, for the transverse velocity components. It was concluded that the turbulent structure is significantly affected by the interactions between the jets. Matsuyama et al. (Citation2011) also compared the three element simulations with simulations of only a single element under otherwise identical conditions. They found that the expansion of the outer shear layers from the outer elements was very similar to that of the single element. They also found that the length of the GOX jets from the outer elements was similar to that of the single element, but that the length of the GOX jet from the center element was longer.
Thus it appears from the available literature that whether outer flames deflect outward, inward, or not at all, and whether the outer flames are longer or shorter than the inner flames, depends on the details of the configuration, including the proximity of bounding walls. It also appears that gradients on the scale of the entire chamber can cause otherwise identical elements to experience different surrounding conditions, and therefore for their flames to potentially develop differently from element to element. Beyond these effects, further details on ensemble and interelement effects beyond the investigation of Matsuyama et al. (Citation2011) appear to be fairly limited.
In what follows, the dynamics of a linear array of three coaxial LOX/GH2 injectors is examined experimentally as a function of the momentum flux ratio J, with the objective of further elucidating ensemble effects of and the interactions between the elements. This is done by comparing and contrasting the results with that of a previous study where only a single element was examined under more or less identical acoustically undriven conditions (Roa and Talley Citation2019). The experimental setup is described next.
Experimental setup
The experimental set up is illustrated in . Except for the upstream manifolding required to flow three injectors instead of one, the experimental setup is identical to the one used for the previous single element studies Roa and Talley (Citation2019), Roa and Talley (Citation2021). The reader may consult the previous references for details; only a summary description of the setup is given here.
Figure 1. Assembly drawing of the combustion chamber. The diameter of the center window is 101mm.
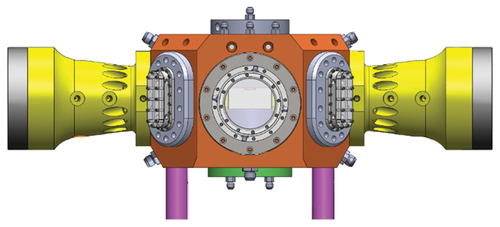
Figure 2. Schematic of the inner channel in the pressure containment.
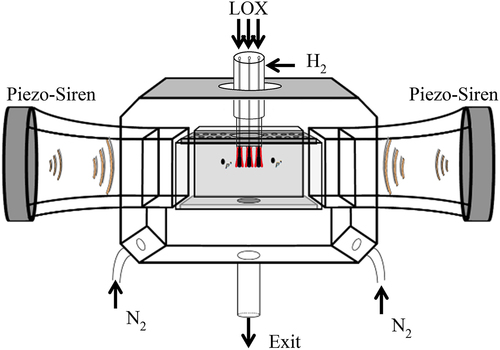
Figure 3. The injector faceplate for: (a) the single element and (b) the multielement. The injectors are in green (LOX) and red (GH2). The gray is the solid injector support. The black external to the gray is GN2 for recirculation suppression (solid circles) and window cooling (slots).
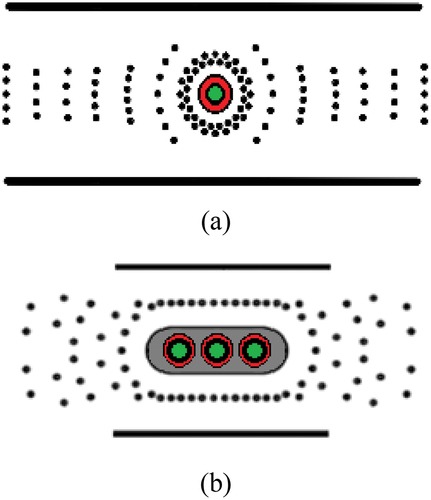
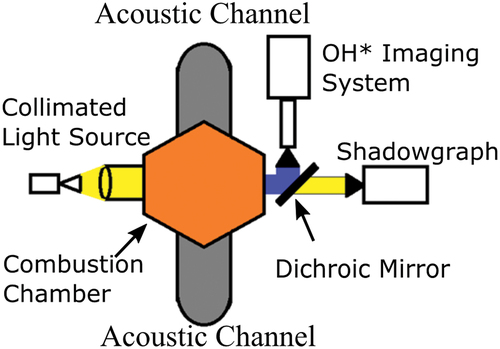
Figure 4. High speed, simultaneous shadowgraph and OH* imaging system.
1 shows an assembly drawing of the experiment. For a size reference, the center round window through which all the visualizations were performed is 101 mm in diameter. shows mainly the outer pressure containment. Located inside the pressure containment is another windowed rectangular channel in which all the combustion is contained. The channel is illustrated schematically in . The inner channel is not designed to contain any pressure, but serves to keep the outer pressure containment and associated pressure seals protected from the hot combustion gases. The entire assembly is pressurized by a purge flow of gaseous nitrogen in the outer chamber and does not rely on the combustion to generate the pressure. The gaseous nitrogen is slightly heated to close to 300 K, to partially mitigate against expansion cooling. The inner channel is protected from the outer purge flow by the windowed channel walls, so that the outer purge does not appreciably affect velocities in the inner channel. The gaseous combustion products are diluted by the purge gases in the outer chamber as they exit through an opening in the bottom of the inner channel, and then all gases exit the outer chamber through a pressure-metering orifice as only a warm gas.
As shown in , the inner channel is also designed to propagate acoustic waves driven by the two piezo-ceramic sirens shown on either end of the channel. However, the sirens were not active for this study. Because of this arrangement, the outer elements of the array were far from any lateral walls. Also indicated by the black dots on the inner channel are high speed pressure transducers mounted on the far wall of the inner channel nominally intended to monitor the acoustics produced by the piezo-ceramic sirens. Although the sirens were not active in this study, the high-speed transducers were nevertheless monitored to detect any naturally occurring pressure waves that might arise. No naturally occurring pressure waves were detected.
The arrangements of the injector exits in the center upper wall of the inner channel are shown in . shows the arrangement previously used for a single injector in Roa and Talley (Citation2019) and Roa and Talley (Citation2021), and shows the arrangement of the linear array of three injectors used in the present study. The black circles are 0.5 mm orifices for a faceplate bleed intended to suppress recirculation in the vicinity of the injectors. The different upstream manifolding required a somewhat different arrangement of the faceplate bleed orifices. Also shown as horizontal bars are slits next to the channel windows to provide film cooling for the windows. The faceplate bleed velocity was regulated to 0.08 m/s, and the window purge velocity was 5.7 m/s.
The dimensions of the individual injector elements were nominally the same as the single element studied previously. The single element inner LOX diameter was 1.4 mm, the LOX post lip thickness was 0.38 mm, and the annular hydrogen outer diameter was 2.82 mm, while in the three-element array the inner LOX diameter was 1.58 mm, the LOX post lip thickness was 0.38 mm, and the annular hydrogen outer diameter was 2.82 mm. The small differences were dictated by differences in fabrication methods. The inter-element spacing of the three-element array was 2.8 LOX diameters, center-to-center, which is representative of flight engines. Long straight sections of manifolding upstream of the exits exceeded 100 hydraulic diameters in length and ensured that fully developed channel turbulence existed as an initial condition for all three injector flows.
The diagnostics arrangement is identical to the one used previously, and is illustrated in . Two synchronized high-speed cameras simultaneously captured back lit shadowgraph images and OH* chemiluminescence images. The framing rates were 25 kHz for the single element results, and 50 kHz for the multielement results. The difference between the framing rates was taken into account whenever comparisons of time resolved dynamics were performed between the single element results and the multielement results. For example, in some cases only every other frame of the higher framing rate multielement results might be used for direct comparison to the lower framing rate single element results. The shadowgraph camera imaged the first eight LOX diameters from the nozzle exit, and the OH* chemiluminescence was imaged 14 LOX diameters from the nozzle exit. Further diagnostic details may be found in the cited references.
All single and multielement experiments were performed at a nominal chamber pressure centered around 3.6 MPa. The actual single element and multielement experimental conditions examined are given in . The outer-to-inner, or gas-to-liquid, momentum flux ratio was selected as the primary flow parameter to be varied. Every attempt was made to set the multielement conditions to be the same as the previous single element conditions, but this could not be accomplished exactly. Therefore, for purposes of discussion, a “J-level” notation “Jx” is adopted here to denote comparisons between configurations where J is almost the same, but not exactly. For example, referring to , J1 refers to the lowest J between the single and multielement configurations, where the actual values happen for these lowest Js to be the same. J2 refers to the next higher magnitude of J, where the comparison is between the single element where J = 0.5 and the multielement where J = 0.46. J3 refers to the next higher magnitude of J, where the comparison is between the single element where J = 1 and the multielement where J = 0.9, and so on. Whether the text refers to J-level or the numerical value of J will be clear from the context. also lists the initial temperatures, bulk velocities, and Reynolds numbers of the various cases.
Table 1. Operating conditions.
Results
(a) Flow visualizations
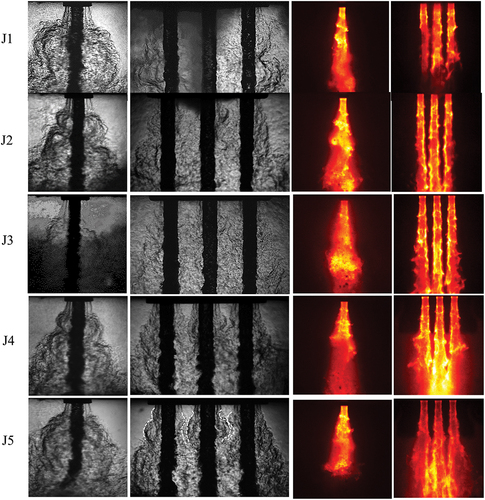
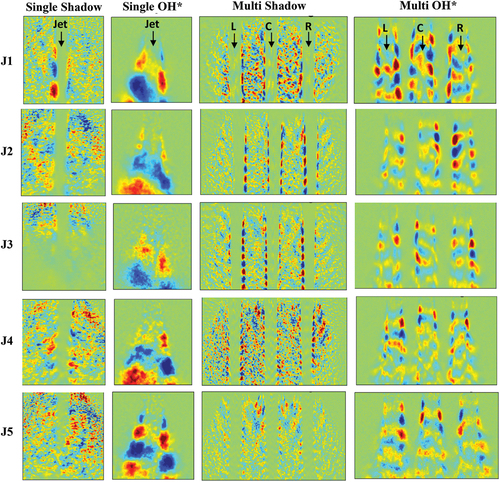
Time-averaged visualizations of the shadowgraphs and OH* emission from the single element and the multielement flows are shown in , as a function of J-level. The time averages were performed over a 0.2 s time interval. Instantaneous realizations of selected frames from the time averages are shown in , and a version of showing the corresponding high-speed videos has been uploaded as supplemental materials. All the single element results shown in these figures and reported below were drawn from data taken in the previous study (Roa and Talley Citation2019), although some of the analysis in this paper is new. All the multielement results are new. Some of the images for both the single element and the multielement are affected by fogging caused by the condensation of water vapor on the windows. For example, this can be seen in more than the lower half of the single element shadowgraph for J3 and the upper periphery of the multielement shadowgraph for J1. The fogging can tend to introduce ambiguities in interpreting the results. However, these ambiguities were not severe enough to affect the conclusions drawn in this paper.
Figure 5. Time averaged images of the single and multielement shadowgraphs and OH* emission, as afunction of J-level. Left two columns– shadowgraphs. Right two columns– OH* emission.
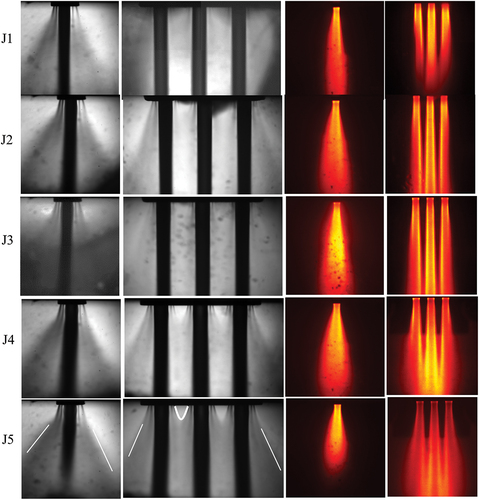
Figure 6. Sampling of instantaneous images from the time averages in .
It may first be noted from both the time averaged and instantaneous OH* images that all the single element and multielement flames separately attach at the injector exits; the flames were not observed to lift or detach under any condition, and there was never a common or group flame anchoring behavior. The time-averaged OH* images in show very localized spots of high intensity where each flame separately anchors at its respective exit. Immediately downstream from each anchoring location, the time-averaged and instantaneous shadowgraphs show four initially straight vertical shadows emanating from each exit. The outer two of these shadows around each element is the outer shear layer between the hydrogen and the ambient. The inner two shadows are those of the flame located between the outer and inner flows. The shadows extend 2–3 LOX diameters downstream in the time averages and can often be seen to extend longer in the instantaneous images, until the distinct visible interfaces are disintegrated by the turbulence. It may next be observed that while there is no evidence of any direct interaction between the liquid LOX cores of the multielement injector in any case, there is a clear interaction in the turbulence of the gas phase. As a result, any interaction between the liquid phases must evidently occur through the gas phase as an intermediary. In the time-averaged shadowgraphs, the shear layers appear to merge within 1–2 LOX diameters in the interelement space. Comparisons with the instantaneous shadowgraphs suggest the actual merging distance may be somewhat longer and more convoluted than it appears from the time averages, as will be discussed further. It is notable that the external spreading half-angles in the shadowgraphs of the outer elements in the multielement configuration are comparable to those of the single elements. An equivalent behavior was noted in the simulations of Matsuyama et al. (Citation2011), even though the central oxygen core was room temperature gas in their case. Evidently, and as was also noted by Matsuyama et al. (Citation2011) the central jet is exposed to different conditions of turbulence than the outer jets. These differences are illustrated by the white lines that have been drawn on the time averaged shadowgraphs at the J5 level. As discussed in Roa and Talley (Citation2019) and Roa and Talley (Citation2021), the reason some of the single element images are slightly canted to one side is because of a small misalignment between centers of the inner round and outer annular geometries which occurred during fabrication. No equivalent misalignment is apparent in the multielement configuration.
It has long been observed that the intact lengths of coaxial jets decrease as the momentum flux ratio J increases. This behavior was confirmed for single elements. The effect is clearly present in the OH* images. It is less evident in the shadowgraphs, but only because the shadowgraph frames do not capture the entire axial extent of the intact jets, except at the highest J-level where it begins to become evident (recall from section 3 that the OH* frames are 14 LOX diameters in axial extent, while the shadowgraph frames are only 8 LOX diameters). An important result of the present investigation is that the multielement flames are clearly longer than the single element flames. This would suggest a shielding effect for the multielement flames which tends to suppress mixing and reaction. Matsuyama et al. also found that the central flame for three elements is longer than that for a single element. However, they also found that the flames from the outer elements were comparable in length to those of the single element, an observation that is not substantiated here. The reason for the difference is unclear, but it could be an effect of the difference between having a gas or a liquid phase in the center core, and also perhaps because Matsuyama et al. (Citation2011) only considered a single flow condition.
An examination of the OH* images appears to show that the multielement flame length is shorter than that of the single element at the lowest J level (J1), which is in contrast to the assertion that the multielement flame lengths are longer. It also appears to show a converging between the three flames at that J level. This effect is probably in fact not an artifact of window fogging. More likely it is because the chamber gases are tending to converge in order to exit through the single common exit opening at the bottom of the inner channel of the chamber. At larger J, this effect appears to be overcome within the field of view by the larger momentum of the outer annular flow, which tends to lengthen the flames and also to increase their lateral spread. Unfortunately, the limited field of view did not allow a more comprehensive characterization of these effects, nor did it allow the length of the multielement flames to be measured as a function of J.
The instantaneous images in allow much more detail to be observed compared to the time averages in . In particular, larger scale “puffs” may be observed in the gas periodically downstream in the single element shadowgraph images. These are related to the wave structures evident in the single element OH* images. The high-speed videos in the supplemental materials show that these waves propagate downstream. The previous single element studies (Roa and Talley Citation2019, Citation2021) identified a “wave amplification mechanism” to explain these waves, as follows. A natural instability initially in the outer hydrogen flow, which may be related to a Kelvin-Helmholtz instability but which may be modified or replaced by other initial disturbance sources such as acoustic waves, causes the location of the flame between the gaseous hydrogen and the liquid oxygen core to fluctuate quasi-periodically relatively closer to or farther away from the LOX core. When the flame is closer to the LOX core, it causes a locally enhanced vaporization of the LOX, which produces local depressions or troughs in the LOX jet, resulting in the wavy structures observed on the LOX core in the shadowgraphs. At the same time, the locally enhanced LOX vaporization and corresponding enhanced combustion produces the large-scale gas puffs indicated above, while the locally enhanced combustion also produces the intensity waves shown on the OH* images. The OH* waves then propagate downstream at a velocity of about half of the arithmetic mean of the outer GH2 velocity and the inner LOX velocity. Further details may be found in Roa and Talley (Citation2019) and Roa and Talley (Citation2021).
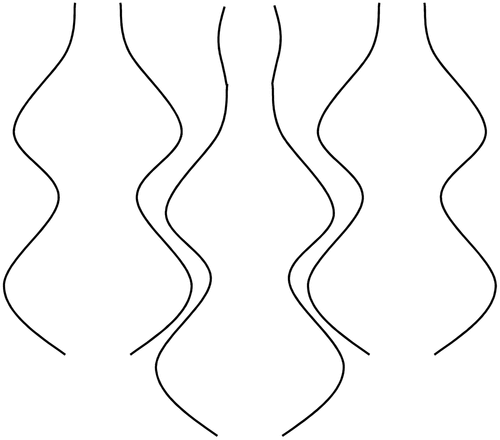
Shown here for the first time is that the wave amplification mechanism appears to remain operative even when multiple jets are present, and to even play a potentially significant role in the inter-element interaction mechanisms. Similar quasi-periodic gas puffs or waves are shown to be present in the instantaneous multielement shadowgraphs, and waves in OH* intensity remain present in the instantaneous multielement OH* images, which also propagate downstream. However, the videos clearly show that the multielement OH* waves propagate more slowly down-stream than for the single element, even for similar J. A further analysis of the OH* wave propagation behavior is given in section 4c. A closer scrutiny of the shadowgraph waves hints at another potentially important effect. In many of the frames a tendency is often observed in the shadowgraphs for the gas waves to “nest” into each other at the upstream locations, one wave bulging while the neighboring wave is contracting. This effect is illustrated by the dashed lines on the shadowgraph for J5, and it is further illustrated in idealized form in . The inner and outer shadows at the top of the frame showing the inner flame and the outer hydrogen shear layer appear to both be contracting toward the center jet at the same time the shadows for the outer jets appear to be expanding away from the outer jets. The bulges between the jets appear to be nesting such that the interface between the bulges from neighboring jets deforms in a sinuous fashion. Downstream, the tendency to nest is dispersed by the background turbulence. This effect is not always clearly present even upstream, such as in the multielement shadowgraph for J3, but it is regularly observed at all J. It is possible the effect is weak and/or intermittent. To the extent that it is present, however, the effect suggests that the wave amplification mechanism may not be operating independently among the jets, but instead might be promoting a fixed phase relationship between them, at least weakly. Further evidence for and discussion of this hypothesis is presented in the next section.
Figure 7. Idealized nesting behavior.
(b) Spectral analysis
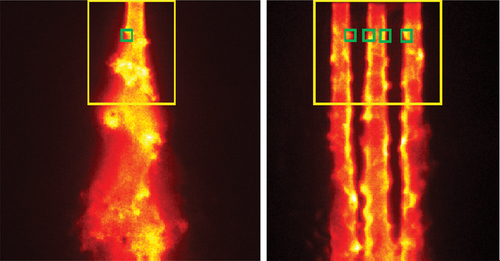
The frequency content of the single and multielement high speed images was queried using three different methods, Power Spectral Densities (PSD), Cross Power Spectral Densities (CPSD), and Dynamic Mode Decompositions (DMD). PSDs decompose single time series data into discrete frequencies (Stoica and Moses Citation2005). DMDs decompose imaging time series data into spatial modes having pure frequencies (Schmid Citation2010). Unlike PSDs, DMDs offer the additional advantage of providing spatial modes. The interrogation regions over which these methods were applied are shown in . The PSD intensities were first integrated over small 16 × 16 pixel regions axially located beginning at 1.5 LOX diameters and extending farther downstream, and localized around the boundaries of the OH* emissions as shown by the small green boxes in . This axial location corresponds roughly to where the hydrogen shear layers begin to merge (see ), although the OH* emission boundaries still remain separate. The DMDs were interrogated over the larger regions indicated by the yellow boxes and containing 6 LOX diameters downstream. For the multielement flows, PSDs could be considered simultaneously from more than one OH* emission boundary. In those cases, Cross Power Spectral Densities (CPSD) were also computed (Stoica and Moses Citation2005). The advantage of CPSDs is that they provide phase information between two signals in addition to frequencies.
Figure 8. Interrogation windows for DMD (large yellow boxes) and PSD (small green boxes) for the single element (left) and the multielement (right).
The spectral methods indicated above were applied in many permutations to the shadowgraph and/or OH* images, to the inner and/or outer shear layers of individual injectors, and to various features between injectors. Fortunately, it was found that the essential physics could be represented by only a small subset of these, which is described below. If desired, the reader may skip directly to the next section without loss of understanding to begin the description of the subset. For the record, the rationale leading to the selection of the subset is briefly outlined in the remainder of this section.
PSDs, CPSDs, and DMDs were computed separately for the shadowgraphs and the OH* images. For the single element, one DMD and one PSD was calculated each for the shadowgraphs and the OH*. For the multielement, two DMDs were computed, one each for the shadowgraphs and the OH*. In addition, two PSDs each (shadowgraph and OH*) were calculated separately for the left, center, and right jets (for a total of six PSDs). From the same time series data, two CPSDs each were calculated for the left-center and the right-center jet pairs. Partial conclusions drawn from all these analyses are as follows:
Although they were not identical, the PSD frequency content was in all cases consistent with the DMD frequency content for a given class of signals (shadowgraphs or OH*).
For the multielement case, and for a given class of signal (shadowgraphs or OH*), although the frequency content was not identical, it was consistent between the left, center, and right jets, and it was consistent between the single PSDs and the CPSDs. Both the frequency and the phase content was consistent between the left-center CPSDs and the right-center CPSDs.
More generally, no significant difference was noted between the left and right jets, except for left-right mirroring, in all respects examined.
As a consequence of the above observations, it was found to be sufficient to consider mainly the DMD and CPSD results in the results to be presented next.
Frequency and spatial mode analysis
DMD spectra are presented in as a function of J-level for the single element shadowgraphs, the single element OH*, the multielement shadowgraphs, and the multielement OH*. The most notable trend is the presence of noticeable frequency peaks for multiple elements that are absent when only a single element is present. The frequency peaks for the multiple elements were the same regardless of whether the DMDs were constructed from 50 kHz framing rate data or effectively from 25 kHz framing rate data by considering only every other frame.
Figure 9. DMD spectra as afunction of J-level for the single element shadowgraphs and the single element OH*, left two columns, and for the multielement shadowgraphs and the multielement OH*, right two columns.
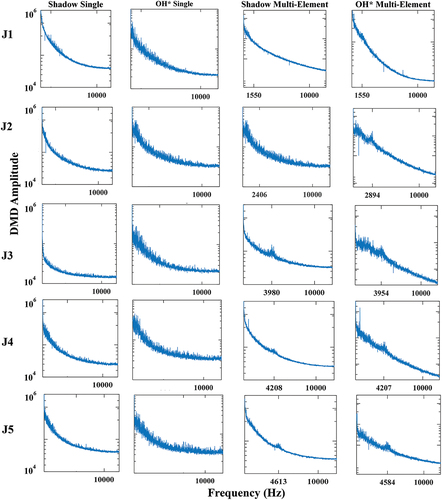
That the single element results should not present dominant frequencies is not unexpected from the literature. The noise radiated from a simple round turbulent jet is notably broadband with no discrete tones (Howe Citation1998). Moreover, Coats (Citation1996) observed that single jets with well-developed initial velocity profiles, such as is the case with this experiment, are unlikely to develop coherent structures in the near-field except in the presence of harmonic forcing, which is absent here. Dahm, Frieler, and Tryggvason (Citation1992) observed that a rich range of coherent (or non-coherent) behavior could be produced in coaxial jets, including complex pairing between the inner and outer shear layers, depending sensitively on the details of the inner and outer initial velocity profiles. This is without considering the further complexities of density variations produced, for example, by the presence of a flame. Thus while the literature cited above does not correspond exactly to the present configuration, there appears to be precedent for anticipating that a dominant frequency might indeed not appear for the single elements.
On the other hand, there appears to be very little if any equivalent precedent in the literature regarding linear arrays of three coaxial chemically reacting jets. It may be remarked that the dominant frequencies noted were obtained from an image analysis. No equivalent frequencies were noted in the pressure signals from the high-speed pressure transducers that were also mounted on the inner channel.
To explore further, the spatial modes from the DMD analysis may be consulted. The dominant frequencies for the multiple elements are demarcated along the abscissa of . The same frequencies are also tabulated in . Also shown for comparison in are the dominant frequencies from the CPSD analysis of the multielement left-center jets, which will become further relevant below. From the CPSDs, an anomalous decrease in frequency is observed from J3 to J4. This is noted but not investigated further here. Notice is taken only of the broader trend that the frequency tends to increase with J, and that the CPSD frequencies are for the most part consistent with the DMD frequencies.
Table 2. Multielement dominant frequencies.
The spatial DMD modes corresponding to the dominant frequencies in are shown in . Since the single elements did not exhibit dominant frequencies, the single element DMD modes shown correspond to the same frequencies as the dominant multielement frequencies. This choice was made in the event that some significant spatial feature might be emerging in the single element, but which might lack enough power to become distinguishable in the spectra when only a single element is present.
Figure 10. DMD spatial modes as afunction of J-level for the single element shadowgraphs and the single element OH*, left two columns, and for the multielement shadowgraphs and the multielement OH*, right two columns. In the right two columns, L, C, and Rdenote the left, center, and right jets, respectively.
Turning first to the multielement DMD modes which directly correspond to the dominant frequencies, it is evident first that very little structure can be seen across the jets themselves in the shadowgraph modes. This is because the visible jets in the raw images are mostly just dark. Structure may be observed across the jets in the OH* modes because the OH* emission occurs around the entire periphery of the jets.
In the multielement shadowgraph modes, the most coherent structures are observed in the narrow surface regions along the edges of the three LOX jets. This corresponds to the surface waves that are formed on the LOX core, in part caused by the wave amplification mechanism. The shadowgraph mode structure in the gaseous inter-element regions and in the regions external to the outer elements is more disorganized, although some suggestions of organization appear external to the outer jets. In particular, no large-scale structures are readily apparent like the gas puffs noted in instantaneous shadowgraphs of . The reason is most likely because the shadowgraph DMD modes correspond to only a single frequency, while the structures observed in are produced by a summation of modes over a range of frequencies. It is perhaps significant that at the highest J, the organized narrow surface structures become less intense and more of the structure moves into the gas phase regions. Possibly this is due to more enhanced jet breakup at higher J, or to more instability in the average position of the jet, or to both.
The multielement OH* modes reflect mainly the propagating wave structures around the jets noted previously. In this case the modes compare more readily to the instantaneous images. The colored lobes appear to form in pairs across the jets, often in a slanted manner, but also sometimes horizontally straight across. The pairs appear to correspond to OH* waves. Often the center pair seems to be of an opposite color to the outer pairs at the same axial distance. To the extent this is true, it would tend to suggest an out-of-phase relationship between the modes. However, this is not always readily apparent in all cases.
For the single elements, a dominant mode frequency was not directly observed but the mode was chosen from the dominant multielement frequency, as indicated above. An examination of the results does not present clear evidence of any kind of emerging spatial structure, although this cannot be entirely ruled out. Once again, the shadowgraph modes are mostly featureless across the jet, whereas the OH* modes extend around the jet periphery. The shadowgraph modes show evidence of narrow, locally organized regions in the vicinity of the LOX jet surface only at the smallest J-level. The organization does not appear to persist as strongly to larger J as it does in the multielement case. The single element shadowgraph modes do suggest more organization in the gas phase regions. Once again, the single element OH* modes reflect mainly the propagating wave structures as in the multielement case, and the lobe pairs of the same colors indicating the OH* waves generally have a slanted structure. Two main differences may be observed between the single element and the multielement modes: the single element structures are broader laterally than the equivalent regions around each jet in the multielement case, and the axial wavelengths of the single element OH* modes appear to be longer than those of the multielement OH* modes.
Phase analysis (multielement)
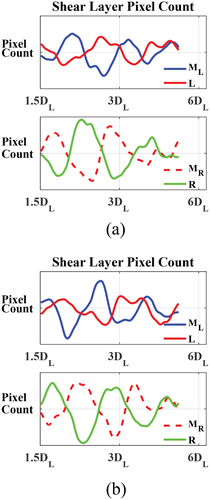
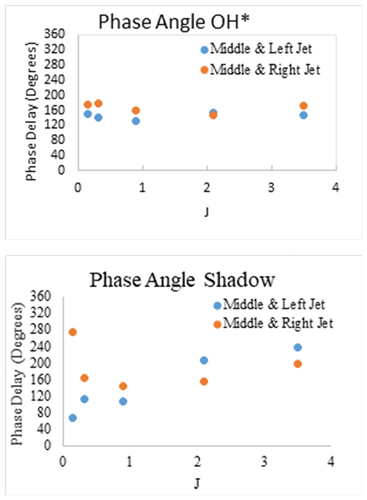
An advantage of the CPSD analysis is that it provides information on the phase relationship between the component time series. plots the phase relationship of the OH* signals between the left and center jets as a function of frequency, for J = 0.15 (J1). The dominant frequency from is shown as the vertical green line. The phase relationship is shown to become more nearly constant within a narrow range centering around 160 deg in the vicinity of the dominant frequency. To examine this further, phase averages of the OH* videos were performed at the dominant frequency for various values of the angular phase at that frequency. The intensity variation was then recorded along lines aligned with four of the shear layers. An example of one such phase average is shown in , with the lines labeled L, ML, MR, and R (left, middle-left, middle-right, and right). shows the variation of pixel count along these lines at two phase angles separated by half a cycle of the dominant frequency. It is seen that the pixel counts maintain a phase separation consistent with approximately 160 deg between the center and outer jets. Animations made with steadily advancing phase angles (not shown) indicate the waves in steadily advance with a more or less constant phase relationship.
Figure 11. OH* CPSD phase delay vs frequency for J=
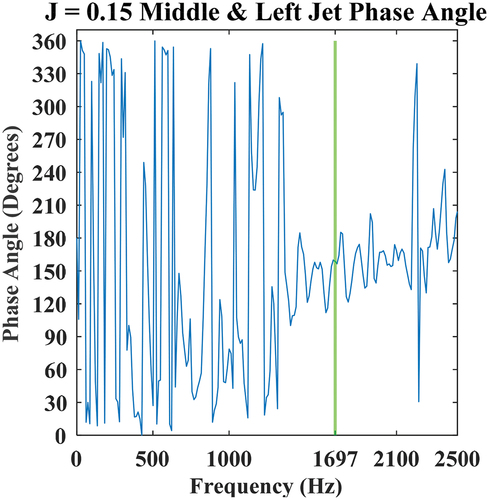
Figure 12. OH* phased average at the natural frequency. The temporal average is subtracted.
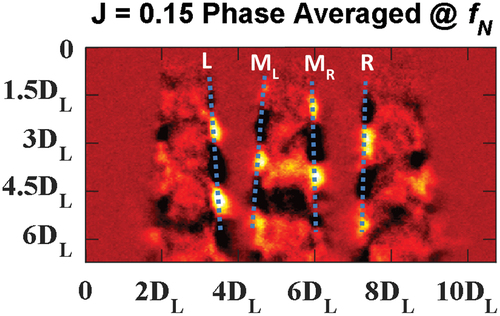
Figure 13. The pixel intensity along the shear layers of the phased average OH* from , where (a) and (b) are separated by half the cycle of the dominant frequency.
The CPSD phase analysis above was repeated for both OH* and shadowgraphs for all J. The results are shown in . The OH* phase delays remain remarkably consistent at around 160 deg for all J. also shows the CPSD phase analysis from the shadowgraphs. In that case there is more variation with J and a possible anomaly at the lowest J, but the results are generally consistent with the OH* analysis.
Figure 14. CPSD phase analysis for all J. The top is for OH* and the bottom is for shadowgraphs.
Discussion of the spectral analysis
The CPSD phase analysis just presented represents the strongest evidence thus far that the wave amplification mechanism producing the wave structures may not operate completely independently among the three jets. Instead, it suggests they may be entering into a more or less fixed phase relationship (phase locking) which is nearly out-of-phase. This possibility was also suggested by the wave “nesting” behavior often observed in the instantaneous shadowgraphs illustrated in , and also by those instances when the center lobe pair in the OH* DMD modes in appears to be of opposite color to the outer lobe pairs at the same axial distance. It may be observed from the instantaneous shadowgraph evidence that the lateral extent of the large-scale gas puffs from the jets is easily large enough to cross the space between the elements to provide the necessary inter-element communication. The lateral large-scale motion could also cause the frequency decay exponent of the statistical interpretation of the lateral components of turbulence to occur at an apparently different rate than the axial components of turbulence, as observed by Matsuyama et al. (Citation2011). However, this was not specifically examined.
As it turns out, the characteristic times required for these large-scale gas puffs to cross the inter-element distance may be estimated from the high-speed videos, and the inverse of these times may be interpreted as frequencies. Based on such an estimate of the time required for a gas puff to cross the distance to an adjacent element, and result in another gas puff returning to the original element, the estimated frequencies are given in as a function of J, and compared with the measured CPSD frequencies. The comparisons are favorable. Whatever the inter-element communication mechanism actually is, an amplification mechanism is evidently also involved, as evidenced by the presence of dominant frequencies for three elements that are not present when there is only one element.
Table 3. Comparison of CPSD frequencies with frequencies based on round trip of a transverse wave (Hz).
The above observations should be interpreted as strong circumstantial but not conclusive evidence for phase locking between wave amplification mechanisms. Not all of the supporting evidence is observed all of the time. As remarked earlier regarding the shadowgraphs, it is possible that the mechanism is weak and/or intermittent. It seems likely that it may be present simultaneously along with other mechanisms that also contribute to the total behavior. Further corroborating evidence from other experiments or simulations is required.
(c) Wave trajectories
In the previous single element research, an image analysis was performed in which individual OH* waves could be tagged and their trajectories (axial position vs. time) tracked downstream. Histograms were then produced from the trajectories showing distributions of wave velocities and wavelengths. See Roa and Talley (Citation2019) for details. The same analysis was repeated and applied to the present multielement results. The resulting histograms are shown in . The multielement wave trajectories were analyzed separately for the left, center, and right jets, but the statistics were found to be the same for each. Accordingly, only the statistics for the center jet are shown in , compared with those of the single element. For the velocity histograms, the bulk exit velocities of the LOX and the hydrogen are also shown as the colored vertical lines for comparison.
Figure 15. Histograms of velocities and wavelengths of OH* waves. The green vertical line is the bulk velocity of the LOX. The red vertical line is the bulk velocity of the hydrogen.
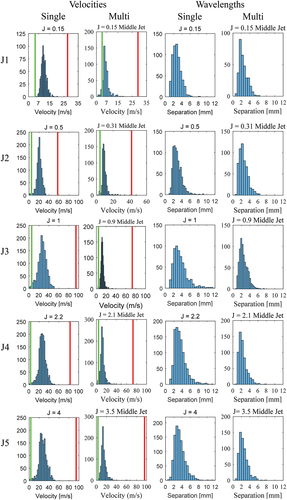
The means and standard deviations from the histograms in are given in . Two trends can be identified. The first is that the mean multielement OH* wavelengths are somewhat smaller than for those of the single elements. The second is that the mean OH* wave velocity is considerably smaller for the multielement waves than for the single element waves. This quantifies the qualitative observation made in the flow visualization of section 4a that the multielement waves appear to be moving slower. However, in all cases there is a considerable width to the distributions. In particular, in the case of the wavelengths, the standard deviation approaches 30% of the mean.
Table 4. Means and standard deviations (δ) of histograms.
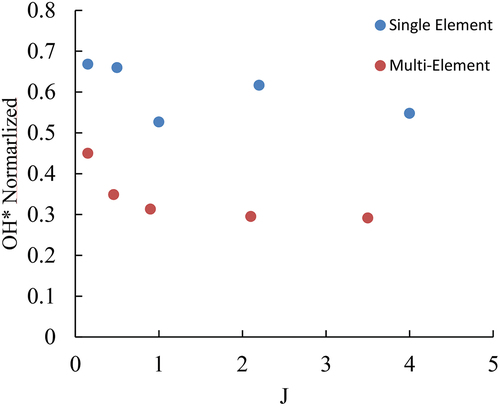
A normalized OH* wave velocity was defined for the previous single element results as
It was found in Roa and Talley (Citation2019) and Roa and Talley (Citation2021) that the single element normalized velocity was independent of J to within a narrow range, U* = 0.52 to 0.66. The same results are replotted in , along with the results from the present multielement analysis. The smaller multielement normalized wave velocities are found to range from 0.3 to 0.45, remaining near the lower value of nearly 0.3 for J > 1. The lower wave velocities would be consistent with possibly enhanced inter-element mixing for multiple elements which could produce a more uniform, lower bulk average axial velocity in the inter-element gas phase than would be anticipated from a consideration of the bulk exit velocities alone. The single element results would be less affected by such mixing so that the gas velocity may be locally higher in the vicinity of the waves.
Figure 16. Normalized wave velocities as a function of J.
Summary and conclusions
Inter-element effects in a linear array of three identical coaxial liquid oxygen/gaseous hydrogen turbulent non-premixed jet flames were investigated experimentally, and compared with previous experiments on a single element jet flame. Careful consideration was given to performing both experiments under conditions that were as identical as possible. In particular, both experiments were performed in the same experimental facility where the only difference as much as possible was the presence of different manifolding required to flow one or three elements. Only inter-element effects due to the presence of turbulent combustion were present; no measurable acoustic waves were found.
The results revealed that ample interactions existed between the elements. The interactions were evident both in the mean as well as from an examination of the transient dynamics of the large-scale structures. All interactions occurred through the gas phase and not directly between the liquid cores. Interactions that were evident in the mean included the merging of the inner gaseous shear layers from the individual jets, and measurably longer multielement flame lengths. The outer shear layers of the outer jets behaved similarly to the unconstrained shear layers from single elements.
High-speed visualizations showed that a wave amplification mechanism first identified for single elements remained present for multiple elements. The wave amplification mechanism occurs when fluctuations in the flame position near the LOX core causes fluctuations in LOX vaporization rates, leading to waves in the flame and to large scale wave structures in the subsequent expanding combustion gases. It was found that the multielement flame waves, as revealed by high-speed emission OH* visualization, propagated downstream more slowly than equivalent waves in the single elements for the same momentum flux ratios. It was hypothesized that this could be due to inter-element mixing that made the gas phase more uniform and caused its average bulk velocity in the vicinity of the waves to be slower.
Multiple indications were found that the wave amplification mechanism was not operating independently between the three jets but rather was tending to lock into fixed phase relationships among the elements. Dominant frequencies arose in the multielement flames that were absent in the single element flames. The frequencies were consistent between measurements by more than one method, namely Power Spectral Densities (PSD), Cross Power Spectral Densities (CPSD), and Dynamic Mode Decomposition (DMD). All the frequencies were obtained from image analysis; none of the frequencies was detected by high-speed pressure measurements. CPSD measurements between the shear layers of different flames revealed that the OH* emissions from the shear layers were nearly out of phase with each other. The waves tended to propagate downstream at this fixed phase. Moreover, the waves were found to be nearly out of phase at all momentum flux ratios. Shadowgraph visualizations of the large-scale gas expansion waves suggested a nesting mechanism that could allow these large scales to enter fixed phase relationships, at least partially. The lateral extent of the large scales was sufficient to provide the necessary inter-element communication across the distances between the jet flames. The out-of-phase relationship between shear layers was also corroborated in part by the DMD modes. It was concluded that evidence for the wave amplification mechanism to enter fixed phases between the jet flames was circumstantially strong but not conclusive. Not all the supporting evidence was observed all of the time. It is possible that the mechanism was weak or intermittent. It was likely present simultaneously along with other mechanisms that contribute to the total behavior.
Supplemental Material
Download MS Power Point (117.8 MB)Acknowledgments
The authors gratefully acknowledge the invaluable technical support of Mr. Randy Harvey, without whose efforts this experiment would not have been possible, and the assistance of Dr. Miguel Plascencia in acquiring the data.
Disclosure statement
No potential conflict of interest was reported by the author(s).
Supplemental data
Supplemental data for this article can be accessed on the publisher’s website
Correction Statement
This article has been republished with minor changes. These changes do not impact the academic content of the article.
Additional information
Funding
References
- Armbruster, W., J. S. Hardi, D. Suslov, and M. Oschwald. 2019. Injector-driven flame dynamics in a high-pressure multielement oxygen–hydrogen rocket thrust chamber. J. Propul. Power 35 (3):632. doi:10.2514/1.B37406.
- Coats, C. M. 1996. Coherent structures in combustion. Prog. Energy Combust. Sci 22 (5):427. doi:10.1016/S0360-1285(96)00011-1.
- Dahm, W. J. A., C. E. Frieler, and G. Tryggvason. 1992. Vortex structure and dynamics in the near field of a coaxial jet. J. Fluid Mech 241:371–402. doi:10.1017/S0022112092002088.
- Gejji, R., W. Anderson, and B. L. Austin 2019. Transverse combustion instabilities in a high pressure multielement combustor. Paper AIAA 2019-3947. Presented at 2019 AIAA Propulsion and Energy Forum, 19-22 August 2019, Indianapolis, Indiana.
- Gejji, R. M., A. Lemcherfi, Strelau, W. E. Anderson, and C. D. Slabaugh 2020. Combustion response of shear coaxial injectors to transverse combustion instabilities. Paper AIAA-202-0424. Presented at 2020 AIAA SciTech Forum, 6-10 January 2020, Orlando, Florida.
- Hakim, L., A. Ruiz, T. Schmitt, M. Boileau, G. Staffelbach, S. Ducruix, B. Cuenot, and S. Candel. 2015. Large eddy simulations of multiple transcritical coaxial flames submitted to a high-frequency transverse acoustic modulation. Proc. Combust. Inst 35 (2):461. doi:10.1016/j.proci.2014.05.142.
- Hardi, J., M. Oschwald, and B. Dally. 2011. Flame response to acoustic excitation in a rectangular rocket combustor with Lox/H2 propellants. CEAS Space J 2 (41278):41. doi:10.1007/s12567-011-0020-z.
- Hardi, J. S., S. K. Beinke, M. Oschwald, and B. B. Dally. 2014b. Coupling of cryogenic oxygen–hydrogen flames to longitudinal and transverse acoustic instabilities. J. Propul. Power 30 (4):991. doi:10.2514/1.B35003.
- Hardi, J. S., H. C. Gomez Martinez, M. Oschwald, and B. B. Dally. 2014. LOx jet atomization under transverse acoustic oscillations. J. Propul. Power 30 (2):337. doi:10.2514/1.B34979.
- Harvazinski, M. E., R. M. Gejji, D. G. Talley, M. R. Orth, W. E. Anderson, and T. L. Pour-point Modeling of transverse combustion instability. Paper AIAA 2019-1732. Presented at 2019 AIAA Scitech Forum, 7-11 January, San Diego, California.
- Howe, M. S. 1998. Acoustics of fluid-structure interactions. Cambridge: Cambridge University Press.
- Juniper, M., A. Tripathi, P. Scouflaire, J.-C. Rolon, and S. Candel. 2000. Structure of cryogenic flames at elevated pressures. Proc. Combust. Inst 28 (1):1103. doi:10.1016/S0082-0784(00)80320-3.
- Kwong, W. Y., and A. M. Steinberg. 2020. Effect of internozzle spacing on lean blow-off of a linear multinozzle combustor. J. Propul. Power 36 (4):540. doi:10.2514/1.B37713.
- Marshall, W., S. Pal, R. Woodward, R. J. Santoro, R. Smith, G. Xia, V. Sankaran, and C. L. Merkle 2006. Experimental and computational investigation of combustor acoustics and instabilities, Part II: Transverse modes. Paper AIAA 2006-538. Presented at 44th AIAA Aerospace Sciences Meeting, 9–12 January, Reno Nevada.
- Marshall, W. M., S. Pal, and R. J. Santoro 2008. Combustion instability studies in a rectangular rocket chamber. Paper AIAA 2008-4656. Presented 44th AIAA/ASME/SAE/ASEE Joint Propulsion Conference & Exhibit, 21-23 July, Hartford, Connecticut.
- Marshall, W. M., S. Pal, R. D. Woodward, and R. J. Santoro 2007. Experimental study of transverse combustion instabilities in a multielement, rectangular rocket chamber. Paper AIAA 2007-558. Present at 43rd AIAA/ASME/SAE/ASEE Joint Propulsion Conference & Exhibit, 8 - 11 July 2007, Cincinnati, Ohio.
- Matsuyama, S., J. Shinjo, S. Ogawa, and Y. Mizobuchi 2011. LES of H2/O2 coaxial jet flames in a multiple-injector combustor. Paper AIAA 2011-0325. Presented at 49th AIAA Aerospace Sciences Meeting, 4–7 January, Orlando, Florida.
- Mery, Y., L. Hakim, P. Scouflaire, L. Vingert, S. Ducruix, and S. Candel. 2013. experimental investigation of cryogenic flame dynamics under transverse acoustic modulations. C. R. Mec 341 (1–2):100. doi:10.1016/j.crme.2012.10.013.
- Morgan, C. J., K. J. Shipley, and W. E. Anderson. 2015. Comparative evaluation between experiment and simulation for a transverse instability. J. Propul. Power 31 (6):1696. doi:10.2514/1.B35759.
- O’Connor, J., V. Acherya, and T. Lieuwen. 2015. Transverse combustion instabilities: acoustic, flame mechanics, and flame processes. Prog. Energy Combust. Sci 49. 1.
- Orth, M. R., C. Vodney, T. Liu, W. Z. Hallum, T. Pourpoint, and W. E. Anderson 2018. Measurement of linear growth of self-excited instabilities in an idealized rocket combustor. Paper AIAA 2018-1185. Presented at 2018 AIAA Aerospace Sciences Meeting, 8-12 January 2018, Kissimmee, Florida.
- Pant, T., and H. Wang 2019. Flamelet modeling of transverse thermo-acoustic instability in a multielement combustor. Paper AIAA 2019-1235. Presented at 2019 AIAA Scitech Forum, 7-11 January 2019, San Diego, California.
- Rey, C., R. Ducruix, F. Scouflaire, P. Vingert, and L. Candel, S 2004. High frequency combustion instabilities associated with collective interactions in liquid propulsion. Paper AIAA 2004-3518. Presented at 40th AIAA/ASME/SAE/ASEE Joint Propulsion Conference and Exhibit, 11 - 14 July 2004, Fort Lauderdale, Florida.
- Richecoeur, F., S. Ducruix, P. Scouflaire, and S. Candel. 2008. Experimental investigation of high-frequency combustion instabilities in liquid rocket engine. Acta Astronaut. 62 (1):18. doi:10.1016/j.actaastro.2006.12.034.
- Richecoeur, F., P. Scouflaire, S. Ducruix, and S. Candel. 2006. High-frequency transverse acoustic coupling in a multiple-injector cryogenic combustor. J. Propul. Power 22 (4):790. doi:10.2514/1.18539.
- Richecoeur, F., P. Scouflaire, S. Ducruix, and S. Candel 2006 b, “Interactions between propellant jets and acoustic modes in liquid rocket engines: Experiments and simulations. Paper AIAA 2006-4397. Presented at 42nd AIAA/ASME/SAE/ASEE Joint Propulsion Conference & Exhibit, 9 - 12 July 2006, Sacramento, California.
- Roa, M., and D. G. Talley. 2019. Wave dynamic mechanisms in coaxial hydrogen/liquid-oxygen jet flames. Journal of Propulsion and Power 35 (2):369. doi:10.2514/1.B37079.
- Roa, M., and D. G. Talley. 2021. Transverse acoustic forcing of gaseous hydrogen/liquid oxygen turbulent shear coaxial flames. J. Propul. Power 37 (2):261. doi:10.2514/1.B38084.
- Schmid, P. J. 2010. Dynamic mode decomposition of numerical and experimental data. J. Fluid Mech 656:5. doi:10.1017/S0022112010001217.
- Schmitt, T., G. Staffelbach, S. Ducruix, S. Gröning, J. Hardi, and M. Oschwald 2017. Large-eddy simulations of a sub-scale liquid rocket combustor: influence of fuel injection temperature on thermo-acoustic stability. Paper EUCASS 2017-352. Presented at 7th European Conference for Aeronautics and Space Sciences, 3-6 July, 2017, Milan, Italy.
- Shipley, K., C. Morgan, W. A. Anderson, M. E. Harvazinski, and V. Sankaran 2013. Computational and experimental investigation of transverse combustion instabilities. Paper AIAA 2013-3992. Presented at 49th AI-AA/ASME/SAE/ASEE Joint Propulsion Conference, 14-17 July 2013, San Jose, California.
- Shipley, K. J., W. E. Anderson, M. E. Harvazinski, and V. Sankaran 2014. A computational study of transverse combustion instability mechanisms. Paper AIAA 2014-3680. Presented at 50th AIAA/ASME/SAE/ASEE Joint Propulsion Conference, 28-30 July, Cleveland, Ohio.
- Stoica, P., and R. Moses. 2005. Spectral analysis of signals. Upper Saddle River, New Jersey: Prentice Hall.
- Sutton, G. P., and O. Biblarz. 2017. Rocket propulsion elements, 9th ed. New Jersey: Wiley. Hoboken.
- Tamura, H., H. Sakamoto, M. Takahashi, M. Sasaki, T. Onodera, T. Tomita, and W. Mayer 2003. Observation of LOX/hydrogen combustion flame in a rocket chamber during chugging instability. Paper AIAA 2003-2756. Presented at 39th AIAA/ASME/SAE/ASEE Joint Propulsion Conference and Exhibit, 20-23 July 2003, Huntsville, Alabama.
- Tudisco, P., R. Ranjan, and S. Menon 2016. Numerical investigation of transverse forcing in a multielement, shear-coaxial, high pressure combustor. Paper AIAA 2016-2155. Presented at 54th AIAA Aerospace Sciences Meeting, 4-8 January 2016, San Diego, CA.
- Urbano, A., L. Selle, G. Staffelbach, B. Cuenot, T. Schmitt, S. Ducruix, and S. Candel. 2016. Exploration of combustion instability triggering using large eddy simulation of a multiple injector liquid rocket engine. Combust. Flame 169:129. doi:10.1016/j.combustflame.2016.03.020.
- Vignat, G., D. Durox, T. Schuller, and S. Candel. 2020. Combustion dynamics of annular systems. Combust. Sci. Technol 192 (7):1258. doi:10.1080/00102202.2020.1734583.
- Villermaux, E., and E. J. Hopfinger. 1994. Periodically arranged co-flowing jets. J. Fluid. Mech 263:63. doi:10.1017/S0022112094004039.
- Worth, N. A., and J. R. Dawson. 2012. Cinematographic oh-plif measurements of two inter-acting turbulent premixed flames with and without acoustic forcing. Combust. Flame. 159 (3):1109. doi:10.1016/j.combustflame.2011.09.006.