
 ?Mathematical formulae have been encoded as MathML and are displayed in this HTML version using MathJax in order to improve their display. Uncheck the box to turn MathJax off. This feature requires Javascript. Click on a formula to zoom.
ABSTRACT
Thermal stratification may switch the combustion mode from deflagration to spontaneous (auto-ignition) in spark-ignition engines leading to knock. Despite the available numerical and experimental works, an analytical and systematic method on the role of local thermal stratification on the combustion mode is still missing. Particularly, the effects of heat diffusion before ignition in negative temperature coefficient (NTC) chemistry of gasoline surrogates are typically ignored. In this study, an a-priori diagnostics tool is provided to separate the deflagration and auto-ignition combustion modes by considering the diffusion effects, based on two parameters: stratification wavelength () and amplitude (
). The diagnostics tool is an extension of Zeldovich’s theory to transient problems by solving the diffusion equation and considering the flame and ignition timescales. It is found that 1) The theory is valid against one-dimensional numerical simulations under different average temperatures and pressures. 2) NTC chemistry promotes spontaneous ignition at both low and high pressures. 3) In the presence of NTC chemistry, the transition region between the two combustion modes is broadened. A third blended mode is observed (spontaneous ignition assisted flame) with front speeds
. 4) Finally, estimation of the knock propensity from the generated maps is related to the surrogates’ octane sensitivities.
Introduction
The pathway toward using environmentally friendly fuels and exploiting higher thermal efficiencies in internal combustion engines has led to developments in fuel composition and combustion strategies in both Spark Ignition (SI) and Compression Ignition (CI) engines. Concerning the SI (gasoline fueled) engines, the major parameters affecting the engine efficiency are engine knock and emissions (Sarathy, Farooq, Kalghatgi Citation2018; Wang, Liu, Reitz Citation2017). While deflagration is the preferred mode of combustion to avoid knock in SI engines, engine knock is generally induced by auto-ignition of the end-gas and the subsequent pressure wave generation (Wang, Liu, Reitz Citation2017). Therefore, it is of paramount importance to identify between the two modes of combustion in SI engines: deflagration and auto-ignition.
In general, combustion initiated from a hot spot can be categorized into five modes; thermal explosion, supersonic auto-ignitive deflagration, developing detonation, subsonic auto ignitive deflagration and laminar deflagration (Gu, Emerson, Bradley Citation2003). According to the literature, the knocking process in SI engines can be attributed to the occurrence of the subsonic auto-ignitive deflagration mode (Bates et al. Citation2016; Wei et al. Citation2021). The aforementioned combustion mode is associated with slight or moderate knock in SI engines (Bates et al. Citation2016). Moreover, the intermittent generation of pressure waves and the induced ignition characterized by deflagration to detonation transition can result in severe knock and, in extreme cases, super knock (Wang et al. Citation2015; Wei et al. Citation2021; Zhou et al. Citation2020).
Combustion modes in SI engines may be affected by the fuel composition and thermal stratification. For instance, while bio-derived gasoline (bio-gasoline) is reported to reduce CO emissions, it can enhance knock resistance of the fuel mixture (Cheng et al. Citation2020). On the other hand, thermal stratification effects on the combustion mode have been previously studied by different researchers as reviewed in the remainder of this section. In this work, a systematic approach is proposed to identify between two modes of combustion, i.e. deflagration and auto-ignition, with various thermal stratification levels using a simple analytical method, originally developed by Karimkashi et al. (Citation2020). To validate the analytical model, hundreds of one-dimensional (1D) numerical simulations under different stratification levels and for two different gasoline surrogates are conducted.
The simplest and most commonly used gasoline surrogates are Primary Reference Fuels (PRF), which are binary mixtures of -heptane and iso-octane. These mixtures are used as a reference for measuring the fuel anti-knock quality expressed as Research Octane Number (RON) and Motor Octane Number (MON) test conditions in the Cooperative Fuel Research (CFR) engine (ASTM Citation2013, Citation2014). With relevance to this work, a binary mixture of iso-octane/n-heptane (87%/13% volume, PRF 87) and a ternary mixture of n-heptane/iso-octane/ethanol (18% /62% /20% volume, PRF-E) are considered. Effects of chemical composition of the gasoline surrogates on their combustion characteristics are numerically addressed in the literature by correlating their ignition delay time (IDT) to the knock index. For instance, Naser et al. (Citation2017) correlated the Octane Index (OI) and RON and MON numbers of various PRFs and Toluene Primary Reference Fuels (TPRFs) to their IDT at 21.3 bar and 770 and 850 K. Mehl et al. (Citation2011b) correlated the anti-knock index of gasoline surrogates to their IDT at 25 bar and 835 K. Badra et al. (Citation2015) expanded the correlation for TPRFs octane numbers using IDTs at 850 K and 50 bar. However, a key difference between the measured fuel knock quality and the calculated IDTs is that zero-dimensional (0D) simulations assume a premixed, fully homogeneous gas phase reactions.
Combustion mode classification of a reactivity stratified mixture is shown to be a beneficial approach for studying the transient flame dynamics under engine relevant conditions. For instance, the influence of thermal stratification on the auto-ignition of hydrogen/air mixtures under Homogeneous Charge Compression Ignition (HCCI) conditions is addressed using Direct Numerical Simulation (DNS) (Chen et al. Citation2006; Hawkes et al. Citation2006; Sankaran et al. Citation2005). Sankaran et al. (Citation2005) derived a predictive criterion for deflagration and spontaneous ignition modes based on the ratio of the reaction front propagation speeds. The criterion has been found to be consistent with the results from DNS in Refs. (Chen et al. Citation2006; Sankaran et al. Citation2005). Chen et al. (Citation2006) developed diagnostic measures for analyzing the mode of combustion. They have found that the prevalence of deflagrative versus spontaneous ignition modes depends on the local thermal stratification. Hawkes et al. (Citation2006) further examined the effect of initial amplitude and wavelength of temperature fluctuations and turbulence intensity on ignition front propagation. Their DNS results demonstrated that higher amplitudes of temperature fluctuations can increase the prevalence of deflagration.
The effect of thermal stratification, turbulence, and spark ignition on premixed iso-octane/air and -heptane/air mixtures under HCCI and Spark-Assisted Compression Ignition (SACI) conditions was studied by Yoo et al. (Citation2013, Citation2011). DNS along with reduced mechanisms were utilized on a two-dimensional (2D) computational domain while the average temperature was kept higher than the Negative Temperature Coefficient (NTC) range. It was demonstrated that high levels of temperature stratification induce a deflagration mode in reaction fronts and thus result in smooth mean heat release rate. Dai et al. (Citation2015) performed a one-dimensional (1D) numerical study on reaction front propagation modes of
-heptane/air mixture at initial temperatures within and below the NTC range inside a hotspot. Their results indicate that cool spots may also generate knock in engines when the engine is operated close to the fuel NTC range. Recently, Nogawa and Terashima (Citation2020) studied the effect of global temperature stratification on the ignition modes in a constant volume reactor. In their study,
-heptane and
-butane/air mixture were chosen as NTC and non-NTC fuels. They observed that an increase in initial pressure and occurrence of NTC can both increase the possibility of heavy knocking.
Moreover, 1D study of Gupta, Im, and Valorani (Citation2013) on -heptane/air mixture showed that under relatively large temperature stratification levels and at non-NTC conditions, there could be a transition from deflagration to spontaneous ignition. Further, the mixture at the NTC range obtained two-stage ignition while the first ignition was mostly at deflagration regime and the secondary ignition was almost always at the spontaneous ignition mode.
With relevance to the fuel mixtures investigated in the present study, Luong et al. (Citation2013) studied the effects of thermal stratification on the ignition of different PRF/air mixtures under HCCI conditions. The 2D DNS results revealed that at high levels of thermal stratification, the effect of PRF composition vanishes by observing similar deflagration reaction front propagation between the different mixtures. Recently, ignition characteristics of a mixture of PRF/air/exhaust gas recirculation (EGR) under reactivity controlled compression ignition (RCCI) and direct dual-fuel stratification (DDFS) was studied by Luong et al. (Citation2017). The 2D DNS results showed that DDFS combustion results in longer combustion duration and lower peak of Heat Release Rate (HRR) compared to the RCCI combustion. More recently, Karimkashi et al. (Citation2020) presented a theoretical relationship for predicting spontaneous and deflagrative reaction front propagation for locally stratified dual-fuel mixtures under RCCI engine-relevant conditions. For their test case of methanol/n-dodecane blends, the theoretical analysis was able to predict the phase border between the combustion modes observed in 1D chemical kinetics simulations. Furthermore, they developed the theory for turbulent cases and examined the effect of convection on the combustion modes using fully-resolved 2D simulations.
According to the above-mentioned literature review, experimental and numerical studies on effects of thermal stratification on the combustion mode for fuels and surrogates utilized in SI engines are quite extensive. However, an analytical model to explore thermal stratification effects on the combustion mode in a systematic way is still lacking. On the other hand, numerical approaches for evaluating the combustion characteristics of gasoline surrogates (e.g. knock tendency) mainly concern 0D kinetics modeling. In particular, the effect of diffusion in homogenizing the temperature prior to ignition is not addressed in the literature due to the choice of length scales such that the thermal diffusion is not active. Therefore, a systematic and comparative study on the effect of thermal stratification levels on the combustion mode should be provided for practical gasoline surrogates in SI engines with effects of diffusion included.
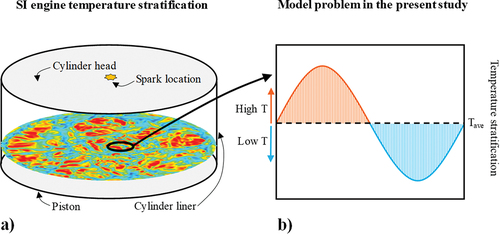
Therefore, in order to address the research gap outlined above and in continuation of the authors’ previous study (Karimkashi et al. Citation2020), here, we study a simplified 1D model problem with relevance to the unburnt fuel-oxidizer mixture. Next, we motivate the studied simulation setup. In a spark-ignition (SI) engine a premixed fuel-oxidizer mixture is ignited by a spark plug leading ideally to a flame propagation through a turbulent flow field. Such a setup is illustrated in ) showing a schematic of an engine cylinder. One of the illustrated temperature cut-planes is taken from the datasets of our previous study by Masouleh et al. (Citation2018), where we carried out large-eddy simulations (LES) of flame propagation in a SI model engine using the G-equation combustion model assuming a fully premixed fuel-oxidizer mixture. However, as noted, the temperature stratification can be strong near the cylinder walls. In such circumstances, laminar flame speed and ignition front speed can be strongly dependent on the local conditions, thereby affecting the local combustion progress. In the present study, we investigate different ignition scenarios of the end-gas using the model problem of sinusoidally varying temperature fluctuation as depicted schematically in ). The model could effectively correspond to combustion process in a locally stratified region as depicted in ).
Figure 1. Schematic presentation of a) SI engine cylinder and temperature distribution in the unburnt gas on a cut-plane inside the cylinder based on previous large-eddy simulations by the authors (Masouleh et al. Citation2018), b) model problem in the present study.
We note that the model problem in this study provides details on local combustion phenomena at relatively small length-scales using detailed chemistry and at high grid resolutions. This information can be utilized alongside CFD simulations where using detailed chemistry and high grid resolutions are inhibitive. The beta-curve can be also used as an a-priori tool to find the interesting conditions for CFD simulations.
This study aims to:
) Extend the theoretical analysis presented for mixture stratification under compression ignition engines in Ref. (Karimkashi et al. Citation2020) to temperature stratification conditions in SI engines,
) Analyze the effect of temperature stratification on the combustion mode of two different gasoline surrogates (PRF and PRF-ethanol) under normal and boosted engine relevant conditions, using a recently developed computational framework,
) Explore the ignition front characteristics under different thermal stratification levels for the considered gasoline surrogates,
) Provide a regime diagram in order to assess the combustion characteristics (knock tendency) of the gasoline surrogates, and
) Formulate a diagnostic approach enabling the generation of predictive maps for various fuel surrogates under thermal stratification.
Methodology
Building upon the previous work by Karimkashi et al. (Citation2020) on the combustion mode analysis of locally stratified mixtures, a similar strategy is taken to characterize the modes of combustion for different levels of initial temperature stratification. The present approach includes a theoretical analysis followed by hundreds of 1D numerical simulations for two different gasoline surrogates under SI engine-relevant conditions. The unsteady 1D simulations evaluate the validity of the theoretical analysis while providing details on the transient combustion characteristics. The details about these steps are discussed in the following.
Theoretical analysis
The theoretical approach developed by Karimkashi et al. (Citation2020) is an a-priori tool to evaluate the prevelance of auto-ignitive versus deflagrative front propagation in locally stratified mixtures relevant to compression ignition engines. This theory, called -curve analysis, is slightly modified herein to be utilized for the combustion mode analysis in homogeneous mixtures with different thermal stratification levels under SI engine-relevant conditions. In the following, the
-curve theory is briefly introduced and it is accordingly modified for thermal stratification.
Sankaran et al. (Citation2005) defined a parameter, , as an indicator for dominance of the spontaneous ignition versus deflagration regimes in a mixture with temperature stratification,
where is a coefficient of the order of unity,
is the laminar flame propagation speed, and
is the front propagation speed after the initial ignition in the mixture. Therefore,
represents the deflagration regime whereas
implies the spontaneous ignition mode, and
=1 is the borderline between the two combustion modes. According to (Zeldovich Citation1980),
is equal to the inverse of IDT gradient for the premixed reactants. Assuming a homogeneous mixture, IDT is a function of temperature fluctuations only and
can be written as
wherein represents IDT. Here,
, represents the ignition delay sensitivity to the temperature gradient. This term can also be interpreted as the slope of IDT when plotted against temperature (
). The value of
changes depending on the fuel composition, average temperature, and pressure of the mixture. In EquationEq.(2
(2)
(2) ),
is the temperature gradient with respect to the domain length, which reduces during the induction period (before auto-ignition) due to thermal diffusion.
Similar to the mixture stratification definition in Ref. (Karimkashi et al. Citation2020), the initial thermal stratification can be characterized using the spatial lengthscale () and amplitude (
) in a presumed sinusoidal initial temperature stratification around an average temperature of
, given by
in a 1D domain with periodic boundary conditions, i.e.
. Here, k =
is the wavenumber. Karimkashi et al. (Citation2020) provided an analytical solution for the 1D diffusion equation in (
,
) space in order to estimate the diffusion effect with time evolution. Here, a similar approach is taken and the 1D heat diffusion equation provided below is solved by assuming a constant heat diffusivity and unity Prandtl number.
According to the provided details in Ref. (Karimkashi et al. Citation2020), EquationEq.3(3)
(3) is solved and the temperature gradient at the instant of ignition is written as
from which the maximum value of the temperature gradient in the domain can be written as
Substituting EquationEq. 5(5)
(5) into EquationEq. 2
(2)
(2) gives
Further, substituting EquationEq. 6(6)
(6) into EquationEq. 1
(1)
(1) gives
Finally, considering , the relation between
and
can now be written as:
EquationEquation 8(8)
(8) is the modified
-curve equation in Ref. (Karimkashi et al. Citation2020) for thermal stratification. Inserting
into EquationEq.8
(8)
(8) provides the borderline between the deflagrative and spontaneous ignition modes in the (
,
) space. The studied length scales are normalized by the diffusion length scale defined as
. A schematic plot of the
-curve is shown in , wherein
theoretically separates the two combustion modes from one another. Other
values demonstrate the relative variation of the ignition front speed compared to the laminar flame speed, where
1 (
1) represents dominance of deflagration (spontaneous) mode.
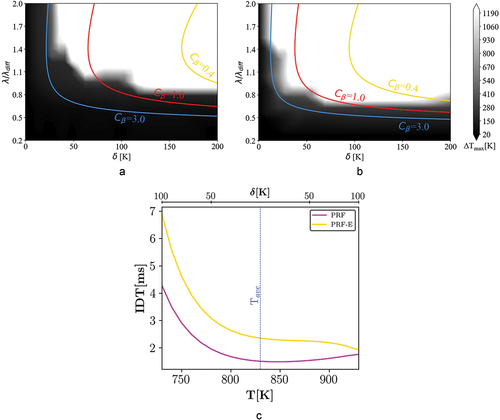
Figure 2. Schematic presentation of combustion regime diagram, the solid line (=1) separates the spontaneous ignition and the deflagration modes. Different theoretical
values (C
=1) are also plotted (dashed lines). In practice, as noted also in the present work, the transition region around the
-curve may pose features from both combustion modes.
In the notation above, , and
are functions of
, pressure, and the fuel composition. In the present study, values of ignition delay time (
) and laminar flame speed (
) are calculated using the 0D homogeneous reactor model and 1D premixed flame model of Cantera (Goodwin et al. Citation2018), respectively. The generated IDT vs temperature curves are used to calculate
at
as an estimation for local ignition delay sensitivity to temperature variations (Karimkashi et al. Citation2020). The transport properties library of Cantera has also been used for computation of the mixture viscosity.
Transient 1D simulations
The numerical framework utilized here is similar to the authors’ previous studies (Kahila et al. Citation2019; Karimkashi et al. Citation2020). An open source computational fluid dynamics (CFD) package OpenFOAM (Weller et al. Citation1998) is used to solve the 1D auto-ignition/flame propagation problem. The compressible Navier Stokes equations are coupled with species mass fraction transport equations along with the PIMPLE algorithm utilized for the pressure-velocity coupling. The chemical source terms are calculated using direct integration of finite rate chemistry. The customized chemistry solver, pyJac (Niemeyer, Curtis, Sung Citation2017), is used to evaluate the reaction rate coefficients. Additionally, pyJac offers an analytical Jacobian matrix formulation for solving the underlying chemical system of ODEs. For further details on the implementation and improvements over the standard OpenFOAM solvers, the reader is referred to (Kahila et al. Citation2019). It is noteworthy that the currently used customized solver has been shown to be able to capture the compression effects after the first ignition (Kahila et al. Citation2018).
A 1D domain with periodic boundary conditions is considered resembling the constant volume combustion in engines. The size of computational domain in all simulations is equal to . Initialization of the temperature fluctuation is set within a range of specific amplitudes (0
200) and length scales (0
2
) together with a homogeneous fuel mass fractions distribution. As shown by Masouleh et al. (Citation2018), in the highly simplified model engine, the local temperature stratification can be as high as
K close to the walls while becoming more uniform in the center of the cylinder.
A computational grid with uniform grid spacing of 0.05 flame thickness (
) is utilized to resolve the flame scales. The flame thickness is calculated using the data from the laminar flame simulations,
with
and
being the product and reactant temperatures, respectively. In 1D simulations, IDT has been considered as the time when the maximum temperature exceeds the threshold value of 1500 K (
1500 K). In the transient OpenFOAM simulations, the time step after the initial ignition is dynamically adjusted so that CFL
=0.1 constraint.
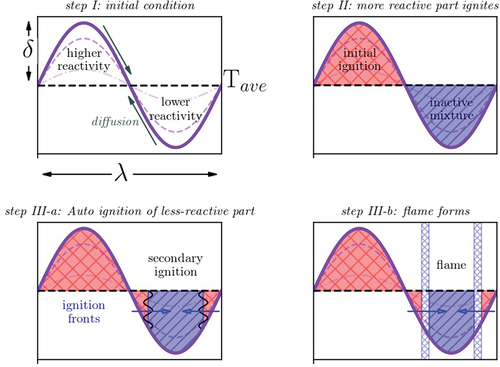
A schematic picture of the anticipated combustion phases is shown in . According to the sinusoidal temperature distribution, the mixture is classified as two distinct zones with higher and lower reactivity (step I). The key process occurring before initial ignition (step II) is heat diffusion. Diffusion reduces the temperature heterogeneity from the initial time until the ignition time (the dashed lines in , Step I). Step II is attributed to the instance of time when the zone with higher reactivity starts to ignite. It should be noted that during step II, the reactivity of the lower reactive part of the mixture increases compared to its initial state due to the low temperature chemistry (LTC) and heating compression of the initial ignition kernel. Two distinct scenarios are expected to happen after the initial ignition. In the first scenario, step III-a, auto-ignition happens in the lower reactive part of the mixture independently and slightly after the initial ignition. This will form a secondary ignition front and it consumes rest of the unburnt reactants, resembling a volumetric reaction process. The main reason for the occurrence of step III-a is that the lower and higher reactive sides have similar reactivity stratification at the instant of primary ignition. The reason for this event can be either a very high thermal diffusion rate prior to the first ignition or initially low levels of reactivity stratification. The initial reactivity stratification level is related to the initial temperature profile. On the other hand, occurrence of NTC also modifies the reactivity distribution. The NTC behavior of the fuel can result in equivalent IDTs for different temperature levels. Therefore, the fuel type (NTC or no NTC), average temperature, and pressure may affect the reactivity stratification levels. The second scenario (step III-b) is that the initial ignition kernel forms a flame front witch propagates through the lower reactive mixture side. Considering the periodic boundary conditions in this study, it appears that the two fronts are approaching each other in the lower reactive side of the mixture (, step III-b). The incidence of such process is due to the high reactivity stratification along the domain at the instant of primary ignition. Therefore, similar to the steady state flame propagation, the diffusion of heat and active radicals through the flame front induces reactions in the lower reactivity side of the mixture.
Figure 3. Schematic presentation of combustion process, step I thermal diffusion, step II primary ignition, step III-a in the spontaneous ignition mode an ignition front propagates toward the unburnt mixture, and step III-b in the deflagration mode a premixed flame propagates toward the unburnt mixture.
Fuel reactivity distribution vs temperature
In the present study, two different gasoline surrogates are examined for the combustion mode analysis. A binary mixture of iso-octane/-heptane (87%/13% volume, PRF 87) and a ternary mixture of
-heptane/iso-octane/ethanol (18% /62% /20% volume, PRF-E) are considered. PRF mixture has similar MON value to gasoline, while PRF-E mixture composition mimics an oxygenated gasoline with MON = 89 and RON = 95.1. The choice of PRF-E mixture enables taking into account the octane sensitivity observed in the commercial gasoline and then also helps to observe the improvement of OI by using oxygenated additives. Addition of ethanol decreases the NTC behavior of the mixture, yet it increases the ignition propensity in intermediate temperature regions. On the contrary, the presence of ethanol increases the resistance to ignition in low temperatures where knock typically occurs. However, at high temperatures, the ignition promoting or inhibiting effect of ethanol vanishes, and biogasoline ignites similarly to gasoline (Frassoldati et al. Citation2010).
In order to choose an appropriate chemical mechanism, mechanism validation is shown in Appendix A. Additionally, comparisons between various mechanisms is also shown in Appendix A. High pressure 0D constant volume homogeneous reactor and 1D premixed flame models in Cantera are used for the validation. Consequently, a 115 species skeletal TPRF mechanism developed by Stagni et al. (Citation2016) for PRF simulations and a skeletal 171 species bio-gasoline mechanism (Ranzi et al. Citation2014) for the PRF-E simulations are selected.
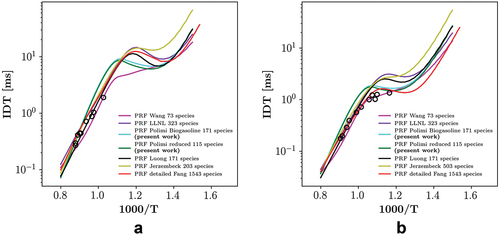
We note that recent engine development has led to higher pressures at fixed temperatures, causing engines to work under RON-like conditions or even beyond that. The reciprocal relation of the fuel sensitivity and knock tendency of the fuels at high loads motivated investigation of PRF and PRF-E combustion modes at two different pressures, i.e. 20 bar and 50 bar. depict IDT versus temperature distribution of the investigated fuels at 20 and 50 bars, respectively. While both of the IDT profiles exhibit NTC at 20 bar pressure, there is mild NTC behavior for PRF-E at 50 bar. At 20 bar, , two average temperatures are considered for further examinations. Point I at =1000 K is in the high temperature region and point II at
=830 K, is located at the NTC region for both fuels. At 50 bar, three different
at 1000 K (III), 900 (IV) and 830 (V) are selected for high, intermediate, and low temperature zones, respectively. In the following 1D simulations, these points are the average temperatures (
) in cases I–V around which different temperature amplitudes (
) with various lengthscales (
) are considered. Detailed information on the reference values calculated at
for these cases at points I–V are reported in . It is worth mentioning that according to the high reactivity of the mixture at the examined pressures and temperatures, the presented reference values for the flame speed and flame thickness are estimated values using Cantera (Krisman, Hawkes, Chen Citation2018).
Figure 4. PRF and PRF-E ignition delay time versus temperature profiles at P = 20 and 50 bar, black circles are marking the locations of the studied cases.
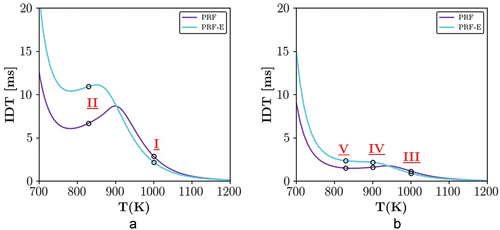
Table 1. Conditions for the five cases: pressure, average temperature, ignition delay time, flame speed, product temperature, and flame width.
Results and discussions
Combustion mode analysis
In this section, combustion mode analysis for different case studies defined in are provided using 1D numerical simulations as well as the -curve theory. As it was explained in section 2.1,
and
designate spontaneous ignition and deflagration combustion modes respectively. Moreover,
1 (EquationEq 1)
(1)
(1) describes a reaction zone where spontaneous ignition and deflagration have equivalent role in front propagation and
is a coefficient of the order of unity. Moreover, it has been shown that EquationEq 8
(8)
(8) draws a theoretical borderline between the ignition and deflagration zones in (
,
) space.
The following figures () depict the output of 1D simulations as well as the -curves calculated using the average temperature and pressure with different values of
. Each contour contains about
100 simulation points, in which
and
are varied to achieve different initial sinusoidal temperature distributions. A temperature threshold (1500 K) is considered in order to distinguish the start of ignition for each case. After the initial ignition, a characteristic flame formation time is calculated for each case (
) and it is added to the respective ignition time. Eventually, the contours have been created for the maximum temperature difference in the domain (
) achieved for each case after the mentioned time period, i.e. at IDT +
. The color scale in the contours is based on how close
is to a cutoff value of temperature difference,
K, considered in all cases. The choice of
value, is based on the difference between the average temperature of the unburnt mixture (830 K
T
1000 K) and burnt products (T
2600 K) of a steady state premixed flame, according to . The local temperature gradient is used to distinguish between a flame and an ignition front (Karimkashi et al. Citation2020; Sankaran et al. Citation2005). The regions where
are considered to be governed by spontaneous ignition while those with
are interpreted to be characterized by the deflagration mode. In the following, each figure corresponding to the regime diagrams of each case study for the two considered gasoline surrogates is analyzed, comparatively.
Figure 5. Combustion mode distribution of case I ( = 20 bar and
= 1000 K), black and white regions represent spontaneous ignition and deflagration modes of a) PRF and b) PRF-E mixtures respectively. Colored lines display the
-curves calculated using different
values, EquationEq.8
(8)
(8) . c) IDT distribution at the initial time versus T of PRF and PRF-E mixtures.
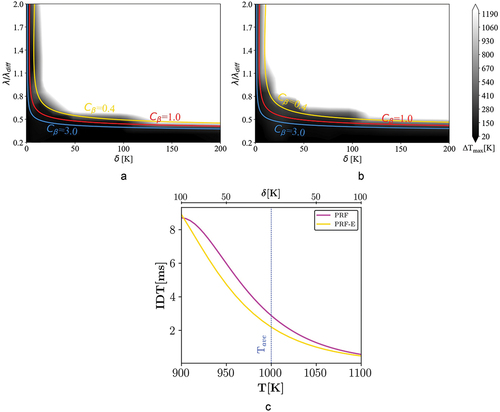
Figure 6. Combustion mode distribution of case II ( = 20 bar and
= 830 K), black and white regions represent spontaneous ignition and deflagration modes of a) PRF and b) PRF-E mixtures respectively. Colored lines display the
-curves calculated using different
values, EquationEq.8
(8)
(8) . c) IDT distribution at the initial time versus T of PRF and PRF-E mixtures.
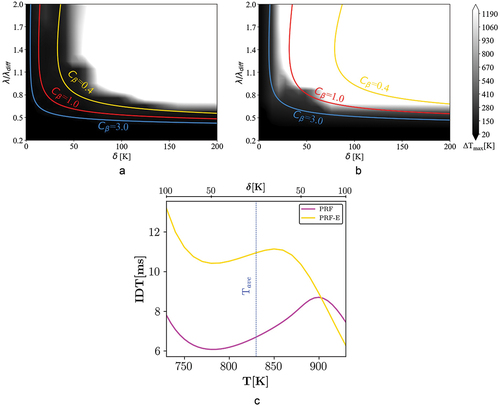
Figure 7. Combustion mode distribution of case III ( = 50 bar and
= 1000 K), black and white regions represent spontaneous ignition and deflagration modes of a) PRF and b) PRF-E mixtures respectively. Colored lines display the
-curves calculated using different
values, EquationEq.8
(8)
(8) . c) IDT distribution at the initial time versus T of PRF and PRF-E mixtures.
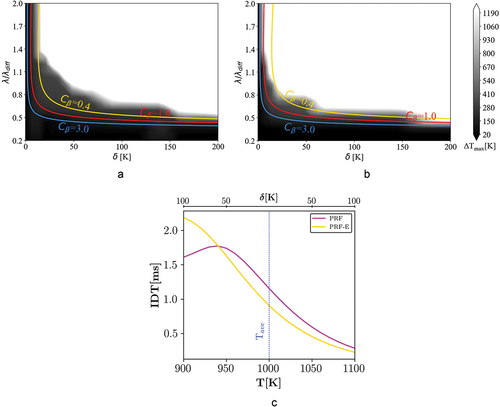
Figure 8. Combustion mode distribution of case IV ( = 50 bar and
= 900 K), black and white regions represent spontaneous ignition and deflagration modes of a) PRF and b) PRF-E mixtures respectively. Colored lines display the
-curves calculated using different
values, EquationEq.8
(8)
(8) . c) IDT distribution at the initial time versus T of PRF and PRF-E mixtures.
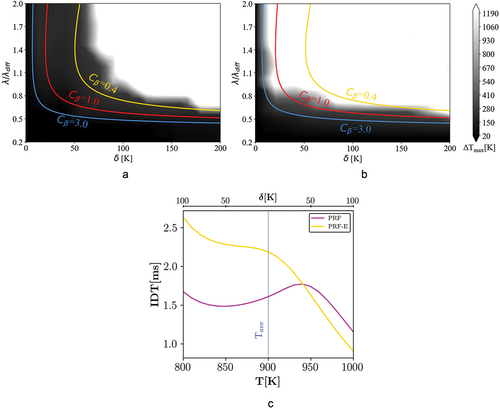
Figure 9. Combustion mode distribution of case V ( = 50 bar and
= 830 K), black and white regions represent spontaneous ignition and deflagration modes of a) PRF and b) PRF-E mixtures respectively. Colored lines display the
-curves calculated using different
values, EquationEq.8
(8)
(8) . c) IDT distribution at the initial time versus T of PRF and PRF-E mixtures.
Regime diagram: case I
presents 1D simulation results for = 1000 K and P = 20 bar. It is observed from the combustion mode diagrams, , that fluctuations with higher
and
values promote deflagration mode compared to spontaneous ignition. The overall expansion of the deflagrative mode under higher levels of temperature stratification is also observed in previous studies using iso-octane/air and PRF/air mixtures (Luong et al. Citation2013; Yoo et al. Citation2013).
A particular characteristic phenomenon in the proximity of diffusion length scales is that increasing results in less homogeneity due to the weakened diffusion process prior to the initial ignition and accordingly, higher reactivity stratification levels at the onset of ignition. However, above the considered scales, an increase in
reduces the temperature gradient and hence results in a more homogeneous mixture and stronger ignition.
It is worth noting that in this study we always keep the maximum wave lengths close to the value of the diffusion length scale () to prevent the formation of intense pressure waves, and thereby initiation of the detonation phenomenon, at the instance of ignition in the domain.
depict that combustion mode distribution does not change along the horizontal axis when the amplitude increases to values higher than 100 K. This is due to the large difference between the IDT values of the minimum and the maximum temperature points (e.g. = 100, 730 K
T
930 K), taking into account the monotonic shape of the IDT vs temperature profiles. The reactivity distribution of PRF and PRF-E versus
at
= 1000 K is displayed in .
When comparing , both fuels are seen to behave similarly in terms of combustion mode distribution. This behavior may also be deduced from . The present result is inline with kinetic study of Frassoldati et al. (Citation2010), in which they depicted the similar IDTs of gasoline and bio-gasoline surrogates under high temperature conditions.
Regime diagram: case II
presents 1D simulation results for = 830 K and P = 20 bar conditions. It is observed that the PRF mixture is more prone to spontaneous ignition at similar stratification levels, which is directly related to the reactivity stratification differences between the two mixtures. According to , although the IDT profiles of both fuels show a considerable NTC behavior, the PRF-E mixture shows lower degrees of NTC compared to the PRF mixture. Therefore, reactivity stratification of the PRF mixture is considerably smaller than that of the PRF-E mixture at the considered temperature and pressure range. Accordingly, the extent of spontaneous ignition is lower for the PRF-E compared to the PRF.
We note that according to , when approaching lower temperatures, at T = 830 K and P = 20 bar, the PRF mixture tends to be more reactive than the PRF-E mixture. However, conducted research shows that correlating IDT values and knock indexes, e.g. RON, for gasoline and bio-gasoline surrogates can result into significant errors (Naser et al. Citation2017; Singh et al. Citation2019). Although longer IDTs of the PRF-E at low temperatures can decrease the ignition propensity of the mixture (Cheng et al. Citation2020), it allows diffusion to neutralize the initial temperature stratification (larger
values) and therefore promote spontaneous ignition. By analyzing the events after initial ignition and using the dimensionless length-scales (
), the effect of the ignition delay time (IDT) offset on the results has been normalized for all cases. Therefore, as it is apparent from , at high values of
, both fuels have the same combustion mode distribution.
A comparison between , shows that spontaneous ignition region is advanced toward the higher and
, implying a higher spontaneous ignition propensity for the PRF. At
= 830 K, the NTC behavior reduces the variation of reactivity versus amplitudes and results in higher chance of spontaneous ignition, within the range shown in . Considering the differences between and , a similar conclusion can be made for the PRF-E fuel. The reduced reactivity variation results in higher significance of spontaneous ignition mode for the PRF-E fuel.
In addition, it is observed that the theoretical -curve region between the spontaneous ignition and the deflagration modes is wider compared to the case I, especially for the PRF-E mixture. This may be connected to a situation where both combustion modes are significant (Bates et al. Citation2016). Here, when both modes are important, it is labeled as spontaneous ignition assisted deflagration. The topic is analyzed more in sections 3.1.6 and 3.2.
Regime diagram: case III
presents 1D simulation results for = 1000 K and P = 50 bar. Although the combustion mode profiles look similar to Case I, according to ,
obtains lower values for both fuels. In fact, considering lower stratification levels (upper branch) the deflagration zone is now limited to smaller length scales compared to Case I. With the pressure increase to 50 bar and at high average temperature (T
= 1000 K), shows that the PRF IDT profile exhibits a mild NTC at 900 K
T
950 K. The displacement of the NTC region toward higher temperatures with increasing pressure is related to the competition between
decomposition and low-temperature chain routes (Lee et al. Citation2017). Compared to the case I (), the spontaneous ignition zone shifts to higher
and
values due to the appearance of the NTC in the PRF profile. The PRF and PRF-E combustion mode distributions, , can be compared with a similar analogy to case I. Increasing
and
results in higher reactivity stratification levels at the onset of ignition which leads to enhanced deflagration mode for both mixtures. However, at comparatively lower
and
values, the spontaneous ignition mode is more dominant for the PRF due to the presence of NTC chemistry.
Moreover, it is observed from that the combustion mode distribution does not change by increasing to higher values than 150 K. This increase in the maximum effective amplitude compared to case I is a result of the lower gradient of reactivity versus temperature, , under elevated pressures.
Regime diagram: case IV
presents 1D simulation results for = 900 K and P = 50 bar. shows that by changing the average temperature to 900 K, the PRF mixture exhibits a considerable NTC behavior leading to lower reactivities at higher temperatures. However, the PRF-E profile shows a mild NTC behavior. As a result, the combustion mode distribution of the PRF-E mixture remains fairly similar to the case III, while the spontaneous ignition zone for the PRF mixture proceeds toward the higher amplitudes. The observed combustion mode distribution for the two surrogates is in line with the fact that the PRF (zero sensitivity) is more prone to knock than a sensitive (real gasoline or ethanol blended PRF) fuel at higher pressures (Szybist and Splitter Citation2017).
Regime diagram: case V
presents 1D simulation results for = 830 K and P = 50 bar. Shifting to lower average temperatures (T
= 830 K), the amount of NTC decreases for the PRF mixture, c.f. . Thereby, spontaneous ignition zone recedes to lower amplitudes compared to case IV, although it is still larger than in case III. However, as it is observed in , there is no noticeable change in the combustion mode distribution of the PRF-E.
The fact that combustion mode distribution of the PRF-E does not change significantly with changing the average temperature from 1000 K to 830 K under elevated pressures (cases III–V), illustrates the better performance of the ethanol blend in downsized-boosted engines with lower compression temperatures and higher pressures than the RON test. In addition, it is again observed that the theoretical -curve region between the spontaneous ignition and the deflagration modes is wider compared to e.g. case I. This is connected to the previously mentioned situation where both combustion modes have significance (Bates et al. Citation2016), i.e. spontaneous ignition assisted deflagration.
Estimation of knock propensity
As mentioned earlier, knock tendency of the fuels is attributed to their ignition properties at the end gas. Although we do not simulate actual knock in the present study, the present numerical results still offer a possibility to estimate certain metrics to assess the mixture knock propensity. Here, we estimate the knock propensity of the fuels at each studied condition by calculating the relative area of the spontaneous ignition zone from 1D simulations. The area is then compared to the entire area of the -
regime diagrams as percentages, c.f. –9a and b. summarizes the estimated knock propensity and NTC levels in cases I–V.
Table 2. NTC levels and estimated knock propensity of cases I–V based on the percentage of spontaneous ignition zone from 1D simulations. Additionally, the table gathers certain findings from cases I–V.
Similar knock tendency of the fuels under Case I conditions is also inline with their similar MON numbers, while the higher knock resistance of the PRF-E at high pressures and low temperatures (Cases IV and V) conforms with its higher RON number. Therefore, the enhancing effect of fuel sensitivity on knock resistance can be observed by comparing the estimated knock propensity of the PRF and PRF-E mixtures in Cases I and IV–V.
From it is observable that the knocking tendencies are correlated with the NTC levels of the fuels. However, it is also worth noting that under certain levels of stratification (e.g. at high or
values) the knock propensities can be different from the respective estimation in . This quantification is not possible to be extracted from chemical kinetic analysis alone. Here the
-curve analysis enables taking the diffusion effect on temporal and spatial variation of temperature into account.
Discussion on the  -curve results
–9a and b show the -curves plotted using 0.4
3.0. The idea of using different
values is to identify the regions where ignition and deflagration modes have a similar significance. Therefore, the width of the confined zone between the upper and lower limits shows the rate of transition between the combustion modes.
For instance, the results for high temperature cases, I and III, show that the sensitivity of the -curve location to
is marginal. This implies that the transition from spontaneous ignition to deflagration combustion mode happens in a rather narrow region. This observation is in accordance with the similar IDT profiles and the clear trend between the temperature and reactivity of the mixture in cases I and III. However,
-curves for cases II, IV and V show high sensitivity to the values of
. This behavior implies that there is a broader range where both ignition and deflagration modes have a comparable significance (Bates et al. Citation2016). In this case the two modes could affect each other, i.e. increased propagation speed due to auto-ignition (spontaneous ignition assisted deflagration). Furthermore, when both modes are important, the rate of transition between the combustion modes is slower in low temperature conditions than in the high temperature cases. The current behavior is also in accordance with the moderate change observed in IDT vs temperature distribution in these cases, which is correlated to low and intermediate temperature heat release.
We note that the comparison between the theoretical curves and contours in –9a and b show that the defined borderlines using the -curve theory conforms with the results from 1D numerical simulations.
To reproduce a similar diagnosis to this study, the following steps should be taken:
(1) Finding 0D IDT and steady-state 1D premixed flame data (S,
,
,
,
) at specific T
values.
(2) Evaluating values and then drawing
curve from EquationEq.(8)
(8)
(8) in the (
,
) space.
(3) Performing a sensitivity test for different values of in the order of unity.
(4) Determining the surface area below curve to find the prevalence of ignition versus deflagration modes.
(5) As a complementary step, 1D simulations can be conducted, with the same approach discussed in the present paper, with the points chosen in proximity of the curve in (
,
) space.
Note that if T lies in the NTC zone the value of
becomes sensitive to the choice of T
and chemical mechanism. Therefore, while conducting step 5 is strongly advised, achieved results can only show a qualitative comparison of the two combustion modes.
We note that the presented 1D diagnosis approach, provided with information on the average temperature, pressure, temperature stratification levels and fuel surrogates is able to predict the conditions that should be avoided to reduce the knock tendency. In practice the temperature stratification levels need to be estimated based on its correlation to turbulence levels and engine geometry (Kalghatgi et al. Citation2009). To estimate turbulence levels, it has been shown by Masouleh et al. (Citation2019) that turbulence levels are correlated with engine RPM in practice. Furthermore, temperature stratification level varies inside the cylinder in real engines, therefore analyzing the sensitivity of knocking tendency to the temperature stratification is required which is also considered in the present diagnostic approach. Moreover, a possible extension of the present numerical framework to 2D, similar to the work by Karimkashi et al. (Citation2020), may provide additional information on the effect of turbulent diffusion length scales in the current problem. Finally, a full 3D simulation is capable of capturing the phenomenon such as turbulence, cycle to cycle variation and geometrical effects. However, such simulations normally are limited by computational resources.
Analysis of the transient flame behavior
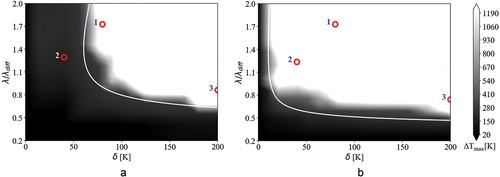
The intent of this section is to investigate temporal evolution of the ignition front in two cases from the previous section with different combustion mode distributions. In the previous section, we observed that there is a noticeable difference between the combustion mode distribution of the PRF-E and PRF mixtures at 900 K average temperature and 50 bar conditions. indicates the selected points for the transient study in this section. Points with analogous names in have identical normalized length scales and amplitudes. Point 1 is located in the deflagration zone for both mixtures with different distances from the spontaneous ignition zone. Point 2 is located at different combustion regimes, spontaneous mode for the PRF mixture and deflagration mode for the PRF-E mixture. Finally, point 3 is located in the deflagration zone for both mixtures at high values of , similarly away from the spontaneous ignition zone. White lines in are associated with the theoretical
-curves for PRF and PRF-E mixtures with
of 0.4 and 3, respectively. The
s are chosen based on the conformity of the theoretical
-curves with 1D simulation results in .
Figure 10. Locations of the selected points from (a) PRF and (b) PRF regime diagram for transient analysis at 900 K and 50 bar, white line represents theoretical -curves calculated with
values of 0.4 and 3, respectively.
We note that the estimated laminar flame speed for the current configuration ( = 900 K and
= 50 bar) is 1.3 m/s, , for both the PRF and PRF-E mixtures. Therefore, the same front displacement speed is expected in the regions associated to the deflagration mode. Once the maximum temperature in the domain reaches 1500 K, it is considered as the initial ignition event with zero timing in the following discussion.
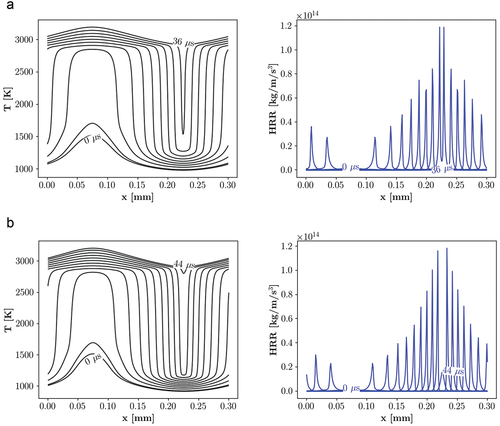
demonstrate transient profiles of the temperature and HRR for the selected points in . In order to demonstrate the propagation speed, x-axis shows the real domain size and the profiles are plotted every 4 µs (except for point 2 for the PRF mixture). Thereby, using the domain length and the time period between the primary ignition (when K) and the end of the process, the propagation speed can be estimated in each case.
Figure 11. Temporal evolution of temperature and HRR at point 1, = 900 K and
= 50 bar, demonstrating spontaneous ignition assisted deflagration for a) PRF and deflagration mode for b) PRF-E mixtures. Depicted profiles illustrate the propagation rates, initial and secondary ignitions.
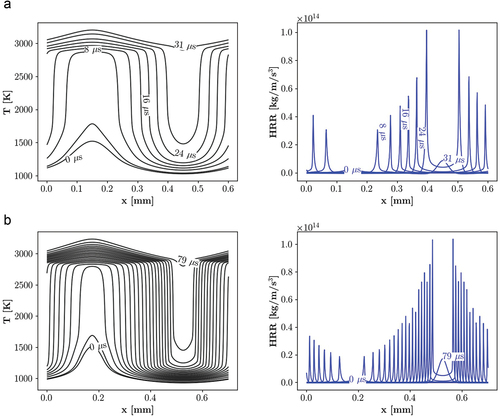
Figure 12. Temporal evolution of temperature and HRR at point 2, = 900 K and
= 50 bar, demonstrating a) spontaneous ignition propagation for PRF mixture and b) spontaneous ignition assisted deflagration for the PRF-E mixture. Plotted profiles illustrate the occurrence of successive ignitions for the PRF mixture and the slower process for the PRF-E mixture. We note that propagation rates for both cases are higher than normal deflagration.
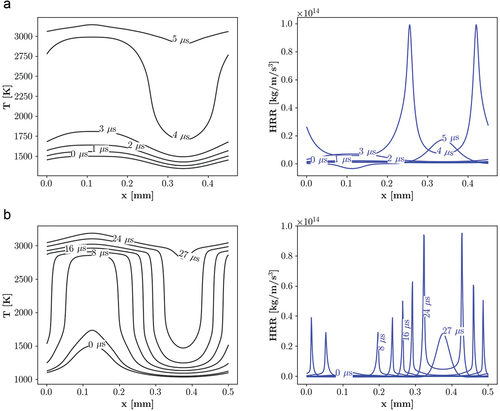
Figure 13. Temporal evolution of temperature and HRR at point 3, = 900 K and
= 50 bar, demonstrating deflagration mode for a) PRF b) PRF-E mixtures. Illustrated profiles show the propagation rates, initial ignition, and the consumption of reactants by approaching flames.
Transient flame analysis: point 1
As discussed earlier, the front propagation mechanism can either be spontaneous ignition or deflagration. In the former mechanism, homogeneously distributed reactions are driving a volumetric auto-ignition event, and the latter is a local and narrow reaction front. Therefore, one way to distinguish between these two modes is to study the heat release rate (HRR) evolution during the combustion process. In the spontaneous ignition mode, it is expected to observe almost evenly distributed HRR at different instances, whereas in the deflagrative mode, a wave like front at flame location is anticipated.
show transient temperature and HRR profiles at point 1 for the PRF and PRF-E, respectively. The HRR profiles show a flame-like structure with distinctive peaks indicating the front location. The initial time steps (t 8
) do not show a noticeable heat release in both of the PRF and PRF-E cases, which illustrates the initial ignition at early stages of flame formation. As the two fronts propagate toward each other, the remaining charge is heated by compression, resulting in the gradual HRR increase. In the final stages, the heated charge auto-ignites again (secondary ignition), resulting to decrease of the HRR and a sudden rise in the temperature profile.
Comparison between the front displacements during each time period indicates the difference in the front propagation mechanisms of the two fuels. From the shown profiles in , the front speed is estimated to be 9.67 m/s for the PRF mixture and 4.43 m/s for the PRF-E mixture. Based on these values, front propagation speeds are larger than the laminar flame speed in both mixtures. This higher propagation speed is expected due to the transient nature of the fronts compared to the steady state solution of the laminar flame. While for the PRF-E, front propagation speed is closer to the laminar flame speed, for the PRF mixture, this difference is larger. The high temperature of the unburned mixture ( K) implies conditions without LTC chemistry, c.f. , and the formation of spontaneous ignition assisted deflagration in the domain. The mentioned condition is defined as flame propagation enhanced by pre-ignition (HTC) of the reactants downstream of the flame (Krisman, Hawkes, Chen Citation2018). As a result, the front propagation can be classified as spontaneous ignition assisted deflagration and deflagration for the PRF and PRF-E mixtures, respectively. Considering the location of the point 1 in , the result also indicates that the closer the point is to the spontaneous ignition regime, the higher is the displacement speed.
Transient flame analysis: point 2
presents temporal distribution of temperature and HRR at point 2 for the PRF and PRF-E mixtures. Point 2 is located in the spontaneous ignition region for the PRF mixture and in the deflagration zone for the PRF-E fuel. shows that the temperature profile evolves in a rather homogeneous manner for the PRF mixture. As a result of the initial non-uniform temperature distribution, ignition starts at a higher temperature, forming a front at 4 . However, the unburnt part ignites instantaneously in the next time step. It is notable that the front formation is not necessarily an indicator of the deflagration mode. This is further discussed in the transport budget terms analysis section, where it is shown that the front observed here is an ignition front.
Transient profiles of the PRF-E mixture show similar trends with point 1 implying the occurrence of the deflagration front propagation. The estimated burning rate for the PRF and PRF-E are 120 m/s and 9.25 m/s, respectively. The former value is orders of magnitude higher than the laminar flame speed, which suggests the occurrence of spontaneous ignition while the latter value is in the same order of magnitude with laminar flame speed and implies an spontaneous ignition assisted deflagration mode.
Transient flame analysis: point 3
illustrates temporal evolution of the HRR and temperature at point 3. Transient profiles for both mixtures show a deflagration-like front propagation. Temperature profiles show that unlike point 1, the unburnt part of the mixture is consumed by deflagration mode, while it remained cold (T 1500 K) and hence secondary ignition (explained in Section 3.2.1) is avoided.
Moreover, estimation of the burning rate gives 3.94 m/s and 3.40 m/s front speeds for the PRF and PRF-E mixtures, respectively. The transient profiles and calculated reaction rates imply that the combustion modes are similar for both fuels at point 3 and it is classified as deflagration. The fact that the fuel reactivity effect on the combustion mode vanishes under high temperature stratification conditions has been also shown in a DNS study of lean PRF/air mixtures in Ref. (Luong et al. Citation2013).
The general trend observed in is inline with the results illustrated in , confirming the validity of the assumptions made for the plotted regime diagrams. However, as noted before, front propagation is not solely representative of normal deflagration. This aspect has been investigated with transport budget analysis in the following section.
Transport budget terms analysis
Under the initial and boundary conditions considered in the present study, the convection term has a negligible contribution in the energy transport equation within the reaction zone of premixed flames (Gordon et al. Citation2007). Therefore, at normal deflagration mode, the reaction and diffusion terms are expected to be in balance, whereas for the spontaneous ignition mode reaction term dominates over the diffusion term (Karimkashi et al. Citation2020; Luong et al. Citation2017). Here, budget term analysis for the energy equation has been used to investigate combustion modes of the specified points in . compares the normalized diffusion and reaction terms of the points 1–3 for the PRF and PRF-E fuels at the same time instances inspected in the previous section. The diffusion and reaction terms in each figure are normalized with respect to the corresponding maximum value of the reaction term in each case.
Figure 14. Transport budget terms for points 1–3 of PRF and PRF-E mixtures, at = 900 K and
= 50 bar, representing the front propagation modes. Point 1: deflagration dominates (PRF-E) vs spontaneous ignition assisted deflagration (PRF), point 2: spontaneous ignition dominates (PRF) vs spontaneous ignition assisted deflagration (PRF-E), point 3: deflagration dominates (PRF and PRF-E).
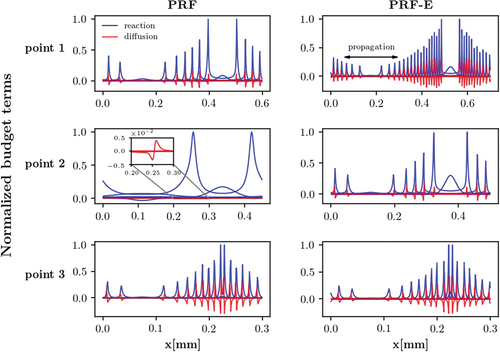
A comparison between the budget terms at point 1 shows that for both fuels, diffusion and reaction terms have similar order of magnitude (reaction term has higher absolute values). Moreover, the coincidence of reaction and diffusion peaks suggests the existence of a thin reaction front which is a characteristic feature of the deflagration mode. Furthermore, the difference between the reaction and diffusion terms for the PRF mixture is higher than for the PRF-E mixture which explains the reason for the faster propagation of the front for the PRF mixture. This also implies a more significant deflagrative propagation for the PRF-E mixture. Moreover, this observation is in agreement with point 1 being farther away from the spontaneous ignition zone in the PRF-E mixture compared to the PRF in . Therefore, at point 1, the PRF mixture is classified as spontaneous ignition assisted deflagration, while the PRF-E is in the deflagration mode.
The budget terms at point 2 show two distinct combustion modes for the PRF and PRF-E mixtures. Using a similar analogy to the previous point, the combustion mode can be categorized as spontaneous ignition assisted deflagration for the PRF-E mixture. However, the PRF mixture profiles show a negligible contribution of the diffusion term while the reaction profiles are evenly distributed at most of the time instances. Furthermore, a closer look at the front shows that the diffusion term is two orders of magnitude smaller than the reaction term. This leads to the conclusion that the dominant combustion mode at point 2 for the PRF mixture is spontaneous ignition.
Comparison of the budget terms at point 3 shows that the contribution of the diffusion term increases in the energy transport with the flame evolution even though the reaction term has comparable values. Therefore, it can be concluded that the deflagration mode has a substantial role in the front propagation at point 3 for both mixtures.
It is noteworthy that, the budget term analysis at points 1 (for both mixtures) and 2 (only for the PRF-E mixture) illustrates the sequential occurrence of different combustion modes in the domain with time progress. Transition from the ignition dominated combustion mode (initial ignition) to the deflagration mode and again to the ignition mode (secondary ignition) can be deduced from the domination of the reaction term at initial and latest time steps. This trend is attributed to the initial ignition and secondary ignition due to the heated, compressed end-gas at the latest stages. The present investigation demonstrates that the occurrence of the secondary ignition depends on two factors. First, initial reactivity of the mixture, and second, the interaction between the approaching reaction fronts. The former factor can be controlled by changing the initial temperature stratification and fuel composition. However, the latter relies on the dynamics of flame propagation (Chen and Sohrab Citation1995).
Conclusions
The present work follows the numerical framework presented earlier by the authors on combustion mode analysis of a locally stratified dual-fuel mixture under CI engines relevant conditions. Here, the previous work is extended by studying the spontaneous ignition and deflagration front propagation in the end-gas using different characteristic length scales () and amplitudes (
) of temperature stratification under SI engine relevant conditions. The work combined numerical and theoretical analyses. The theoretical results indicate a borderline between the spontaneous and deflagrative reaction front propagation regimes in
-
space by solving a one-dimensional, time dependent, diffusion-reaction problem with initially sinusoidal temperature stratification. Furthermore, hundreds of one-dimensional numerical simulations were conducted by changing the
and
of the initial stratification in order to obtain the
-
regime diagram. The numerical simulation results enabled evaluation of the theory as well as the analysis of the transient behavior of auto-ignition/flame front propagation. The aforementioned framework was applied to different averaged temperatures (830–1000 K) and pressures (20 and 50 bar) for relatively sensitive (PRF-E) and nonsensitive (PRF87) gasoline surrogates. Finally, a diagnostic approach was presented for creating the predictive combustion mode maps for various gasoline surrogates under thermal stratification. Even within the limited scope of the present numerical/theoretical study, the studied portion of the
-
phase space is noted to pose a rich topological structure. We report findings on two combustion modes which match the previous picture presented in the literature. The following conclusions are made:
The theoretical
Negative temperature coefficient (NTC) in the fuel chemistry increases the dominance of spontaneous ignition regime by reducing the variation of reactivity versus temperature and shifting the phase borders to higher
The area of spontaneous ignition zone in the
Estimated front displacement speeds from transient analysis of flame depicted that the closer the conditions are to the spontaneous ignition region, the higher the front propagation speeds are compared to the laminar flame speed, such a situation represents a blended combustion mode where the flame propagation is assisted with ignition (HTC) of reactants upstream of the flame front, indicating an spontaneous ignition assisted deflagration.
For different points on the
Acknowledgments
We would like to acknowledge Aalto University and CSC (Finnish IT Center for Science) for providing the computational resources.
Disclosure statement
No potential conflict of interest was reported by the author(s).
Additional information
Funding
References
- ASTM, D. 2013. 2699 standard test method for research octane number of spark- ignition engine fuel. Annu. Book Stand.
- ASTM, D. 2014. 2700 standard test method for motor octane number of spark- ignition engine fuel. Am. Soc. Test. Mater.
- Badra, J. A., N. Bokhumseen, N. Mulla, S. M. Sarathy, A. Farooq, G. Kalghatgi, and P. Gaillard. 2015. A methodology to relate octane numbers of binary and ternary n-heptane, iso-octane and toluene mixtures with simulated ignition delay times. Fuel 160:458–69. doi:10.1016/j.fuel.2015.08.007.
- Bates, L., D. Bradley, G. Paczko, and N. Peters. 2016. Engine hot spots: Modes of auto-ignition and reaction propagation. Combust. Flame 166:80–85. doi:10.1016/j.combustflame.2016.01.002.
- Chen, J. H., E. R. Hawkes, R. Sankaran, S. D. Mason, and H. G. Im. 2006. Di- rect numerical simulation of ignition front propagation in a constant volume with temperature inhomogeneities: I. fundamental analysis and diagnostics. Combust. Flame 145 (1–2):128–44. doi:10.1016/j.combustflame.2005.09.017.
- Chen, C., and S. Sohrab. 1995. Upstream interactions between planar symmetric laminar methane premixed flames. Combust. Flame 101 (3):360–70. doi:10.1016/0010-2180(94)00214-D.
- Cheng, S., D. Kang, A. Fridlyand, S. S. Goldsborough, C. Saggese, S. Wagnon, M. J. McNenly, M. Mehl, W. J. Pitz, and D. Vuilleumier. 2020. Autoignition behavior of gasoline/ethanol blends at engine-relevant conditions. Combust. Flame 216:369–84. doi:10.1016/j.combustflame.2020.02.032.
- Curran, H. J., P. Gaffuri, W. J. Pitz, and C. K. Westbrook. 1998. A comprehensive modeling study of n-heptane oxidation. Combust. Flame 114 (1–2):149–77. doi:10.1016/S0010-2180(97)00282-4.
- Curran, H. J., P. Gaffuri, W. J. Pitz, and C. K. Westbrook. 2002. A comprehensive modeling study of iso-octane oxidation. Combust. Flame 129 (3):253–80. doi:10.1016/S0010-2180(01)00373-X.
- Dai, P., Z. Chen, S. Chen, and Y. Ju. 2015. Numerical experiments on reaction front propagation in n-heptane/air mixture with temperature gradient. Proc. Combust. Inst. 35 (3):3045–52. doi:10.1016/j.proci.2014.06.102.
- Dirrenberger, P., P.-A. Glaude, R. Bounaceur, H. Le Gall, A. P. Da Cruz, A. Konnov, and F. Battin-Leclerc. 2014. Laminar burning velocity of gasolines with addition of ethanol. Fuel 115:162–69. doi:10.1016/j.fuel.2013.07.015.
- Fang, R., C. Saggese, S. W. Wagnon, A. B. Sahu, H. J. Curran, W. J. Pitz, and C.-J. Sung. 2022. Effect of nitric oxide and exhaust gases on gasoline surrogate autoigni- tion: Iso-octane experiments and modeling. Combust. Flame 236:111807. doi:10.1016/j.combustflame.2021.111807.
- Fikri, M., J. Herzler, R. Starke, C. Schulz, P. Roth, and G. Kalghatgi. 2008. Au- toignition of gasoline surrogates mixtures at intermediate temperatures and high pressures. Combust. Flame 152 (1–2):276–81. doi:10.1016/j.combustflame.2007.07.010.
- Frassoldati, A., A. Cuoci, T. Faravelli, and E. Ranzi. 2010. Kinetic modeling of the oxidation of ethanol and gasoline surrogate mixtures. Combust. Sci. Technol. 182 (4–6):653–67. doi:10.1080/00102200903466368.
- Gauthier, B., D. F. Davidson, and R. K. Hanson. 2004. Shock tube determination of ignition delay times in full-blend and surrogate fuel mixtures. Combust. Flame 139 (4):300–11. doi:10.1016/j.combustflame.2004.08.015.
- Goodwin, D. G., R. L. Speth, H. K. Moffat, and B. W. Weber. 2018. Cantera: An object-oriented software toolkit for chemical kinetics, thermodynamics, and trans- port processes. Version 2.4.0.
- Gordon, R. L., A. R. Masri, S. B. Pope, and G. M. Goldin. 2007. Transport budgets in turbulent lifted flames of methane autoigniting in a vitiated co-flow. Combust. Flame 151 (3):495–511. doi:10.1016/j.combustflame.2007.07.001.
- Gu, X., D. Emerson, and D. Bradley. 2003. Modes of reaction front propagation from hot spots. Combust. Flame 133 (1–2):63–74. doi:10.1016/S0010-2180(02)00541-2.
- Gupta, S., H. G. Im, and M. Valorani. 2013. Analysis of n-heptane auto-ignition characteristics using computational singular perturbation. Proc. Combust. Inst. 34 (1):1125–33. doi:10.1016/j.proci.2012.07.077.
- Hawkes, E. R., R. Sankaran, P. P. Pébay, and J. H. Chen. 2006. Direct numerical simulation of ignition front propagation in a constant volume with temperature inhomogeneities: Ii. parametric study. Combust. Flame 145 (1–2):145–59. doi:10.1016/j.combustflame.2005.09.018.
- Jerzembeck, S., N. Peters, P. Pepiot-Desjardins, and H. Pitsch. 2009. Laminar burn- ing velocities at high pressure for primary reference fuels and gasoline: Experimental and numerical investigation. Combust. Flame 156 (2):292–301. doi:10.1016/j.combustflame.2008.11.009.
- Kahila, H., A. Wehrfritz, O. Kaario, M. G. Masouleh, N. Maes, B. Somers, and V. Vuorinen. 2018. Large-eddy simulation on the influence of injection pressure in reacting spray a. Combust. Flame 191:142–59. doi:10.1016/j.combustflame.2018.01.004.
- Kahila, H., A. Wehrfritz, O. Kaario, and V. Vuorinen. 2019. Large-eddy simula- tion of dual-fuel ignition: Diesel spray injection into a lean methane-air mixture. Combust. Flame 199:131–51. doi:10.1016/j.combustflame.2018.10.014.
- Kalghatgi, G., D. Bradley, J. Andrae, and A. Harrison (2009), The nature of ‘super- knock’and its origins in si engines, in ‘IMechE conference on internal combustion engines: performance fuel economy and emissions’, pp. 8–9.
- Karimkashi, S., H. Kahila, O. Kaario, M. Larmi, and V. Vuorinen. 2020. A nu- merical study on combustion mode characterization for locally stratified dual-fuel mixtures. Combust. Flame 214:121–35. doi:10.1016/j.combustflame.2019.12.030.
- Krisman, A., E. R. Hawkes, and J. H. Chen. 2018. The structure and propagation of laminar flames under autoignitive conditions. Combust. Flame 188:399–411. doi:10.1016/j.combustflame.2017.09.012.
- Lee, C., A. Ahmed, E. F. Nasir, J. Badra, G. Kalghatgi, S. M. Sarathy, H. Curran, and A. Farooq. 2017. Autoignition characteristics of oxygenated gasolines. Combust. Flame (186):114–28. doi:10.1016/j.combustflame.2017.07.034.
- Luong, M. B., Z. Luo, T. Lu, S. H. Chung, and C. S. Yoo. 2013. Direct numerical simulations of the ignition of lean primary reference fuel/air mixtures with temper- ature inhomogeneities. Combust. Flame 160 (10):2038–47. doi:10.1016/j.combustflame.2013.04.012.
- Luong, M. B., R. Sankaran, G. H. Yu, S. H. Chung, and C. S. Yoo. 2017. On the effect of injection timing on the ignition of lean prf/air/egr mixtures under direct dual fuel stratification conditions. Combust. Flame 183:309–21. doi:10.1016/j.combustflame.2017.05.023.
- Masouleh, M. G., K. Keskinen, O. Kaario, H. Kahila, S. Karimkashi, and H. Vuorinen. 2019. Modeling cycle-to-cycle variations in spark ignited combustion engines by scale-resolving simulations for different engine speeds. Appl. Energy 250:801–20. doi:10.1016/j.apenergy.2019.03.198.
- Masouleh, M. G., K. Keskinen, O. Kaario, H. Kahila, Y. M. Wright, and V. Vuorinen. 2018. Flow and thermal field effects on cycle-to-cycle variation of combustion: Scale-resolving simulation in a spark ignited simplified engine configuration. Appl. Energy 230:486–505. doi:10.1016/j.apenergy.2018.08.046.
- Mehl, M., J.-Y. Chen, W. J. Pitz, S. M. Sarathy, and C. K. Westbrook. 2011a. An approach for formulating surrogates for gasoline with application toward a reduced surrogate mechanism for cfd engine modeling. Energy & Fuels 25 (11):5215–23. doi:10.1021/ef201099y.
- Mehl, M., W. J. Pitz, C. K. Westbrook, and H. J. Curran. 2011b. Kinetic modeling of gasoline surrogate components and mixtures under engine conditions. Proc. Combust. Inst. 33 (1):193–200. doi:10.1016/j.proci.2010.05.027.
- Naser, N., S. Y. Yang, G. Kalghatgi, and S. H. Chung. 2017. Relating the octane numbers of fuels to ignition delay times measured in an ignition quality tester (iqt). Fuel 187:117–27. doi:10.1016/j.fuel.2016.09.013.
- Niemeyer, K. E., N. J. Curtis, and C.-J. Sung. 2017. pyjac: Analytical jacobian generator for chemical kinetics. Comput. Phys. Commun. 215 ():188–203. doi:10.1016/j.cpc.2017.02.004.
- Nogawa, T., and H. Terashima. 2020. Effects of globally stratified temperature distri- butions and ntc characteristics on end-gas combustion modes. Combust. Sci. Technol. 1–25. doi:10.1080/00102202.2020.1817904.
- Ranzi, E., A. Frassoldati, R. Grana, A. Cuoci, T. Faravelli, A. Kelley, and C. Law. 2012. Hierarchical and comparative kinetic modeling of laminar flame speeds of hydrocarbon and oxygenated fuels. Prog. Energy Combust. Sci. 38 (4):468–501. doi:10.1016/j.pecs.2012.03.004.
- Ranzi, E., A. Frassoldati, A. Stagni, M. Pelucchi, A. Cuoci, and T. Faravelli. 2014. Reduced kinetic schemes of complex reaction systems: Fossil and biomass-derived transportation fuels. Int. J. Chem. Kinet. 46 (9):512–42. doi:10.1002/kin.20867.
- Sankaran, R. (2015), Propagation velocity of a deflagration front in a preheated au- toigniting mixture, technical report, Oak Ridge National Lab.(ORNL), Oak Ridge, TN (United States). Oak Ridge.
- Sankaran, R., H. G. Im, E. R. Hawkes, and J. H. Chen. 2005. The effects of non- uniform temperature distribution on the ignition of a lean homogeneous hydrogen– Air mixture. Proc. Combust. Inst. 30 (1):875–82. doi:10.1016/j.proci.2004.08.176.
- Sarathy, S. M., A. Farooq, and G. T. Kalghatgi. 2018. Recent progress in gasoline surrogate fuels. Prog. Energy Combust. Sci. 65:67–108.
- Singh, E., E.-A. Tingas, D. Goussis, H. G. Im, and S. M. Sarathy. 2019. Chemical ignition characteristics of ethanol blending with primary reference fuels. Energy & Fuels 33 (10):10185–96. doi:10.1021/acs.energyfuels.9b01423.
- Stagni, A., A. Frassoldati, A. Cuoci, T. Faravelli, and E. Ranzi. 2016. Skeletal mechanism reduction through species-targeted sensitivity analysis. Combust. Flame 163:382–93. doi:10.1016/j.combustflame.2015.10.013.
- Szybist, J. P., and D. A. Splitter. 2017. Pressure and temperature effects on fuels with varying octane sensitivity at high load in si engines. Combust. Flame 177:49–66. doi:10.1016/j.combustflame.2016.12.002.
- Wang, Z., H. Liu, and R. D. Reitz. 2017. Knocking combustion in spark-ignition engines. Prog. Energy Combust. Sci. 61:78–112.
- Wang, Z., Y. Qi, X. He, J. Wang, S. Shuai, and C. K. Law. 2015. Analysis of pre- ignition to super-knock: Hotspot-induced deflagration to detonation. Fuel 144:222–27. doi:10.1016/j.fuel.2014.12.061.
- Wang, H., M. Yao, and R. D. Reitz. 2013. Development of a reduced primary refer- ence fuel mechanism for internal combustion engine combustion simulations. Energy & Fuels 27 (12):7843–53. doi:10.1021/ef401992e.
- Wei, H., Y. Wang, L. Zhou, L. Zhong, J. Yu, and X. Zhang. 2021. End-gas autoignition mechanism in a downsized spark-ignition engine: Effect of inhomogeneity. Combust. Sci. Technol. 1–28.
- Weller, H. G., G. Tabor, H. Jasak, and C. Fureby. 1998. A tensorial approach to computational continuum mechanics using object-oriented techniques. Comput. Phys. 12 (6):620–31. doi:10.1063/1.168744.
- Yoo, C. S., T. Lu, J. H. Chen, and C. K. Law. 2011. Direct numerical simulations of ignition of a lean n-heptane/air mixture with temperature inhomogeneities at constant volume: Parametric study. Combust. Flame 158 (9):1727–41. doi:10.1016/j.combustflame.2011.01.025.
- Yoo, C. S., Z. Luo, T. Lu, H. Kim, and J. H. Chen. 2013. A dns study of igni- tion characteristics of a lean iso-octane/air mixture under hcci and saci conditions. Proc. Combust. Inst. 34 (2):2985–93. doi:10.1016/j.proci.2012.05.019.
- Zeldovich, Y. B. 1980. Regime classification of an exothermic reaction with nonuni- form initial conditions. Combust. Flame 39 (2):211–14. doi:10.1016/0010-2180(80)90017-6.
- Zhou, L., K. Li, J. Zhao, X. Zhang, and H. Wei. 2020. Experimental observation of end-gas autoignition and developing detonation in a confined space using gasoline fuel. Combust. Flame 222:1–4. doi:10.1016/j.combustflame.2020.08.035.
Appendix A
Chemical mechanism validation
In this section, we present the chemical mechanism validation. Here, the utilized chemical mechanisms are chosen based on the comparison of the calculated IDT and the 1D laminar flamea speed with available experimental data (Dirrenberger et al. Citation2014; Fikri et al. Citation2008; Gauthier, Davidson, Hanson Citation2004; Jerzembeck et al. Citation2009). As mentioned in section 2.3, constant volume 0D homogeneous reactor and 1D premixed flame modules of Cantera are used for calculation of IDT and flame speed, respectively. In order to maintain the numerical feasibility of the simulations, only reduced mechanisms have been examined in the present study. Another important aspect considered in our selection was the validity of the mechanisms at high pressures. Details on the studied mechanisms are provided in the following, first for the PRF (PRF87) and then for the PRF-E mixture.
Regarding to the PRF, Jerzembeck et al. (Citation2009) developed two reduced mechanisms for the PRF combustion, one for only high temperature chemistry (HTC) with 99 species and 669 reactions, and the other for combined HTC-LTC with 203 species and 1071 reactions, based on the Lawrence Livermore (LLNL) detailed mechanisms (Curran et al. Citation1998, Citation2002). Moreover, they provided an experimental data set for laminar flame speeds of -heptane, iso-octane and PRF 87 mixtures at engine relevant conditions. Wang, Yao, and Reitz (Citation2013) proposed a reduced mechanism with 73 species and 296 reactions for diesel/gasoline combustion based on the LLNL detailed mechanism (Mehl et al. Citation2011b). A 171 species and 861 reactions PRF skeletal mechanism was developed by Luong et al. (Citation2013) using the LLNL detailed mechanisms (Curran et al. Citation1998, Citation2002) and further validated in Perfectly Stirred Reactors for IDT and extinction residence times. Moreover, Mehl et al. (Citation2011a) provided a reduced version of the detailed LLNL mechanism for CFD engine modeling. The mechanism has been reduced and validated based on a target non-oxygenated gasoline surrogate containing four components.
and show the comparison between the PRF mixture, the calculated IDT values, and measurements (Gauthier, Davidson, Hanson Citation2004) at 20 and 50 bar, respectively. In addition, to compare the performance of the reduced mechanisms, results from a recent gasoline surrogate detailed mechanism by Fang et al. (Citation2022), comprised of 1543 species and 8725 reactions, are included. According to the examined mechanisms are in a good agreement with the experimental data. However, the NTC behavior has been predicted differently. In fact, Wang mechanism did not predict any NTC behavior for both of the investigated pressures. Note that results of the Jerzembeck HTC mechanism are not provided since the mechanism did not include LTC related reactions.
Figure A1. PRF 87, ignition delay time versus temperature, circles display experimental data. (Gauthier, Davidson, Hanson Citation2004).
Furthermore, the mechanisms have been evaluated against experimental high pressure flame speed data (Jerzembeck et al. Citation2009). According to the literature, the steady state solution of premixed flame using solvers such as Cantera would not converge under auto-ignitive conditions (high pressures and intermediate temperatures). The problem is relevant to the low temperature reactions initiating a secondary flame upstream of the primary reaction zone and violating the cold boundary condition assumption for steady state solutions. This problem can be addressed by excluding the LTC reactions from the mechanism for prediction of flame propagation only, e.g. Jerzembeck HTC mechanism. However, recent studies of Sankaran (Citation2015) and Krisman, Hawkes, and Chen (Citation2018) shows that for a sufficiently small domain, the steady state solution is converging to reaction rates associated with single stage ignition. Therefore, in the present study the same approach has been taken to find the correct domain length for convergence.
depicts the predicted laminar flame speeds versus equivalence ratio against experimental data at 20 bar and 298 K initial temperature. It is observed from that the Wang, Luong, and LLNL reduced mechanisms underpredict the laminar flame speed. As stated earlier, except for the Polimi mechanisms all other mechanisms are developed based on the LLNL detailed mechanism, however, only Jerzembeck et al. (Citation2009) considered the high pressure laminar flame speeds at the development stage, and hence their mechanisms results deviate from others.
Figure A2. Laminar flame speed versus equivalence ratio for PRF 87 combustion at 298 K and 20 bar, circles display experimental data. (Jerzembeck et al. Citation2009).
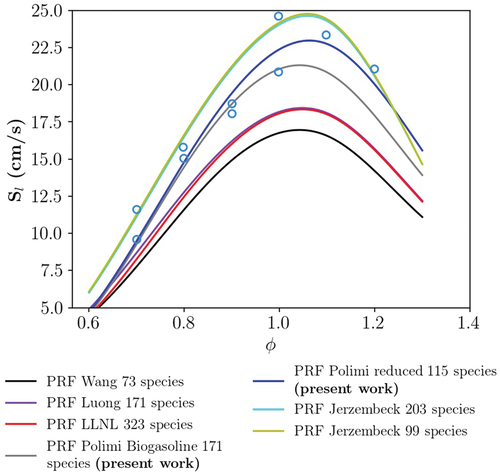
shows that although Polimi Biogasoline mechanism underpredicts the laminar flame speed for rich mixtures, results of both mechanisms are in agreement with experiments at stoichometric equivalence ratio (considered in the present study). Based on the above validation results, Polimi reduced mechanism has been chosen for the PRF mixture related simulations.
Regarding to the PRF-E, Ranzi et al. (Citation2014), developed a number of skeletal mechanisms for typical surrogate mixtures using reaction flux analysis. They also extended the reaction mechanisms for biogasolines, providing a 171 species and 3751 reactions mechanism including ethanol (POLIMI BIOGASOLINE 171). The mechanism has been validated against alcohols atmospheric laminar flame speeds and the PRF-ethanol ignition delay time measurements (Fikri et al. Citation2008). Based on the POLIMI 1412 mechanism (Ranzi et al. Citation2012), Stagni et al. (Citation2016) proposed a reduced mechanism with 115 species and 856 reactions using a novel automatic mechanism reduction method.
Further validations have been conducted in order to assess the Polimi Biogasoline mechanism performance using the PRF-E mixture IDT and pure ethanol laminar flame speed data sets (Dirrenberger et al. Citation2014; Fikri et al. Citation2008). shows the comparison between the PRF-E ignition delay data and the experiments. Moreover, the predicted laminar flame speed of pure ethanol against experimental data is shown in .
Figure A3. Ignition of PRF-E/air stoichiometric mixtures predicted by Polimi Biogasoline mechanism at different pressures, symbols depict experiments (Fikri et al. Citation2008).
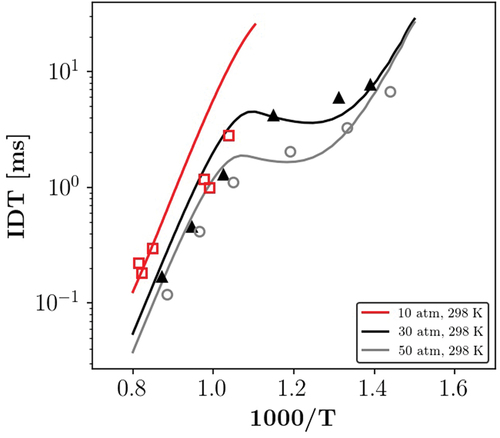
Figure A4. Laminar flame speeds of pure ethanol predicted by Polimi Biogasoline mechanism, symbols depict experiments (Dirrenberger et al. Citation2014).
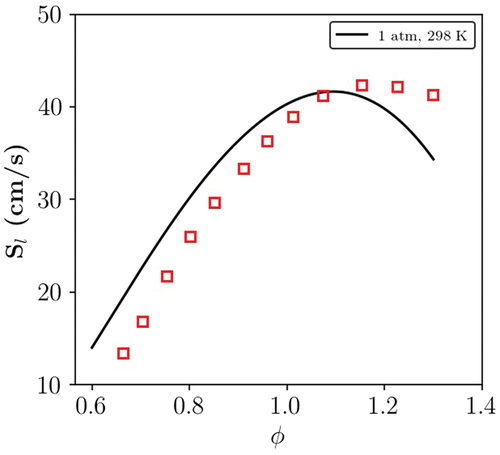
and A4 show that the PRF-E IDTs at different pressures using the Polimi Biogasoline mechanism are in good agreement with experimental data. Based on present validation results, the Polimi Biogasoline mechanism has been chosen for the PRF-E mixture simulations.