
 ?Mathematical formulae have been encoded as MathML and are displayed in this HTML version using MathJax in order to improve their display. Uncheck the box to turn MathJax off. This feature requires Javascript. Click on a formula to zoom.
ABSTRACT
Experiments were performed to investigate the ensemble combustion of a linear array of three coaxial liquid oxygen/gaseous hydrogen turbulent non-premixed jet flames, under the influence of transverse acoustic forcing. The results are systematically compared to the results from a predecessor study of the same ensemble of flames under the same conditions, but without acoustic forcing. Both pressure nodes (PN) and pressure antinodes (PAN) were investigated as a function of the outer-to-inner momentum flux ratio. Shadowgraphs and OH* emission imaging showed that PNs distort the flames more than PANs, similar to previous observations in single flames. A wave amplification mechanism (WAM) identified previously to be present both in single flames and in the unforced ensemble of flames was found to also be present under acoustic forcing. In the predecessor study without acoustics, the WAM tended to self-organize within the ensemble into an out-of-phase varicose nesting that minimized large-scale collisions. In the present study, PN forcing tended to organize the WAM structures into a sinuous nesting, which also minimized collisions. PAN forcing, on the other hand, promoted destructive in-phase varicose nesting that promoted large-scale collisions, causing subsequent breakdown into smaller scales. Dynamic Mode Decomposition revealed natural frequencies and modes in addition to the acoustic quantities. Discrete combustion waves related to the WAM propagated at the same normalized average velocities regardless of whether acoustics were present in the ensemble or not. However, the trajectories are grouped into different curves than for single-element flames.
Introduction
In liquid rocket engines, propellants are typically introduced into the combustion chamber through arrays of identical or nearly identical individual injector elements, arranged in patterns over a usually circular plate or dome at the upstream end of the combustion chamber (Sutton and Biblarz Citation2017). The number of individual elements in application can range from a few elements to several hundred or more. Because many of the individual elements are often the same, it can be tempting to reduce development costs by performing experimental and computational studies on only a single element to reveal essential physics before committing to a full scale multielement design. This reasoning has led to many single-element studies in the past. Previous single-element studies include earlier studies by the present authors, who investigated the combustion behavior of single coaxial elements under conditions very similar to the conditions in this paper, both without (Roa and Talley Citation2019) and with (Roa and Talley Citation2021) transverse acoustics. See the literature reviews in those papers for a more extensive entry into the single-element literature.
A deficiency of single-element studies is that they cannot address inter-element interactions, which can and usually do cause a multielement ensemble to behave different from what a simple superposition of isolated single-element behaviors would predict. An important source of inter-element interactions is the turbulent combustion that occurs between the elements. The turbulent combustion interactions may be further modified if acoustic waves are present, such as those which can be produced by acoustic combustion instabilities. To address this deficiency of single-element investigations, the recent literature has seen a relative growth in multi-element investigations. The latter investigations can be characterized as taking a more intermediate approach, whereby studies are conducted on more than a single element, but considerably fewer than the full number of elements, in various subscale representative arrangements. The present study is in this class. In particular, a linear array of three coaxial injectors is considered here, each of which consists of a non-premixed flow of liquid oxygen (LOX) in a central round jet, surrounded by a flow of gaseous hydrogen (GH2) in an enveloping annular jet. This is a common geometry and propellant combination in many boost and upper stage liquid rocket engines. See Roa and Talley (Citation2022) for more details.
In the predecessor paper, Roa and Talley (Citation2022) investigated the ensemble combustion behavior of such an array, where no organized acoustic waves were present. The dominant mechanism of interelement interactions was the turbulent combustion alone. In the present paper, the same array is investigated under closely the same turbulent conditions, except that in this study, transverse acoustic forcing was introduced. An important contribution of the present paper that is often absent in other literature is a systematic comparison of the ensemble behavior of the linear array under otherwise the same conditions. Additionally, further insight may be gained by comparing these most recent papers with the earlier papers (Roa and Talley Citation2019, Citation2021), where similar comparisons were performed on isolated single elements, under closely the same conditions as the more recent multi-element studies.
In what follows, the background and recent literature on multi-element combustion investigations, which emphasized acoustics, will be reviewed in section 2. The present experimental configuration will then be summarized and placed into relevant context with previous studies by the authors in section 3. This is followed by an exposition of the results in section 4, and a discussion in section 5. Conclusions are presented in section 6.
Background and literature review
As was observed by Roa and Talley (Citation2022), most of the recent relevant studies that included inter-element combustion interactions in an ensemble were in fact concerned mainly with the presence of acoustic waves, motivated by a major interest in combustion instabilities. The present study was motivated by the same consideration. Nevertheless, smaller portions of many of these studies often considered interactions in the absence of acoustics, usually in order to baseline the subsequent acoustic results, but typically not very systematically. These smaller portions pertaining to the non-acoustic results were reviewed previously by (Roa and Talley Citation2022). The review here will return to much of the same literature as well as some new citations, but this time it will address the acoustic results. Only literature that includes combustion is included. Since much of the literature reviewed here was introduced in the previous paper, some of the introductory remarks to the various studies may be partially reproduced.
Rey et al. (Citation2004) investigated a transversely forced linear array of three LOX/GH2 coaxial injectors in a configuration similar to that of the present investigation, but with a larger inter-element spacing than that was used here, about 5 LOX diameters compared to 2.8 LOX diameters. The chamber pressure was 0.9 MPa, and the momentum flux ratio (density times the velocity squared of the outer flow divided by that of the inner flow, typically denoted as J) was 17. Transverse acoustic forcing was provided by modulating a side nozzle with a rotating toothed wheel. The diagnostics consisted of time-averaged and phase-averaged visualization of OH* radicals plus high-frequency wall pressure measurements. Results were reported without modulation and for the first transverse mode of 3330 Hz, for which the amplitude was 70 mbar (7 kPa) or about 0.8% of the mean chamber pressure. The modulated flame was found to be axially shorter on average than without modulation. Far enough downstream, the modulation was found to cause the jets to become intermingled and to cause collisions between large-scale structures. The collisions, in turn, caused hot spots in the heat release that could theoretically drive combustion instabilities. The center jet tended to be longer than the outer jets with or without modulation.
The fuel in the (Rey et al. Citation2004) experiment was subsequently changed from hydrogen to room temperature and subcooled gaseous methane at the same chamber pressure by (Richecoeur et al. Citation2006, Citation2006b), in order to increase the sensitivity to acoustic forcing. With the same toothed wheel modulation technique, the increased sensitivity of methane to acoustic perturbations allowed amplitudes to be driven as high as 8% of the average chamber pressure for the first tangential mode, a factor of 10 higher than (Rey et al. Citation2004) that for hydrogen. The interelement spacing was reduced to 3.4 LOX diameters. The table of operating points indicates momentum flux ratios ranging from 5 to 20, but a systematic study of acoustic forcing was only reported for a value near 5. Acoustic forcing was applied at two gaseous methane temperatures, 180 K and 280 K. Imaging of CH* radicals was added to the diagnostics in addition to OH*, as well as additional photomultiplier tubes to monitor integrated light emissions. However, CH* imaging did not reveal significant additional information not already revealed by the OH* imaging. Both with and without forcing, the individual jets tended to develop mainly axially on average, with no bias of the outer jets inward or outward relative to the center jet. However, forcing tended to increase the spreading rates both of each jet individually and of the entire ensemble. The low-temperature methane tended to be less stable to natural fluctuations, meaning that the natural fluctuations in the OH* emission were larger. However, low-temperature methane was less sensitive to acoustic forcing, that is, acoustics increased the low-temperature spreading rate less. Forcing tended to cause larger integrated OH* intensities, and the size of the convected reactive vortices was found to increase.
Mery et al. (Citation2013) and Hakim et al. (Citation2015) extended the above results to experimental and computational investigations, respectively, of five linear coaxial LOX/methane elements, higher pressures, and more powerful acoustic forcing. Peak-to-peak amplitudes as high as 20% of the mean chamber pressure could be achieved, depending on the acoustic eigenmode excited. Similar diagnostics were used as for previous experimental studies, except that shadowgraphs were added for the central element only.
Mery et al. (Citation2013) experimentally mainly considered a chamber pressure of 2.6 MPa and a momentum flux ratio of 2. In the steady state without forcing, the five jets were found to expand slightly as an ensemble, with each jet developing mainly axially with little bias of the outer elements toward or away from the center jet. At moderate amplitudes corresponding to 1 T acoustic forcing, the ensemble expansion angle increased and the outer elements tended to diverge symmetrically away from the center jet. The divergence was possibly a result of the method of acoustic forcing, which employed two exit nozzles on each side of the chamber, periodically blocked and unblocked by a rotating toothed wheel, such that when one nozzle was blocked, the other was unblocked. The reaction zone surrounding each jet was found to be flattened, with the long direction perpendicular to the direction of the acoustic waves. At higher amplitudes corresponding to 1T2L acoustic forcing, the flames became noticeably shorter and the symmetry was broken, with all flames appearing to orient toward one side of the chamber. One suspects that the mean flow may have been skewed through one of the two nozzles more than the other in this case. It is also possible that the flames became displaced from acoustic nodes and experienced acoustic streaming, but this would not be consistent with the mode shapes reported.
Hakim et al. (Citation2015) performed high fidelity large eddy simulations (LES) of the same experiment as Mery et al. (Citation2013), but of a different experimental case than that reported in the earlier publication. The case analyzed was for a higher transcritical chamber pressure of 6.7 MPa and for a somewhat higher momentum flux ratio of 3.7. The acoustic forcing was 1T1L. The agreement between the experiments and simulations was in many respects quite good. In contrast to (Mery et al. Citation2013), the two outer flames under acoustic forcing were found to converge slightly toward the center instead of diverge slightly outwards. In addition, the outer element flames were shorter than the center flame. Both effects were probably due to the different nature of the flow for this acoustic mode compared to Mery et al. (Citation2013). Once again, the individual jets were found to be flattened. Notably, the authors noticed that around each jet, “the methane jet … is violently shaken by the acoustic field,” while “the dense [LOX] region remains flat and nearly still … Thick pockets of burnt gases are thus alternatively created above and below the dense core” (the jets were oriented horizontally, and the vertical direction was the direction of the acoustic waves). Such a description is consistent with what will later be called a “wave amplification mechanism” below.
Hardi et al. (Citation2014b, Citation2014) and Hardi, Oschwald, Dally (Citation2011) studied an array of five acoustically forced LOX/GH2 coaxial injectors, but not in a linear array. In their experiment, the injectors were arranged in a pentad configuration with four injectors at the corners of a square and one injector in the center. Experiments were performed at pressures of 4 MPa (subcritical with respect to oxygen) and 6 MPa (supercritical) and at momentum flux ratios ranging from 1 to 10. The inter-element spacing was 2.6 LOX jet diameters – equivalent to that of the present study. Similar to Rey et al. (Citation2004), acoustic driving was provided by a single side nozzle near the injector end of the combustion chamber equipped with a rotating toothed wheel. Acoustic amplitudes up to 8% of the mean chamber pressure could be produced. The arrangement was capable of producing both transverse and longitudinal acoustic waves in the combustion chamber; the transverse results are the most relevant here. Shadowgraphs and OH* visualization were once again the main diagnostics employed. Under transverse acoustic driving, they observed a significant shortening of the LOX core lengths due to acoustic motions stripping away core structures before they could grow and detach naturally. However, unlike the studies cited above, they did not observe the acoustics to bend or deflect the LOX cores, which they attributed to greater LOX core momenta than other experiments. While the gases from outer elements expanded outwards into the space around them, the flow from the central element developed more or less axially. This trend persisted with or without acoustics, although the acoustics altered the flame patterns. Considerable effort was given to measuring Rayleigh indices and response factors, as compensated for convective motions.
Thus far, the need to provide for the presence of acoustic drivers required that the side walls are distant from the end elements of the linear arrays. Of these studies, only Hardi, Oschwald, and Dally (Citation2011), (Citation2014), (Citation2014b) found a noticeable tendency of the combustion gases to expand to fill the gaps between the end elements and the walls. The next studies did not employ acoustic drivers, and the end elements were closely bound by walls. They, as well as some unforced studies reviewed in Roa and Talley (Citation2022), all noticed a tendency of the combustion gases to expand to fill the gaps between the end elements and the walls.
Urbano et al. (Citation2017, Citation2016) and Schmitt et al. (Citation2017) performed large eddy simulations (LES) of a full-scale engine configuration containing 42 coaxial LOX/H2 elements. They computed cases experiencing both stable and unstable combustion. The flow conditions were transcritical where the chamber pressure was supercritical at 8 MPa, while the initial LOX temperature was subcritical at 111 K. The outer elements were closely bound by walls, and the simulations showed expansion of the flame gases to fill the gaps between the elements and the walls. Many characteristics of the full scale experimental data were successfully reproduced. In querying their unstable numerical data for individual element behaviors within the 42-element array, they noticed flattening in some of the flames depending on whether the injector response was one of two main types, namely, A-types and N-types. A-type responses were produced by injectors located at pressure anti-nodes (PANs) and remained roughly round due to the lack of appreciable acoustic velocity fluctuations that would cause asymmetries. N-type responses, on the other hand, were produced by injectors located at pressure nodes (PNs) and were the responses that included flame flattening. This is the same behavior noticed at PNs by Hakim et al. (Citation2015). In addition, it was found that the heat release fluctuations and the contributions to the Rayleigh index were much larger for A-type flames than for N-type flames. They concluded that the flames driving unsteady acoustics tend to be mostly A-flames located at PANs, because pressure fluctuations tended to be zero for N-flames located at PANs, causing the Rayleigh index to tend to be locally zero. An implication for simplified response function modeling suggested that it could be adequate to relate the unsteady heat release mainly to the acoustic pressure fluctuations and ignore the velocity fluctuations.
A large number of experimental and associated modeling studies were performed on stable and unstable experiments on linear arrays of injectors at Purdue University. In all these experiments, the outer elements of the array were closely bounded by walls, and many of the studies noticed an expansion of the combustion gases to fill the gaps between the outer elements and the walls. The relevant literature is only partially cited here; the reader may consult the references contained within the present citations for a more complete list.
Pant and Wang (Citation2019) reviewed four generations of experimental designs that have been experimentally and theoretically studied by various groups, the latter not limited to Purdue groups, beginning about 2008 (Pomeroy, Lamont, Anderson Citation2009; Pomeroy et al. Citation2008) and up to very recently (Gejji et al. Citation2020; Harvazinski et al. Citation2019). The oxidant was gaseous oxygen having various amounts of vitiation, produced either from decomposed hydrogen peroxide or from an oxygen-rich hydrogen/oxygen preburner. Various fuels were also studied, for example, methane, ethane, and various blends of kerosene (JP-8, RP-1). Various numbers of injectors were used in the linear array, up to nine. Almost all of the injectors, with the exception of the impinging elements examined by (Pomeroy, Nugent, Anderson Citation2010), were of the coaxial class. However, they were in a sense “inverse” to the coaxial elements used in this study and reviewed thus far. That is to say, the oxidant in the center post was a gas, not a liquid, while the fuel in the annular region was not always a gas but could also be a liquid, and was swirled. Another important difference was that the center post of each element was recessed to various extents into a “cup” formed by an extended outer annular wall, such that any combustion happening in the cup tended to be shielded by varying extents from transverse gas motions in the main chamber, including transverse acoustics. This configuration was motivated by designs used in the Former Soviet Union (Dranovsky Citation2007). As mentioned above, the experiments did not use acoustic drivers but relied instead on naturally occurring instabilities. Wave amplitudes as high as 100% of the mean chamber pressure could be reached (Gejji et al. Citation2020). Besides the “inverse” geometry, an important difference from the other studies cited thus far is that the acoustic waves in these experiments tended to be steep-fronted, shock-like traveling waves rather than standing waves. This meant that pressure and velocity fluctuations tended to be in-phase instead of 90 degrees out-of-phase, as with standing waves.
A broad generalization of the overall behavior found in these experiments, differing in many details depending on the case, may be stated as follows: strong-fronted traveling waves sweep across the inner elements and expose them one by one to simultaneous pressure and velocity fluctuations. Strong evidence exists for enhanced mixing and heat release in the wake or downwind side of these waves. This was seen in simulations, for example, by Shipley et al. (Citation2013), Harvazinski et al. (Citation2019), and Pant and Wang (Citation2019), the latter of which stated that this caused more uniform combustion across the central elements. Orth et al. (Citation2018) experimentally observed enhanced CH* emission in the presence of acoustic waves, and Gejji et al. (Citation2020) experimentally observed that the chemiluminescence emission is more evenly distributed. The enhanced combustion in the wake of the waves plays a role in driving the waves. Shipley et al. (Citation2013) more precisely attributed this to vortex collisions, between vortices or with walls, which causes rapid heat release that drives the instability. The same process has been widely noted by other authors, for instance, Rogers and Marble (Citation1956) and Poinsot et al. (Citation1987). It is notable in passing that while Harvazinski et al. (Citation2019) noted somewhat singular behavior of the center element, namely, comparatively little combustion occurring in the cup compared with the rest of the elements, no such effect was observed by Pant and Wang (Citation2019). The Harvazinski et al. (Citation2019) observations also seem to have been at least partially confirmed experimentally by Gejji et al. (Citation2020). The authors used different models and the reason for the difference in these results has not been identified.
Despite being subjected simultaneously to pressure and velocity fluctuations, it appears to be the velocity fluctuations, which sweep the central elements and are strong enough to deform the flames nearly simultaneously into sinuous shapes, as well as significantly shortening the flames. Such sinuous shapes have been noticed experimentally (Gejji et al. Citation2020; Orth et al. Citation2018) and computationally (Pant and Wang Citation2019; Shipley et al. Citation2014, Citation2013; Tudisco, Ranjan, Menon Citation2016), while the flame shortening has been observed mainly computationally, due to the relative difficulty of observing such effects experimentally. The sinuosity and shortening of the flames has many similarities to flames in the pressure node (PN) of standing waves such as was observed in the other literature cited above. However, there has been no mention that these “inverse” flames (gas in the center and liquid in the annulus) could also be flattened by the acoustics as has been noted for the “conventional” coaxial injectors earlier. One can imagine a number of possible reasons why the “inverse” flames might in fact not flatten, but to authors’ knowledge, this question has not been addressed.
Although produced by traveling waves, the acoustic velocity fluctuations of the outer elements near the walls are inhibited by the presence of the walls. For this reason, the outer elements can behave more like flames in the pressure anti-node (PAN) of standing waves. These outer flames were observed to be longer than the more central flames by Harvazinski et al. (Citation2019) and Pant and Wang (Citation2019). Pant and Wang (Citation2019) suggested that in addition to inhibiting bulk acoustic motions, the walls tend to inhibit turbulent motions as well, thus reducing turbulent mixing and possibly contributing to the longer flames near the walls. Some suggestion of longer flames near the walls may also be found in the simulations of “conventional” coaxial injectors of Urbano et al. (Citation2017), for example, in of that reference. However, it is possible that the effect was minimized by the infinitely fast chemistry assumed by Urbano et al. (Citation2017, Citation2016), compared to the finite rate chemistry used in Harvazinski et al. (Citation2019) and Pant and Wang (Citation2019). Longer flames in the outer elements stand in contrast to the shorter outer element flames observed by Hakim et al. (Citation2015) and Rey et al. (Citation2004). The difference could possibly be due to the lack of closely bound walls in the latter studies, but it seems likely that other differences in the experimental configurations could have played a role as well. Such differences could include the shape of the combustion chamber, which leads to differences in the mean flow and to differences in the acoustic mode shapes.
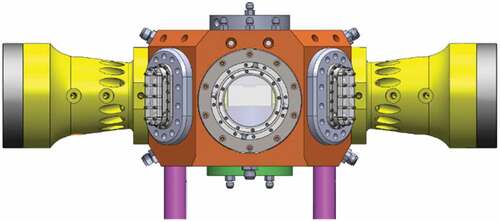
Figure 1. Assembly drawing of the combustion chamber.
The Purdue experiments were in many ways similar to experiments that were conducted at a larger scale in the 1960s, but with less sophisticated diagnostics in the 1960s studies (Lawhead Citation1962; Levine Citation1965). The linear arrays in those studies were large sized to correspond to diametrical slices of full-scale engines. The flat sides of the linear chambers were composed of panes of transparent Lucite for strength, cladded by Pyrex for thermal protection. The average chamber pressures were fairly low, less than 300 psia (about 2 MPa). Various injector types using various propellant combinations were studied, and the experiment included provisions for examining the effect of baffles and the effect of bombing to test the response to impulses. A wide range of stability observations were reported, many of which were confirmed in separate experiments and models by many of the other researchers reviewed here. These observations include sinuous shapes of individual flames, shortened flame lengths under instability, and enhanced optical emission behind the waves, suggesting enhanced heat release.
Sinuous shapes from individual injectors, shortening, and enhanced optical emission behind waves were also observed in another early experiment by Heidmann (Citation1965, Citation1965b) and Heidmann and Groeneweg (Citation1969), which created traveling rotating instabilities in a flat, circular “pancake” combustor. Oxygen was injected radially inward from an array of LOX jets arranged around the periphery of the pancake, the circular equivalent of a rectilinear array. The environment was diffuse hydrogen. Combustion gases exited from the center of the pancake on one flat side, while the other flat side of the pancake was equipped with optical windows. Most of the reported results concerned the isolated response of individual LOX sprays, but one film “Film C-226” is available that shows the ensemble combustion behavior of the entire circular peripheral array. Many of the same general features of traveling wave interactions discussed above can be observed. Sliphorst et al. (Citation2011) later constructed a similar experiment, but only studied the effects of external acoustic forcing on a single LOX/methane spray.
Finally, prior to the current study, Roa and Talley (Citation2019) and Roa and Talley (Citation2021) studied the behavior of a single coaxial LOX/GH2 turbulent flame, with and without transverse acoustics. They discovered a “wave amplification mechanism,” which contributed to a significant portion of the dynamic large-scale motion of the flame with or without acoustics. The wave amplification mechanism may be described briefly to be a result of quasi-periodic “flapping” of the flame between the gaseous hydrogen and the liquid oxygen, driven by oscillations in the hydrogen gas jet. The oscillations can either be driven naturally in the absence of acoustics by mechanisms such as a Kelvin-Helmholtz instability, or they can be triggered by other mechanisms such as acoustic waves. During those periods when the oscillations drive the flame to be closer to the LOX core, the temporary augmentation in heating causes locally enhanced vaporization of the LOX, resulting in the formation depression waves or “troughs” in the LOX core that subsequently propagate downstream. When this occurs, the additional available oxygen reacts with the hydrogen to cause corresponding “puffs” of combustion products, which also subsequently propagate downstream. The periodicity also shows up as identifiable waves in the flame that are a third feature that propagates downstream. The amplification process consists of the initially small motions driving the lateral flame motion translating into larger-scale motions driven by the gas expansion caused by both LOX vaporization and combustion. See (Roa and Talley Citation2019, Citation2021) for more details.
More recently in a predecessor study to this one, Roa and Talley (Citation2022) removed the acoustic driving but increased the number of injectors to a linear array of three. They not only found the wave amplification mechanism to still be present but also characterized other features of the ensemble flames and of the individual flames within the ensemble, as compared to a single flame by itself. Notably, they found the ensemble of flames to be significantly longer than the single flame. The outer shear layers of the outer elements were found to expand at much the same angle as the single flames, but the expansion of the central flame was more constrained. Considerable evidence of significant gas phase turbulence interactions was found, and this was found to slow down the propagation velocities of the flame waves caused by the wave amplification mechanism. Natural frequencies were found to emerge in the ensemble of flames, which were not present in the single flame, at otherwise the same flow conditions. Finally, there was evidence that the wave amplification mechanisms of the individual flames were “locking in” nearly out of phase among neighboring flames, leading to an out-of-phase “nesting” feature whereby contractions of waves in one flame naturally accommodated bulges in the waves of the neighboring flame.
In this paper, the same linear ensemble experiment is revisited, but this time in the presence of transverse acoustic waves. Acoustic drivers that were present but dormant in the previous study were activated for the present study. All flow conditions were reproduced as identically as possible except for the activation of the acoustic drivers. It is found that the wave amplification mechanism remains present but in yet another modified form compared to the single elements and the non-driven linear array. The experiment is described next.
Experimental setup
The experiment is the same experiment described in (Roa and Talley Citation2022), except for the activation of acoustic drivers that were dormant in the previous study. It is also essentially the same experiment used for single elements in Roa and Talley (Citation2019, Citation2021), except for the change in manifolding required to flow three elements instead of one. The most experimental details are provided in the 2019 paper. For the convenience of the reader, the summary description in the 2022 paper is reproduced in large part here, with modifications and additional details as necessary.
shows an assembly drawing of the experiment. For a size reference, the center round window through which all the visualizations were performed is 101 mm in diameter. shows mainly the outer pressure containment. Located inside the pressure containment is another windowed rectangular channel, which is an acoustic channel that in addition allows optical access and contains all the combustion. The inner channel is illustrated schematically in . It is not designed to contain any pressure, but serves to keep the outer pressure containment and associated pressure seals protected from the hot combustion gases. In addition, it channels the acoustics. The entire assembly is pressurized by a purge flow of room temperature gaseous nitrogen in the outer chamber and does not rely on the combustion to generate the pressure. The inner channel is protected from the outer purge flow by the windowed channel walls, so that the outer purge does not affect velocities in the inner channel. The gaseous combustion products are diluted by the purge gases in the outer chamber as they exit through an opening in the bottom of the inner channel, and then all gases exit the outer chamber through a pressure-metering orifice as only a warm gas.
Figure 2. Schematic of the inner channel inside the pressure containment.
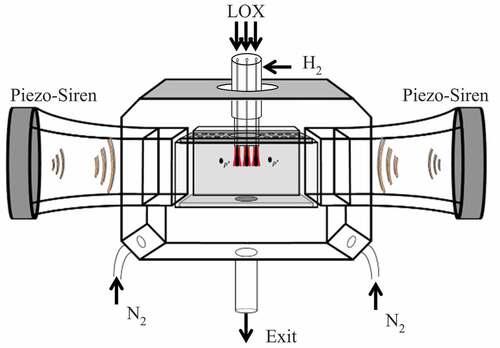
As mentioned, the inner channel is also designed to propagate acoustic waves. The acoustics are driven by the two round, high amplitude piezo-ceramic sirens especially designed to function at high ambient pressure, located on either end of the channel as shown schematically in . The drivers can be separately phased electronically to create either pressure nodes (PN) or pressure antinodes (PAN) in the center of the channel where the flames are located. Being separately driven, they can also create arbitrary acoustic phases in between these two extremes, but these were not explored here. The acoustic drivers were in fact also in place for the previous non-acoustic study, just not activated.
The acoustic waves from the sirens are first sent through a transition section, which decreases the cross-sectional area and thereby magnifies the intensity, while also accomplishing a round-to-rectangular shape change. The transition is gradual enough to maintain essentially planar acoustic waves through the length of the channel. The length of the acoustic channel was chosen to provide resonant frequencies that are representative of tangential instability in liquid rockets. The feed systems were designed to be off resonant to the frequencies in the chamber and therefore were not acoustically active in this study. This condition mimics practical design considerations in many applications where feed system resonances are usually deliberately avoided whenever possible. Because of this arrangement, the outer elements of the array were far from any lateral walls. Also indicated in are two black dots on the inner channel representing high-speed pressure transducers mounted on the far wall (away from the recording optics) of the inner channel, installed to monitor the acoustics on either side of the linear array in the channel. A third pressure transducer, not shown in and equidistant from the other two, monitored the pressure near the center of the array.
The arrangement of the injector exits in the center upper wall of the inner channel are shown in . shows the arrangement previously used for the single injector experiments (Roa and Talley Citation2019, Citation2021). shows the arrangement of the linear array of three injectors used in (Roa and Talley Citation2022) and in the present study. The black circles are 0.5 mm orifices for a faceplate bleed intended to suppress recirculation in the vicinity of the injectors. The different upstream manifolding required a somewhat different arrangement of the faceplate bleed orifices. Also shown as horizontal bars are slots next to the channel windows to provide film cooling for the windows. The faceplate bleed velocity was regulated to 0.08 m/s, and the window purge velocity was 5.7 m/s.
Figure 3. The injector faceplate for: (a) the single element and (b) the multi-element. The injectors are in green (LOX) and red (GH2). The gray is the solid injector support. The black external to the gray is GN2 for recirculation suppression (solid circles) and window cooling (linear slots).
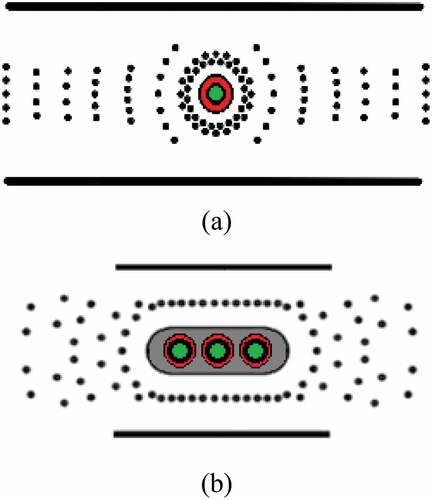
The dimensions of each of the three individual injector elements are as follows: the inner LOX diameter was 1.58 mm, the LOX post-lip thickness was 0.38 mm, and the annular hydrogen outer diameter was 2.82 mm. The inter-element spacing of the three-element array was 2.8 LOX diameters, center to center, which is representative of flight engines. Long straight sections of manifolding upstream of the exits exceeded 100 hydraulic diameters in length and ensured that fully developed channel turbulence existed as an initial condition for all injector flows. These are the same dimensions used in the non-acoustic linear study, and the individual element dimensions are very close to within the tolerances of the manufacturing methods used to the dimensions used in the single-element studies. See Roa and Talley (Citation2022).
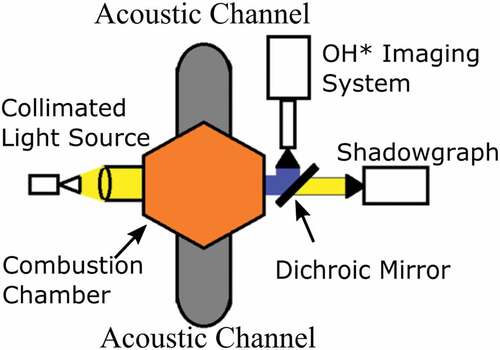
The diagnostics used is illustrated in . Two synchronized high-speed cameras simultaneously captured backlit shadowgraph images and OH* chemiluminescence images. The framing rate was 50 kHz. The shadowgraph camera imaged the first 8 LOX diameters from the injector exit, while the OH* chemiluminescence imaged the first 14 LOX diameters. No efforts were made to calibrate the quantitative response of the OH* chemiluminescence intensity before or between experimental runs. In fact, the settings were sometimes adjusted between runs to ensure the signal was adequate and without saturation. Accordingly, no conclusions should be attempted from apparent changes in intensity in the images below that would have occurred between experimental runs. This caution would apply to all comparisons between the intensities of the present paper and those in the previous non-acoustic paper and to all comparisons within the present paper between different values of the momentum flux ratio J. At each J, however, changes in the acoustic conditions, namely, PN or PAN and strong or weak amplitude (see below), involved changes only in the electronics of the acoustic sirens, while the OH* chemiluminescence settings remained fixed, rapidly enough that there was little opportunity for drift. Therefore, considerations of relative intensity changes within the same values of J are more reliable.
Figure 4. High speed, simultaneous shadowgraph and OH* imaging system.
The chamber pressure of the experiments averaged around 3.5 MPa, which is subcritical for pure oxygen. The outer-to-inner, or gas-to-liquid, momentum flux ratio was selected as the primary flow parameter to be varied. The flow conditions are given in . Careful consideration was given to match the same flow conditions used for the previous non-acoustic study as closely as possible, but this could not be achieved exactly. Accordingly, most of the cells in have two entries. The first entry in these cells provides values for the present acoustic study. The second entry provides corresponding values used in the previous non-acoustic study. To facilitate discussions of the comparisons between cases, the first column in uses a “J-level” notation Jx, defined as follows. A J-level of J1 refers to the lowest value of J between the two studies, which is almost but not exactly the same. J2 refers to the next lowest value J, which is almost but not exactly the same and so on to J5 for the highest value of J investigated. For example, J3 in this notation refers to the third lowest J condition where J = 0.87 in the acoustic study and J = 0.94 in the non-acoustic study. It will be clear from the context in the discussions below whether the text refers to the J-level or the numerical value of J.
Table 1. Flow conditions. First/second cell entries: acoustic (this paper)/non-acoustic (previous paper) values.
The acoustic conditions are given in . The first column shows that the J-level is as defined in the previous paragraph. The second column gives the corresponding values of J. Only one entry is given for the values of J in the second column because pertains only to the acoustic study. The values entered for J in the second column of are the same values given in the first entries for J in the second column of . The entries in the rest of the columns in once again have dual values, but they have a different meaning than in . For each flow condition or J-level in the acoustic study, two different pressure amplitudes were investigated, referred to as “weak” and “strong” herein. The dual entries correspond to the weak/strong amplitudes in that order. The acoustic pressure amplitudes in the third column of were measured using the transducers mounted in the inner channel indicated in . The acoustic velocity magnitudes in the fourth column were estimated from the measured pressure amplitudes from the linear acoustics formula, where ρ is the average density and c is the average speed of sound of nitrogen. A frequency centering around 2650 Hz was targeted for all conditions, which provided the highest resonance amplitude in the chamber. The fifth column in records the actual frequencies measured for each condition. The deviations from the target frequency are shown to be very small. Finally, for each flow condition and each amplitude, two different acoustic phases were investigated, namely, a pressure node (PN) and a pressure anti-node (PAN). The entries in were held constant when switching between the acoustic phases, so separate entries are not necessary in . All in all, for each J-level, four different acoustic conditions were investigated, namely a weak PAN, a strong PAN, a weak PN, and a strong PN. The experimental procedure was to first set the flow condition and then electronically switch the acoustic drivers to produce each of the four acoustic conditions, while the flow remained uninterrupted. Once the flow condition was established, the entire procedure required only a few seconds to cycle through all four acoustic settings. This was fast enough to eliminate the possibility of experimental drift in the flow conditions or in any of the instrumentation, including the optical instrumentation, during the measurements.
Table 2. Acoustic conditions (this paper). First/second cell entries: weak/strong acoustic amplitudes.
From , it may be noted that the maximum acoustic amplitude achieved in this experiment was about 0.2% of the mean chamber pressure. This is considerably smaller than the amplitudes achieved in many of the other studies reviewed above (e.g. 20% in Mery et al. (Citation2013) to 100% in Gejji et al. (Citation2020). Many of those studies endeavored to achieve amplitudes comparable to fully developed instabilities, that is, comparable to their limit cycles. The present amplitude is more comparable to an intermediate amplitude reached during a transient stage, which is growing to a limit cycle. It is also comparable to the small but finite amplitudes assumed in many weakly nonlinear models. It should also be noted that the amplitudes reached in the present study are only about half the amplitudes achieved in the previous single-element acoustics study by Roa and Talley (Citation2021). This was evidently due to increased losses introduced in converting from one element to three. As a result, caution is necessary to consider the possible influence of amplitude in comparing the results between the various studies, including the comparison of this study with the previous single-element study.
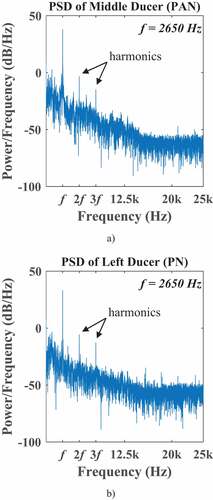
shows examples of the differential pressure traces recorded by the three pressure transducers mounted on the inner chamber wall for strong PAN and PN forcing. The transducers were mounted only a fraction of a wavelength apart. Nevertheless, shows that the amplitude of the center pressure trace for the PAN condition was larger than either of the two side traces, as expected for a PAN, but the side traces were not of exactly equal amplitude. For the PN condition, the amplitude of the center trace in was much smaller than either of the side traces, as expected, but not zero, as would be expected for an ideal PN. Moreover, the side traces are approximately out of phase but not exactly. shows power spectral densities from the center and the left transducers and indicates that the acoustics were not only pure tones but also exhibited harmonics. The conclusion from is that the experimental acoustics were close to but only approximately PAN and PN. The difference from the ideal can be attributed to experimental imperfections and nonlinearities. These approximations should be understood in subsequent references to PAN and PN throughout the rest of this paper.
Figure 5. Differential pressure measurements of the three window pressure transducers for strong forcing: (a) PAN and (b) PN.
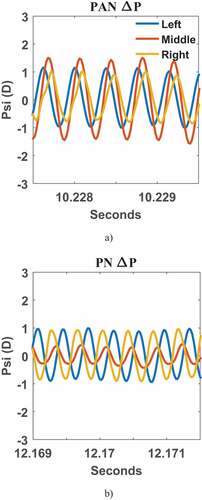
Figure 6. PSDs of the differential pressure signal at the forcing frequency (a) PAN and (b) PN.
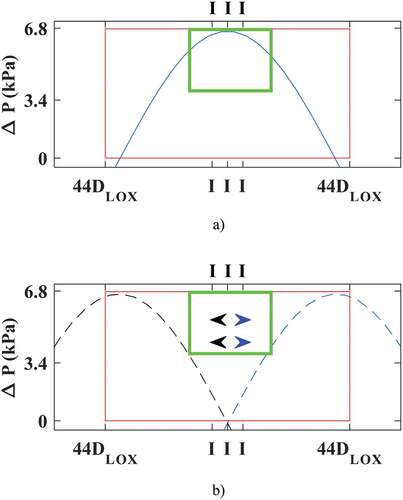
shows a representation of the injector locations relative to the acoustic wavelength. The curves show ideal pressure traces, solid for a PAN and dashed for a PN. The red box illustrates the window in the inner channel, and the green box illustrates the lateral extents of the field of views of the shadowgraph cameras. The centers of the individual injectors are represented by the capital letters “I.” The blue and black arrows indicated the presence of the velocity fluctuations at the injectors for a PN. The acoustic quarter wavelength was approximately 44 LOX diameters and was therefore long compared to the lateral dimension of the linear array and that of any of the individual injectors. Accordingly, all three injectors are approximated here to experience the same amplitude acoustic pressure and velocity fluctuations. This approximation might have been less well justified in some of the other studies of linear arrays reviewed above. For example, Hakim et al. (Citation2015) indicates that the outer elements of the five-element array they studied were located far enough away from the center element to be located at an acoustic intensity anti-node (maximum of p’v’), compared to the PN at the center. This may partially explain why the outer elements in that study were observed to converge slightly toward the center on average under acoustic forcing. Acoustic streaming at intensity antinodes is known to produce average flows directed toward PNs.
Figure 7. Example of a standing wave reconstructed from the pressure measurements. (a) pressure antinode (velocity node). (b) pressure node (velocity anti-node).
Results
Imaging results
Time-averaged visualizations of the PAN and PN results for strong forcing are shown in , and instantaneous realizations from the time averages are shown in . Only images for strong forcing will be shown in this section. Other results in subsequent sections will also include weak forcing. The reason for only presenting strong forcing in this section is that the trends evident for weak forcing are in many respects similar to the trends evident for strong forcing, except that the magnitudes are smaller. Exceptions will be noted as appropriate. However, high-speed videos for both strong and weak forcing are uploaded in the supplemental material (https://doi.org/10.6084/m9.figshare.19404569)
Figure 8. Full temporal averages of the multi-element shadowgraph and OH* emissions under strong PAN (left columns) and strong PN (right columns) forcing.
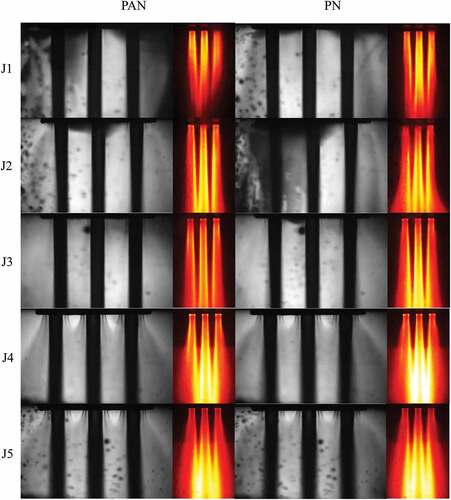
Figure 9. Instantaneous images of the multi-element shadowgraph and OH* emissions under strong PAN (left columns) and strong PN (right columns) forcing.
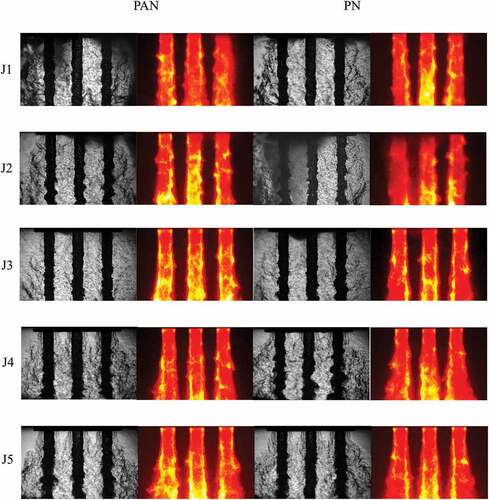
The left two columns in depict the PAN results, while the right two columns depict the PN results, both shown as a function of J-level. Within each pair of two columns, the left column shows shadowgraphs and the right column shows OH* chemiluminescence. As noted above in Section 3, the OH* intensities should not be compared between J-levels. In addition, a feature of the OH* images found in for J4 and J5 is a faint horizontal demarcation of relatively higher intensity that occurs about 1/3 of the way down these images. This is a result of having had to replace an initially larger window in the back of the inner chamber with a smaller window due to excessive failures of the larger window that occurred for J-levels larger than J3. The additional background glow and overall intensity for cases J4 and J5 in the lower part of the images are due to additional reflections from the nontransparent wall that replaced the lower part of the back window. The size of the smaller window was chosen to correspond to the already more restricted axial field-of-view of the shadowgraphs compared to OH*. and subsequent figures chop the OH* field of view to the same more limited axial extent that is for the most part not affected by the additional glow of reflections from the lower wall. Once again, absolute OH* intensity levels are to be compared only with a certain amount of caution.
The acoustically driven results in share many features with the non-acoustic results reported in Roa and Talley (Citation2022) and in many respects may be regarded as perturbations of the non-acoustic fields. This was to be expected for small enough acoustic amplitudes, for which the response would become linear. The present results specifically document the ways in which it is true for the comparatively small but finite acoustic amplitudes used here. Further evidence for linearity might be implied from the apparently similar motions found for strong and weak forcing, except for the amplitudes.
Relevant aspects of the previous non-acoustic results that are retained in the present acoustic results are briefly listed as follows. The reader may consult the previous and earlier works (Roa and Talley Citation2019, Citation2021, Citation2022) for further elaboration. The relevant aspects are as follows: The interpretation of all images is confounded in part by the presence of various amounts of window fogging due to steam condensation that could not be fully controlled. All three flames are individually anchored at their exits under all conditions. Four relatively straight, distinct, and vertical shadows initially show the presence of the flame (the inner two) and the presence of the shear layer between the outer hydrogen and the ambient (the outer two); the distinct shadows are subsequently disintegrated further downstream by the turbulence. The axial length of the three flames is longer than that of the single flame. Acoustic velocity fluctuations are readily apparent in the real-time progression of shadowgraph sequences of turbulent structures that cannot be distinguished in the still frames. No direct interaction between the liquid phases of the jets is evident; all interactions occur through the gas phase as an intermediate. The outer gas phase shear layers expand at a larger angle than the inner layers. The inner layers merge within 1–2 LOX diameters. Although not measured, it is reasonable to speculate that the inter-element turbulence probably exhibits important differences from the turbulence in the outer layers that are not affected by the presence of other layers. The interelement and outer turbulence are affected by large-scale structures produced by the wave amplification mechanism, which as indicated above is a response to the fluctuating proximity of the flame to the LOX core. The effect has been observed previously in non-acoustic and acoustic single-element flames and in non-acoustic three element flames. It is also found in the present paper for acoustic three element flames. In all cases, the wave amplification mechanism is modified according to the particular conditions. The wave amplification mechanism also produces smaller waves in the LOX core and discrete waves that form in the OH* emissions whose propagation velocities can be measured. All the results from this experiment are affected by the fact that the gases converge in the mean farther downstream in order to exit through the single hole centered in the bottom of the inner channel. Upstream, where the results in this series are focused, this tendency can be counterbalanced by the tendency of the turbulent combustion shear layers to initially expand, especially for shear layers having large momentum fluxes compared to the momentum fluxes of the converging gases.
A further trend not discussed previously but that was present there and in the current acoustic results is the apparent tendency of the center flame to emit more OH* than the outer flames. This trend is observed separately at all J-levels and does not depend on comparisons of intensity between J-levels. The trend is also consistently observed even in the presence of enhanced reflections from a back wall, when present. Such an effect has been observed by others (Hardi et al. Citation2014b, Citation2014; Hardi, Oschwald, Dally Citation2011; Rey et al. Citation2004) and has been attributed to collisions between vortices from the separate streams, which, in turn, produce relatively sudden increases in mixing and combustion. The same mechanism has also been postulated to drive traveling waves (Shipley et al. Citation2014).
In what follows, it will facilitate the discussion to preview a conclusion now for which the evidence will be developed later, namely, that the magnitude of the response of the flames to acoustics appears to be greater when the flames are subjected to a pressure node (PN) than when they are subjected to a pressure antinode (PAN).
The main evidence for the presence of acoustics that can be discerned from the time-averaged results in is that the shadowgraphs show a larger outer spreading rate in the gas phase compared to the non-acoustic results. The difference is not large. A similar time average for single elements (Roa and Talley Citation2021) also showed a larger gas phase spreading rate for single elements with acoustics. In , the increase in spreading rate is present at all J-levels, but the quality of the optics is such that it is seen the most clearly at the larger J-levels. At these larger J-levels, an abrupt change in spreading rate occurs at approximately 1–2 LOX diameters for both PN and PAN. However, the change is more abrupt for the PN, resulting in a curved shape of the outer envelope compared with a more linear shape of the outer envelope for the PAN. In addition, the interelement merging distance between adjacent shear layers is shorter for the PN (later it will be possible to discern more from the oscillations of the merging distance under acoustics). It is also possible to observe somewhat more intense OH* emissions from the center element, as mentioned above. The effect seems qualitatively larger for the PN than for the PAN (recall it is permissible to compare OH* intensities between PAN and PN at the same J-level). All of these trends may also be observed for weak acoustic forcing as well, but the trends are either weaker than above or not clearly different than without acoustics. These observations form one reason for concluding that the response of the PN flame is larger than that of the PAN flame.
More evidence for the acoustics may be found in the instantaneous realizations presented in . Waves in the LOX core can now be discerned, in addition to large-scale coherent structures in the gas phase. Both are the consequence of the interactions of the acoustics with the wave amplification mechanism. Discrete waves can now be seen in the OH* images. Additional wave behavior can be obtained from the time progressions in the supplemental materials. The generation and propagation of all these waves downstream are clearly evident in the time progressions, as well as the acoustic velocity fluctuations superimposed onto the gas phase turbulence structures. The centerline of the LOX core itself does not fluctuate. The propagation of the discrete OH* waves axially downstream will be discussed in more detail in section 4c. In addition, transverse, side-to-side fluctuations of the OH* waves around the circumference of the jets may also be observed in the time progressions (supplemental materials) as the acoustic waves wash around the jets. The transverse or circumferential fluctuations are roughly in phase across all three jets, as will become clearer in . The appearance has motivated the authors to name these fluctuations “wave dancing.” Wave dancing is a product of transverse gas phase velocity fluctuations. No such fluctuations should occur for a PAN under ideal linear acoustics because transverse velocity motions should be absent, but in fact a small amount of wave dancing can be observed here for PANs as well, because the real experimental conditions are not fully ideal. However, the effect is considerably smaller than for PNs. All of the above trends may be observed for weak acoustics as well, but they are not as pronounced.
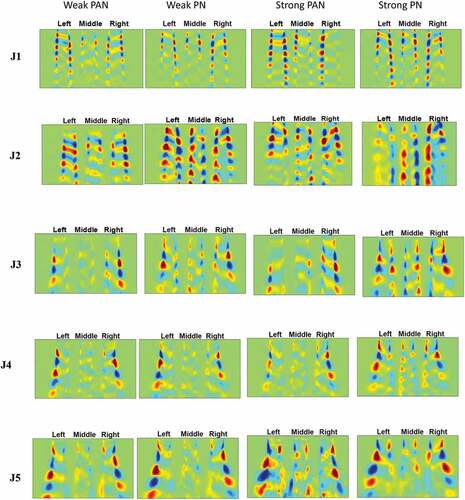
Figure 10. Phase-averaged images of the multi-element shadowgraph and OH* emissions under strong PAN (left columns) and PN (right columns) forcing. The white lines indicate the downward, outward slanting discussed in the text.
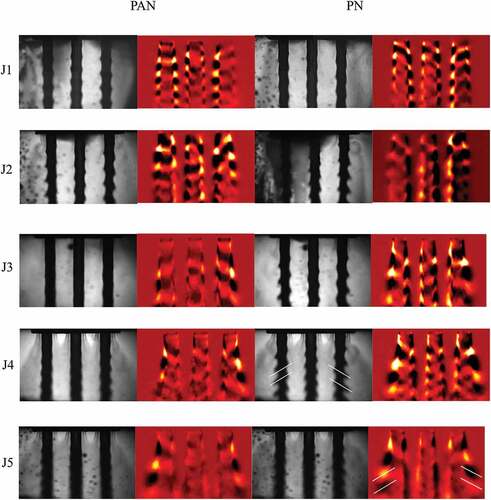
The fact that the flow is forced at a discrete frequency offers the additional opportunity to further separate the acoustics from the turbulence fluctuations by phase averaging the results at the forcing frequency. The results are presented for strong forcing in . The means of the OH* images were first subtracted before constructing the phase averages, and the results were then false colored. The supplemental materials in addition show pseudo-time progressions of the phase averages as they evolve when the phase is incrementally advanced. Unfortunately, the optical quality of the shadowgraphs is not consistent and more features can be visualized for some cases than for others. Nevertheless, several additional features become apparent, as discussed next.
The first feature is that the wave amplification mechanism, as driven by the acoustics, is clearly visible in several shadowgraphs, for example, J2 and J4 for the PAN and most of the shadowgraphs for PN. The interactions for each jet individually are very similar to the interactions observed in the previous study of single jets under acoustically induced wave amplification. However, it will be further necessary below to also consider how the wave amplification mechanism affects the flames as an ensemble of three. The fact that the wave amplification mechanism can be visualized in more cases for PN than for PAN reinforces the notion that the PN response is larger than the PAN response. The notion is further reinforced by observing that nearly all the wave structures visible in are larger for PN than for PAN, despite both acoustic phases having the same amplitude. A similar conclusion was drawn for single elements under acoustic forcing as well, where, in addition, it could be observed that the wave structures persisted farther downstream for PN than for PAN. However, because the multielement flames here are longer than the single-element flames and extend beyond the field of view of the cameras, such an observation is not possible here.
The phase-averaged shadowgraphs and the OH* continue to show a spreading of each jet flame individually and of the jet flames as an ensemble as the downstream distance increases. Another feature clearly visible in both the shadowgraphs and the OH*, particularly for PN but also to a reduced extent for PAN, is the downward and outward slanting of the wave structures that occurs farther downstream that is more pronounced for the outer element regions than for the interelement regions. The effect is more pronounced at larger J. The pronounced downward outward inner-to-outer slanting is indicated by the white lines in . The elongation of the outer structures is particularly evident in the OH* phase averages, where it is also apparent from the time progressions that the outer structures propagate downstream more rapidly than the inner structures, evidently due to larger bulk velocities at the outer locations, particularly at large J. Further evidence of apparently larger outer bulk velocities may be found in the clearly shorter wavelengths of the inner OH* structures. A mechanism was postulated in the previous non-acoustic study of enhanced turbulence serving to mix out the faster velocity layers in the interelement regions, producing slower overall bulk velocities. The effect would be absent in the outer regions where faster velocity layers originating from the faster annular hydrogen can be sustained for longer.
It may also be observed that the sizes of the lobes for the outer layers are greater than those for the inner layers, particularly at larger J. This is a result of the more extensive velocity fluctuations in the outer layers. The more extensive velocity fluctuations in the outer layers can also be noticed from an examination of the instantaneous time progressions corresponding to in the supplemental materials.
Finally, an examination of the pseudo-time sequenced OH* phase averages in the supplemental materials reveals a coordinated side-to-side oscillation in intensity between the entire sides of each jet, simultaneously for all three jets. The intensity oscillations on the entire right side of all three jets are out of phase with the intensity oscillations on the entire left sides of all three jets. This is the phase-averaged signature of the OH* wave dancing phenomena identified above. It is remarkable how coherent the wave dancing behavior seems to become once the random turbulence effects are filtered out by the acoustic phase averaging.
Nesting and phasing
Like previous papers, the wave amplification mechanism was once again found above to be active for the present acoustically driven multielement flames. The manifestation for each individual flame was found to be very similar to the manifestation in acoustically driven single flames. Still to be discussed is how the wave amplification mechanism affects the array of flames as an ensemble. Evidence was also presented, with more to follow below, indicating that the response of the flames to PN acoustics was larger than that for PAN acoustics. In other words, the preferred response of the flames was to PN acoustics. These topics are considered more fully in this section.
In the previous study, Roa and Talley (Citation2022) remarked on the interactions between the quasi-periodic wave amplification processes among the three flames, for flames that were not subjected to acoustics. They found the upstream oscillations between neighboring shear layers of adjacent flames to naturally organize themselves into a mostly out-of-phase relationship, resulting in a “nesting” relationship among the large-scale gas structures produced by the wave amplification mechanism. The nesting persisted downstream for about one wavelength until it was dissipated by the background turbulence. The out-of-phase self-organization occurred at all momentum flux ratios J. The implication for the wave amplification mechanism was that the quasi-periodicity among the flames must also be self-organized into mostly out-of-phase relationships between adjacent flames. Evidence for this was found in the flow visualizations shown in that paper.
Various possible kinds of nesting behavior that could occur among large-scale structures are illustrated in . The nesting observed previously without acoustics is illustrated schematically in . It is of an out-of-phase, varicose kind. Another possible kind of nesting would be in-phase sinuous nesting, as illustrated in . Sinuous nesting could be driven, for instance, by in-phase simultaneous transverse velocity fluctuations such as would occur if all three flames were located at a transverse PN. Evidence of exactly this for the present experiment will be given momentarily.
Figure 11. Nesting modes. (a) varicose (out-of-phase). (b) sinuous (in-phase), (c) varicose (in-phase, destructive). Not illustrated, except for the collisional breakdown in (c), is the eventual downstream dissipation of all modes by the background turbulence.
A remarkable feature of both out-of-phase varicose and in-phase sinuous nesting would be the minimization of collisions between the large-scale structures of adjacent flames. The relative lack of collisions would avoid flow losses that such collisions would produce and delay the eventual dissipation of the modes downstream by the background turbulence (not illustrated in ). In fact, while the mechanism of self-organization producing the out-of-phase varicose nesting observed for the non-acoustic flames has not been identified, it seems possible that it could involve a minimal loss principle.
Whereas the in-phase, antisymmetric velocity fluctuations at a PN would tend to promote in-phase sinuous nesting, the in-phase, symmetric pressure fluctuations at a PAN would tend to produce varicose nesting instead. However, out-of-phase varicose modes would tend to be suppressed and the forcing would tend to promote in-phase modes. Such in-phase varicose modes would be destructive, resulting in collisional breakdown of the large-scale structures, as illustrated schematically in . The enhanced resulting flow losses may be one mechanism promoting a greater response for PNs than for PANs. It is also possible that the greater relative response for PNs is that the transverse velocity fluctuations are superimposed upon a zero average transverse velocity, which could produce a greater effect, while PAN pressure fluctuations cause mass flow fluctuations, which are but a fraction of the average mass flows. It should also be noted that the collisions involved here would be mostly in the combustion product gases, not between unreacted mixtures. Thus, a mechanism for promoting enhanced mixing and combustion and potentially stronger feedback to acoustic waves would be largely absent in this case.
The quality of the imaging evidence presented thus far does not clearly confirm the presence or absence of nesting in these acoustically driven flames. However, indirect evidence may be found in the oscillations of the U-shaped upstream stagnant regions between the flames before the shear layers merge. Careful observations of the pseudo-time progressions of the phase-averaged shadowgraphs in the supplemental materials corresponding to show that the oscillations of the apex of the U-shaped regions are mainly side-to-side for the PN, but axially up and down for a PAN. Such motions suggest the driving of sinuous nesting for a PN and the driving of in-phase varicose modes for a PAN that subsequently collide and break down. It may also be noted that similar quality instantaneous shadowgraphs without acoustics revealed the frequent appearance of out-of-phase varicose nesting, while no varicose nesting of any kind could be found with acoustics.
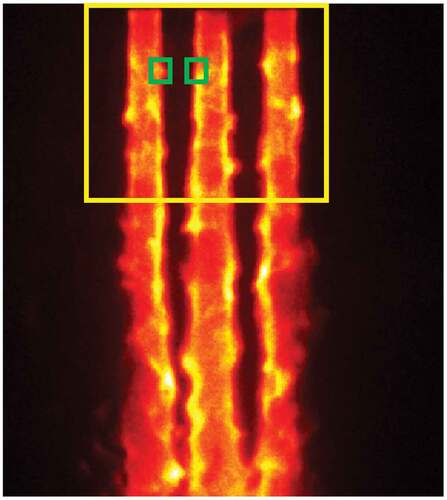
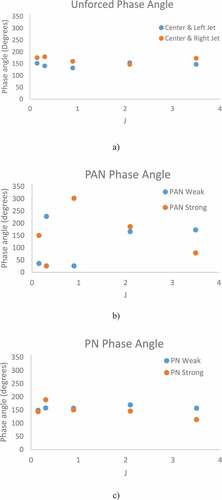
To further explore phase relationships, cross-power spectral densities (CPSD) were constructed for the OH* images between two adjacent shear layers as illustrated in . The total OH* intensities were integrated within the two smaller green boxes shown and then cross-correlated. The axial location of the boxes shows separate flames in , but they are located downstream of where the shear layers are seen to merge in the shadowgraphs. One integration region was on the right side of the left flame, while the other was on the left side of the center flame. Right-center results were also analyzed, and the results were found to be very nearly the same. This further confirmed an average left-right symmetry of the ensemble flame also observable in the images above. CPSDs provide both spectral and phase information, but phase information is of primary interest here. The spectral information was much the same as that of the Dynamic Mode Decomposition (DMD) spectra to be presented in the next section. CPSDs produce phases corresponding to all frequencies in the spectra, but here the only phases compared that correspond to the natural frequencies of the non-acoustic flames from the previous non-acoustic investigation and to the forcing frequencies of the present investigation are investigated here.
Figure 12. Interrogation windows for CPSD (small green boxes) and DMD (large yellow box).
The results are shown in , where positive phase angles indicate that the center flame leads in time. reproduces phase angles from the previous non-acoustic investigation and indicates a nearly out-of-phase relationship averaging around 160 degrees at all Js. Also shown in are results from both left-center and right-center, demonstrating the left-right symmetry. The results in are consistent with out-of-phase varicose nesting. shows results for both a strong and a weak PN, showing a similar nearly out-of-phase relationship averaging around 160 degrees, again roughly independent of J. Given that this is for a PN, these results are consistent with in-phase sinuous nesting. for PAN forcing, on the other hand, shows no clear trend in phase. These results are consistent with collisional breakdown between destructive in-phase varicose modes. Similar results were found from CPSDs of the shadowgraphs, not shown, where phase delays of around 120–150 degrees were found at all J for the non-acoustic and PN flames and no clear trend for the PAN flames.
Figure 13. Phases from a CPSD analysis of the OH* images between the left and center flames at the natural frequencies (a), or at the forcing frequencies (b,c), as a function of J. A positive phase angle indicates the center flame leads in time: (a) unforced, (b) PAN, and (c) PN.
Dynamic mode decomposition (DMD)
A Dynamic Mode Decomposition (DMD, Schmid Citation2010) was performed for all three flames within the field of view enclosed by the single larger yellow box in . The resulting spectra are shown in for both strong and weak PNs and PANs. The forcing frequencies are indicated on the abscissas. Strong spikes occur at the forcing frequencies, as expected, along with higher harmonics. The response is clearly larger for strong forcing than for weak forcing, as evidenced by the larger amplitude spikes at the forcing frequencies and the generally larger number of harmonics. Within a forcing strength, whether strong or weak, the amplitude of the spikes and the number of harmonics indicate a generally stronger response for PNs than for PANs. In addition to the spikes at the forcing frequencies and their harmonics, other broader peaks are also observed. Their frequencies are indicated in the figure. The broader peaks at frequencies higher than the forcing frequencies are near the natural frequencies observed previously without acoustic forcing by Roa and Talley (Citation2022). A comparison is given in for weak PN acoustics. Evidently, the natural frequencies were not entirely suppressed by the weak forcing. With some exceptions, the broader peaks tend to be relatively more pronounced at higher Js. That the broad peaks are relatively more pronounced at larger Js is consistent with relatively more energy contained in the natural modes compared to the forcing. That the peaks tend to be relatively more pronounced for weak forcing than for strong forcing is also consistent with relatively more energy in the natural modes. Also found under some conditions are broader peaks that are at lower frequencies than the driving frequencies. These could represent lower harmonics or difference frequencies. Unfortunately, the numerical values for both possibilities fall within similar ranges in these cases, as can be seen in . Therefore, it is not reliable to attempt to discern which from the numerical values alone. That these lower frequency peaks are similar in broadness to the natural frequencies and dissimilar to the sharp spikes at the driving frequencies and the other harmonics suggests that they may have difference frequencies.
Figure 14. OH* emission DMD spectra as a function of J for the weak PAN and PN (left two columns), and the strong PAN and PN (right two columns).
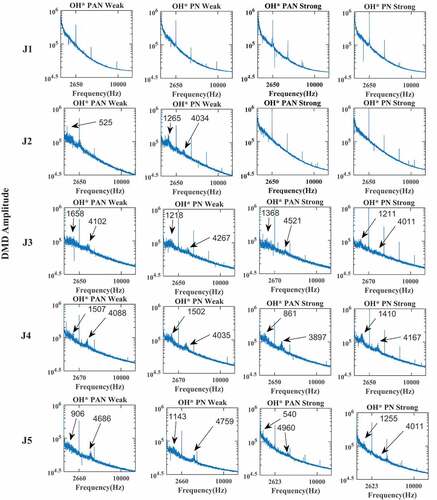
Table 3. Weak PN frequencies.
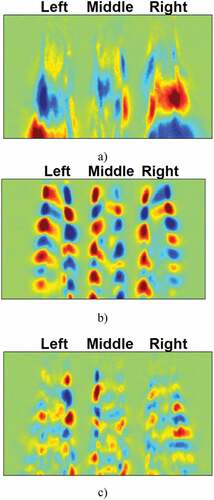
The DMD modes corresponding to the natural modes found without acoustics from (Roa and Talley Citation2022) and under weak PAN and PN acoustics in the present study but at the unforced natural frequencies are compared in . The J1 level is not shown because no peaks were found at that level other than the driving frequency and its harmonics. Despite the many differences in detail, the modes can be considered to be largely comparable, suggesting that the natural modes are indeed to a large extent preserved under the acoustics. This result suggests that acoustic effects are being superimposed on top of the non-acoustic behavior, consistent with linear theory expected to apply at small amplitudes. It is also of interest to compare the DMD modes for the three peak frequencies when all three frequency peaks are present in the spectra, namely low (difference) frequency, driving frequency, and high (natural) frequency. An example is given for a weak PN at the J3 level in . If the low frequency is in fact a difference frequency, then the mode shown in is evidently a difference mode. However, the equivalent false coloring in all three images obscures the relative amplitudes of the three modes. When the amplitudes of the coefficients of the DMD modes are considered, the amplitude of the driven mode is so dominant that subtracting the high frequency natural mode from the driven mode recovers mainly the driven mode, while the low-frequency mode is obscured. That is, the low-frequency mode in has relatively little energy. It is also interesting to note a possible transition in the relative magnitudes of the non-driven frequencies. The lower difference frequency tends to be larger at low J’s, while the higher natural frequencies tend to be larger at larger Js. This is the most clearly seen in for a weak PN.
Figure 15. DMD spatial modes at the natural frequencies for weak forcing.
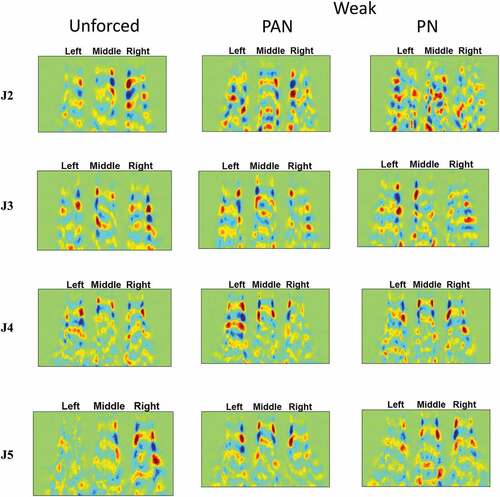
Figure 16. DMD modes at the peak frequencies for J2 at a weak PN. (a) low (difference) frequency mode, (b) driving frequency mode, (c) high (natural) frequency mode.
The DMD modes at the driving frequencies, shown in , tend for the most part to be consistent with the phase averages discussed previously. A trend may be noted that the inner layer mode intensities are often weaker than the outer layer mode intensities. This, along with the relatively larger sizes of the outer layer lobes, is once again a consequence of the relatively larger fluctuations found in the outer layers. This aspect is perhaps somewhat easier to observe in the DMD modes than in the phase averages.
Figure 17. OH* emission DMD spatial modes at the forcing frequencies. The left two columns are for the weak PAN and PN, and the right two columns are for the strong PAN and PN.
Wave trajectories
Returning to the instantaneous images in and their corresponding supplemental materials, it is possible to tag each OH* wave and track its progress axially downstream as a function of time. The method is fully described by (Roa and Talley Citation2019). The resulting individual wave velocities can be plotted as histograms showing the distributions of the velocities, from which average and standard deviations of the velocities can be extracted as a function of J. Histograms of wavelengths can be extracted from the same data. Histograms for the center flame like those in previous publications have been uploaded to the supplemental materials. The average OH* wave velocities of the center flame at each J can then be normalized by the arithmetic average of the bulk propellant velocities according to Equationequation (1)(1)
(1) ,
The results are plotted in . They not just include the results from the present study but also consolidate corresponding plots from all the studies in this series (Roa and Talley Citation2019, Citation2021, Citation2022). The plotted results are for both single- and multielement flows, each for both non-acoustic and acoustic PNs and PANs, weak and strong. The results clearly fall into only two groups according to whether they are single-element flows or multielement flows. The groupings are independent of the acoustics and for large enough J approach only two values of the normalized velocity, namely 0.66 for single elements and for multiple elements. The mean OH* wave velocities at large enough J evidently depend only on the mean or bulk initial propellant velocities and not on the acoustics. The reason that the multielement value is lower than the single-element value was hypothesized by Roa and Talley (Citation2022) to be the result of enhanced inter-element mixing for multiple elements, which produces a more uniform, lower bulk average axial velocity in the inter-element gas phase than would be anticipated from a consideration of the bulk exit velocities without mixing. The single-element results would be less affected by such mixing, such that the gas velocity may be locally higher in the vicinity of the waves. The independence from acoustics indicates that the wave behavior depends mostly on average bulk velocities quantities that are not directly dependent on the acoustics.
Figure 18. Average OH* wave velocities of the center flame, normalized by the mean of the propellant bulk velocities (U*, Equationeq. 1)(1)
(1) . Symbols in the legend are as follows: PAN – pressure antinode, PN – pressure node, UN – unforced. The meanings of the subscripts in the legend are: S – single element, M – multielement (unforced), WM – multielement (weak forcing), SM – multielement (strong forcing).
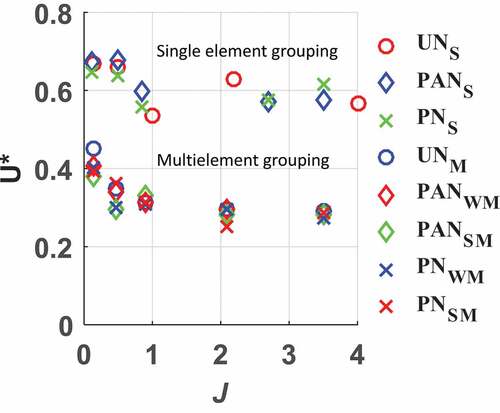
The reason for selecting the center flame for the plots in is that the wave trajectory histrograms were largely the same for all three flames. This is in contrast to the remarks made in connection with the OH* phase averages in , where it was observed that the outer structures propagate downstream more rapidly than the inner structures. The apparent inconsistency is resolved when it is noted that the OH* waves leading to are structures closely coupled to the liquid surfaces, whereas the outer structures found to propagate faster than the inner structures in are located farther away from the liquid surface and more fully into the gas phase, where they respond more readily to the bulk gas velocities.
Discussion
The action of the wave amplification mechanism results from fluctuations in the location of a flame in close proximity to a liquid surface. The fluctuations periodically enhance the local rates of vaporization and combustion, thereby amplifying the initial fluctuations, and produce corresponding larger structures in the combustion products. Theoretically, the mechanism should be active regardless of the cause of the fluctuations in the flame location. In the present configuration, the initial cause of the fluctuations was fluctuations in the unburned annular hydrogen gas, either naturally (for instance, Kelvin-Helmholtz instabilities when acoustics were not present) or triggered (for instance by acoustics). The fluctuations in the hydrogen tended to be more-or-less global around the annulus in this investigation. In other configurations, the source of the fluctuations could conceivably be of a different kind or at a different scale. For example, they could vary more locally around the circumference due to smaller scales of turbulence. In the latter case, the resulting waves could be more chaotic and quickly produce smaller scales due to destructive collisions and interference. It could be argued that the more global nature of fluctuations in this investigation is what allowed the wave amplification mechanism to be identified as a distinct process in the first place.
It is natural therefore to ask what evidence exists for the wave amplification mechanism in studies other than the current series of investigations. The response is that other evidence is mostly speculative so far. The reason is most likely not because the mechanism does not exist, but rather because it may often have been more obscured or simply not specifically noticed. The strongest evidence other than the present evidence to date may be the “thick pockets of burnt gases alternatively created above and below the dense core” of the flames in the five element linear array of LOX/methane flames investigated by Hakim et al. (Citation2015), as noted in Section 2. It is also natural to question whether the mechanism might have been present for the “inverse” coaxial configurations used in the linear arrays at Purdue. It will be recalled that the liquid was swirled around the outer annular wall in those elements, while the center flow was a gas. Both these flows were located inside a recessed “cup” that tended to shield the recessed flow from the transverse flow components in the main chamber. In some of the investigations, the flame was mostly located outside of the cup, in which case the WAM was probably not directly active, although remnants of it might have affected the gas phase dynamics external to the cup. However, for those cases where flames were found inside the cup, especially to the extent they might have existed as “sheets” that can be displaced, all the ingredients for a wave amplification mechanism were present. Wavy flames were indeed observed inside the cup in some of the modeling studies (Harvazinski et al. Citation2019; Pant and Wang Citation2019). However, to attempt to conclude more at this time would be speculative. The ingredients were also present for many of the other studies reviewed in Section 2, for example, Hardi et al. (Citation2014b, Citation2014) and Hardi, Oschwald, Dally (Citation2011), but once again, an attempt to conclude more from the presented evidence so far would be speculative.
It may also be remarked that no evidence of PN flame flattening was observed, as has been observed by others (Hakim et al. Citation2015; Mery et al. Citation2013; Schmitt et al. Citation2017; Urbano et al. Citation2017, Citation2016) for PN flames. Such an effect would have been difficult to detect in the present study using the present perpendicularly oriented optics. It would have appeared only as an apparent narrowing down of the flow soon after the exit. In addition, the flattening was most probably minimal for the small acoustic amplitudes employed. The present lack of confirmation therefore does not contradict the previous observations of others to the contrary.
Given the evidence for inter-element effects throughout this series of studies, a foundational question could be stated, “how does the behavior of a single-element flame differ the center flame of a three element array?” The predominant answer that rises, nuanced by many details, appears to be that the center flame is more constrained than the single-element and the center flame is longer, when walls do not closely bind the outer elements. The outer layers of the outer flames, on the other hand, do behave more like the single-element flame. However, the above answer applies even when the acoustics are absent. A further question can be stated, “do the outer elements somehow shield the center element from the acoustics?” The predominant answer, at least for the configuration studied here, appears to be both yes and no. When the acoustics were present, there was no evidence that the center element was somehow directly shielded or protected from the acoustics far enough upstream where the acoustics interacts with the exit conditions of the flame. The responses of all three elements appeared to be mostly the same. Downstream, however, the interactions with the other elements create different mean conditions (a longer, more constrained center flame) within which the center flame responds differently to the acoustics than the single flame. At least for the lower amplitude acoustics investigated here, the classic modeling view that the acoustic effects are perturbations to a mean flow appears to essentially apply. Consequently, the mean flow of the single element would be an inaccurate baseline from which to project the perturbations caused by acoustics for the center element of three element flames. Furthermore, even if the mean flow of the single flame is the same, additional assumptions would be required to account for nesting and other large-scale effects that are properties of the ensemble.
Given that all the acoustic fields in this study were externally forced, a final question can be stated, “what do the results imply regarding the flames’ capability to drive combustion instabilities?” The typical approach to such a question is to assume that the OH* intensity is related to the heat release and then to calculate a Rayleigh index by cross-correlating the integrated OH* fluctuations with the pressure fluctuations. A positive index integrated over the volume would indicate driving. It was noted above that the flame response at a pressure node tended to be larger than the response at an antinode, but as Urbano et al. (Citation2016) and Urbano et al. (Citation2017) remarked, heat release fluctuations at pressure nodes tend to contribute minimally to the Rayleigh index because pressure fluctuations are zero there or nearly so. The computation of a Rayleigh index for the present experiment is problematic due in part to the limited field of view of the windows that precluded visualization of the entire flames. It is also problematic due to the lack of consistency in quantitative OH* imaging intensities over different experimental runs, as has been noted. Nevertheless, an attempt was made to calculate integrated Rayleigh indices for PANs from the information available, but the results were scattered and inconsistent enough to be deemed not reliable. Hence, no conclusions are attempted here regarding the implications of the present results for driving combustion instabilities.
Summary and conclusions
A linear array of three liquid oxygen/gaseous hydrogen coaxial injectors was subject experimentally to 2620–2750 Hz external acoustic transverse driving at weak and strong amplitudes, at pressure nodes (PN) and pressure antinodes (PAN) and as a function of the momentum flux ratio J. The chamber pressure was 3.2–3.6 MPa, which is subcritical for oxygen. The magnitude of the acoustics was fairly low, about 6.8 kPa for strong forcing, but some nonlinearities were nevertheless present in the form of higher harmonics. The resulting flames were investigated as an ensemble as well as the center and outer flames individually. The study follows a previous study where the same array was investigated without acoustics. This and the previous study were in turn preceded by earlier studies where only a single element of the same kind and dimensions was investigated with and without transverse acoustics. High-speed shadowgraphs and OH* emission imaging were the main diagnostic tools of the investigations. The most significant results were as follows.
Many of the features of the previous non-acoustic study were preserved, except that they were perturbed by the acoustics. In particular, the center flame was longer and more constrained by the outer elements than single-element flame. The less constrained outer flames shared more features with the single elements, such as similar outer spreading rates. A wave amplification mechanism identified in all previous single-element and multi-element studies remained present, whereby small oscillations of the flame location in proximity to the LOX surface are amplified by vaporization and combustion into larger-scale gas phase structures. Without acoustics, the previous study found that the oscillations tend to self-organize into an out-of-phase varicose nesting arrangement, which minimized collisions between the large scales. Under the asymmetric stimulation of PN acoustics, the varicose nesting was replaced by in-phase sinuous nesting, which also minimized collisions. However, symmetric PAN acoustic stimulation suppressed the out-of-phase varicose nesting in favor of in-phase varicose driving. The latter tends to promote collisions, which break the larger scales down into smaller scales, thereby increasing flow losses. The increased losses were postulated to be one of the reasons why the response of the flames tended to be larger for PNs than for PANs.
Cross-power spectral densities (CPSDs) were performed between adjacent shear layers of the center and outer flames, which under PN acoustics confirmed a nearly out-of-phase relationship for all Js consistent with sinuous nesting. On the other hand, the phase relationship for PAN acoustics showed no clear trend in phase. This was interpreted to imply the presence of collisional breakdown.
Dynamic mode decomposition (DMD) spectra under PAN and PN acoustics showed not only the presence of the dominant narrow driving frequencies and their harmonics but also broader peaks corresponding to remnant natural frequencies, as well as lower frequencies that were probably difference frequencies. The broader peaks were more pronounced at large Js and for weak acoustics. The DMD modes corresponding to the natural frequencies with and without acoustics were largely comparable, suggesting that the natural modes were indeed being preserved under the acoustics. This result suggested a superimposition of acoustic effects on top of the non-acoustic behavior.
An analysis of the velocities of discrete OH* waves produced by the wave amplification mechanism produced the same normalized velocities as the waves without acoustics. The same result was found previously for single-element flames, except that the multielement velocities grouped around slower velocities. In both cases, the results, normalized by the average of the initial propellant bulk velocities, became independent of J for large enough J. The normalized velocities approached 0.66 for single-element flames and 0.3 for the multiple flames.
The PN flames were not observed to flatten under transverse acoustics as has been observed in other studies, but this could have been due to the low acoustic amplitudes or the inability of the optical configuration to readily detect such effects or both. A discussion was provided regarding how the behavior of a single-element flame differs from that of the center of three elements and of the three flames as an ensemble, as well as the extent to which the outer elements may shield the center element from the acoustics. The results were not conclusive enough to ascertain whether the behaviors observed would tend to drive or damp closed-loop combustion instabilities.
Acknowledgments
The authors gratefully acknowledge the invaluable technical assistance of Mr. Randy Harvey and Dr. Miguel Plascencia, without whose efforts this experiment would not have been possible.
Disclosure statement
No potential conflict of interest was reported by the author(s).
Correction Statement
This article has been republished with minor changes. These changes do not impact the academic content of the article.
Additional information
Funding
References
- Dranovsky, M. L. 2007. Combustion Instabilities in liquid rocket engines: testing and development practices in Russia. AIAA Prog. Ser. Astronaut. Aeronaut 221:253–282.
- Gejji, R. M., A. Lemcherfi, A. Strelau, W. E, and C. D. Slabaugh 2020. Combustion response of shear coaxial injectors to transverse combustion instabilities. Paper AIAA-202-0424. Presented at 2020 AIAA SciTech Forum, 6-10 January 2020, Orlando, Florida.
- Hakim, L., A. Ruiz, T. Schmitt, M. Boileau, G. Staffelbach, S. Ducruix, B. Cuenot, and S. Candel. 2015. Large eddy simulations of multiple transcritical coaxial flames submitted to a high-frequency transverse acoustic modulation. Proc. Combust. Inst 35:461. doi:10.1016/j.proci.2014.05.142.
- Hardi, J. S., S. K. Beinke, M. Oschwald, and B. B. Dally. 2014b. Coupling of cryogenic oxygen–hydrogen flames to longitudinal and transverse acoustic instabilities. J. Propul. Power 30 (4):991. doi:10.2514/1.B35003.
- Hardi, J. S., H. C. Gomez Martinez, M. Oschwald, and B. B. Dally. 2014. lox jet atomization under transverse acoustic oscillations. J. Propul. Power 30 (2):337. doi:10.2514/1.B34979.
- Hardi, J., M. Oschwald, and B. Dally. 2011. Flame response to acoustic excitation in a rectangular rocket combustor with Lox/H2 propellants. CEAS Space J 2:41. doi:10.1007/s12567-011-0020-z.
- Harvazinski, M. E., R. M. Gejji, D. G. Talley, M. R. Orth, W. E. Anderson, and T. L. Pourpoint 2019. Modeling of Transverse Combustion Instability. Paper AIAA 2019-1732. Presented at 2019 AIAA Scitech Forum, 7-11 January, San Diego, California.
- Heidmann, M. F. 1965. Oscillatory combustion of a liquid-oxygen jet with gaseous hydrogen. NASA TN D-2753.
- Heidmann, M. F. 1965b. Oxygen-jet behavior during combustion instability in a two-dimensional combustor. NASA TN D-2725.
- Heidmann, M. F., and J. F. Groeneweg. 1969. Analysis of the dynamic response of liquid jet atomization to acoustic oscillations. NASA TN D-5339.
- Lawhead, R. B. 1962. Photographic study of combustion processes in liquid propellant rockets. Eighth Symposium (International) Combustion 1140. doi:10.1016/S0082-0784(06)80612-0.
- Levine, R. S. 1965. Experimental status of high frequency liquid rocket combustion instability. Tenth Symposium (International) on Combustion. 1083. doi:10.1016/S0082-0784(65)80248-X.
- Mery, Y., L. Hakim, P. Scouflaire, L. Vingert, S. Ducruix, and S. Candel. 2013. Experimental investigation of cryogenic flame dynamics under transverse acoustic modulations. C. R. Mec 341:100. doi:10.1016/j.crme.2012.10.013.
- Orth, M. R., C. Vodney, T. Liu, W. Z. Hallum, T. Pourpoint, and W. E. Anderson 2018. Measurement of linear growth of self-excited instabilities in an idealized rocket combustor. Paper AIAA 2018-1185. Presented at 2018 AIAA Aerospace Sciences Meeting, 8-12 January 2018, Kissimmee, Florida.
- Pant, T., and H. Wang 2019. Flamelet modeling of transverse thermo-acoustic instability in a multielement combustor. Paper AIAA 2019-1235. Presented at 2019 AIAA Scitech Forum, 7-11 January 2019, San Diego, California.
- Poinsot, T. J., A. C. Trouve, D. P. Veynante, S. M. Candel, and E. J. Esposito. 1987. Vortex-driven acoustically coupled combustion instabilities. J Fluid Mech 177:265. doi:10.1017/S0022112087000958.
- Pomeroy, B. R., W. Lamont, and W. E. Anderson 2009. Subscale tool for determining transverse combustion response. Paper AIAA 2009-5490. Presented at 45th AIAA/ASME/SAE/ASEE Joint Propulsion Conference & Exhibit, 2-5 August 2009. Denver, Colorado.
- Pomeroy, B. R., N. Nugent, and W. E. Anderson 2010. Measuring transverse combustion stability at full scale frequencies in a subscale combustor. Paper AIAA 2010-7146. Presented at 46th AIAA/ASME/SAE/ASEE Joint Propulsion Conference & Exhibit, 25-28 July 2010. Nashville, Tennessee.
- Pomeroy, B. R., J. C. Sisco, J. R. Eckstein, and W. E. Anderson 2008. Characterization of gas-centered swirl-coaxial injector stability in a subscale multi-element combustor. Paper AIAA 2008-5249. Presented at 44th AIAA/ASME/SAE/ASEE Joint Propulsion Conference & Exhibit, 21-23 July 2008. Hartford, Connecticut.
- Rey, C., S. Ducruix, F. Richecoeur, P. Scouflaire, L. Vingert, and S. Candel. 2004. High frequency combustion instabilities associated with collective interactions in liquid propulsion. Paper AIAA 2004-3518. Presented at 40th AIAA/ASME/SAE/ASEE Joint Propulsion Conference and Exhibit, 11-14 July 2004, Fort Lauderdale, Florida.
- Richecoeur, F., P. Scouflaire, S. Ducruix, and S. Candel. 2006. High-frequency transverse acoustic coupling in a multiple-injector cryogenic combustor. J. Propul. Power 22 (4):790. doi:10.2514/1.18539.
- Richecoeur, F., P. Scouflaire, S. Ducruix, and S. Candel 2006b, “Interactions between propellant jets and acoustic modes in liquid rocket engines: Experiments and simulations. Paper AIAA 2006-4397. Presented at 42nd AIAA/ASME/SAE/ASEE Joint Propulsion Conference & Exhibit, 9-12 July 2006b, Sacramento, California.
- Roa, M., and D. G. Talley. 2019. Wave dynamic mechanisms in coaxial hydrogen/liquid oxygen jet flames. J. Propul. Power 35 (2):369. doi:10.2514/1.B37079.
- Roa, M., and D. G. Talley. 2021. Transverse acoustic forcing of gaseous hydrogen/liquid oxygen turbulent shear coaxial flames. J. Propul. Power 37 (2):261. doi:10.2514/1.B38084.
- Roa, M., and D. G. Talley. 2022. Ensemble combustion of liquid oxygen/ gaseous hydrogen coaxial flames. Comb. Sci. Tech. accepted for publication, 1–31. doi:10.1080/00102202.2022.2054661.
- Rogers, D. E., and F. E. Marble. 1956. A mechanism for high frequency oscillations in ramjet combustors and afterburners. Jet Propulsion 26:456. doi:10.2514/8.7049.
- Schmid, P. J. 2010. Dynamic mode decomposition of numerical and experimental data. J. Fluid Mech 656:5. doi:10.1017/S0022112010001217.
- Schmitt, T., G. Staffelbach, S. Ducruix, S. Gröning, J. Hardi, and M. Oschwald 2017. Large-eddy simulations of a sub-scale liquid rocket combustor: Influence of fuel injection temperature on thermo-acoustic stability. Paper EUCASS 2017-352. Presented at 7th European Conference for Aeronautics and Space Sciences, 3-6 July, 2017, Milan, Italy.
- Shipley, K. J., W. E. Anderson, M. E. Harvazinski, and V. Sankaran 2014. A computational study of transverse combustion instability mechanisms. Paper AIAA 2014-3680. Presented at 50th AIAA/ASME/SAE/ASEE Joint Propulsion Conference, 28-30 July, Cleveland, Ohio.
- Shipley, K., C. Morgan, W. A. Anderson, M. E. Harvazinski, and V. Sankaran 2013. Computational and experimental investigation of transverse combustion instabilities. Paper AIAA 2013-3992. Presented at 49th AI-AA/ASME/SAE/ASEE Joint Propulsion Conference, 14-17 July 2013, San Jose, California.
- Sliphorst, M., S. Groening, B. Knapp, and M. Oschwald 2011. Combustion instability cou-pling mechanisms between acoustics and LOx/CH4 spray flames. Paper 2011-327. Presented at 49th AIAA Aerospace Sciences Meeting, 4-7 January 2011. Orlando, Florida.
- Sutton, G. P., and O. Biblarz. 2017. Rocket propulsion elements. 9th ed. New Jersey: Wiley. Hoboken.
- Tudisco, P., R. Ranjan, and S. Menon 2016. Numerical investigation of transverse forcing in a multielement, shear-coaxial, high pressure combustor. Paper AIAA 2016-2155. Presented at 54th AIAA Aerospace Sciences Meeting, 4-8 January 2016, San Diego, CA.
- Urbano, A., Q. Douasbin, L. Selle, G. Staffelbach, B. Cuenot, T. Schmitt, S. Ducruix, and S. Candel 2017. Study of flame response to transverse acoustic modes from the LES of a 42-injector rocket engine. Proceedings of the Combustion Institute. 36. 2633. doi:10.1016/j.proci.2016.06.042.
- Urbano, A., L. Selle, G. Staffelbach, B. Cuenot, T. Schmitt, S. Ducruix, and S. Candel. 2016. Exploration of combustion instability triggering using large eddy simulation of a multiple injector liquid rocket engine. Combust. Flame 169:129. doi:10.1016/j.combustflame.2016.03.020.